Publications Mergers & Acquisitions Quarterly Switzerland – Fourth Quarter 2014
- Publications
Mergers & Acquisitions Quarterly Switzerland – Fourth Quarter 2014

SHARE:
In Q4 2014, Swiss M&A market activity remained strong. Although the number of transactions as well as deal volume declined relative to the previous quarter, both remained high in a historical context.
The strong performance of the Swiss M&A market becomes even clearer when viewed from a yearly perspective. With numerous mega deals announced, the calendar year 2014 saw the highest annual transaction volume recorded since the inception of this publication in 2008. An analysis of the number of deals showed that market activity was also above average in 2014.
Looking ahead, the outlook on Swiss M&A activity in 2015 is optimistic. Surpassing the record performance of 2014 will be a difficult task, however. Although market participants’ confidence is high, several risks surfaced towards the end of 2014 which, if they materialize, will likely dampen the appetite to undertake transactions.
Swiss M&A market Q4 2014 and outlook 2015
M&A market Q4 2014
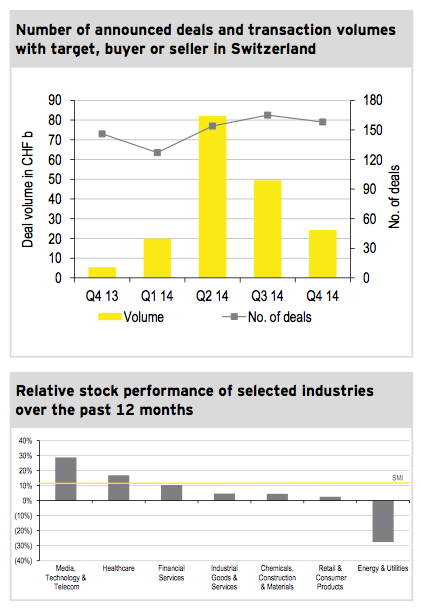
► With 158 transactions recorded in the last quarter of 2014, the number of deals decreased slightly compared to the previous quarter (165 transactions). The number of deals in calendar year 2014 totaled 604, reflecting only a slight increase of 4.1% in comparison to last year’s count of 580 transactions.
► In terms of volume, the Swiss M&A market in 2014 surpassed all previous years since the launch of this publication and reached a deal volume of CHF 175.8b, compared to CHF 20.8b last year. However, deal volume per quarter declined by more than 50%, from CHF 49.4b in Q3 to CHF 24.3b in Q4 2014.
► Calendar year 2014 was mainly driven by high volume transactions, primarily in the second and third quarter. Compared to 2013, the number of transactions with disclosed deal volume above CHF 1b increased from 2 to 30 deals.
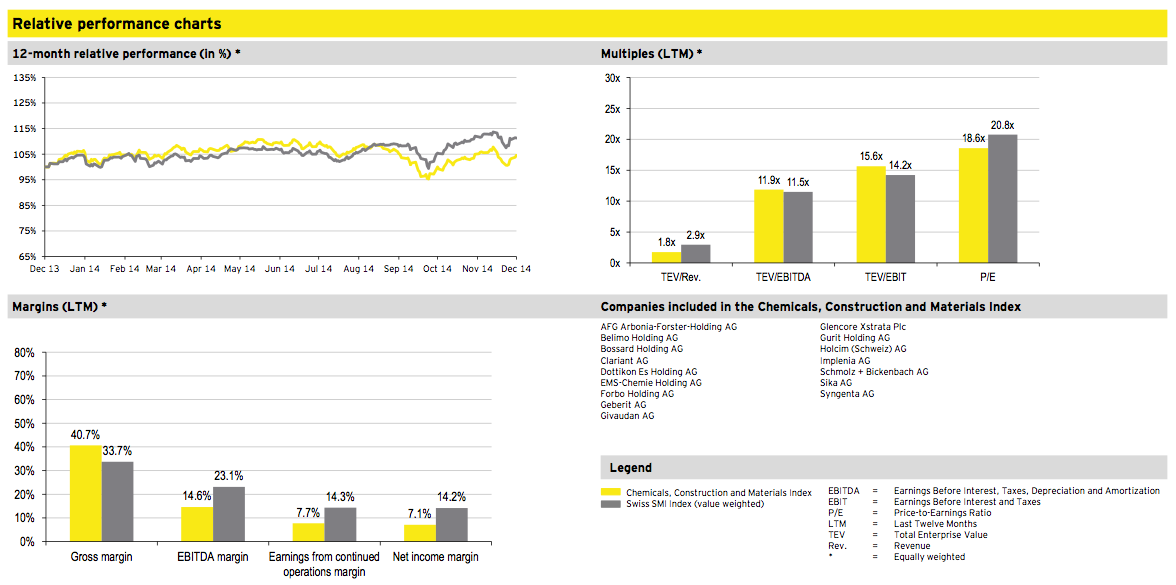
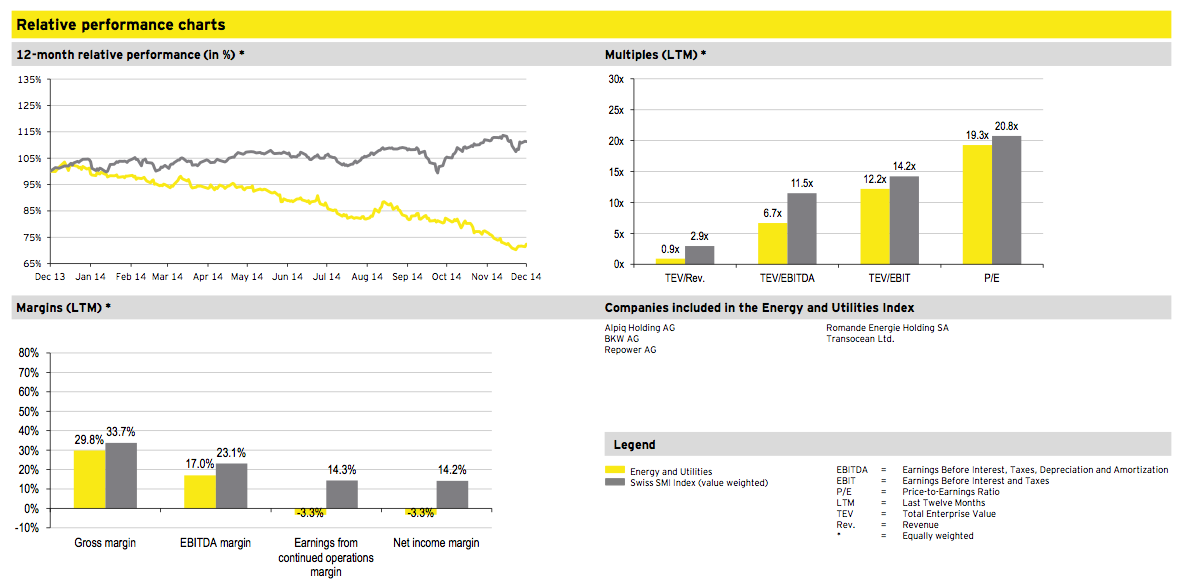
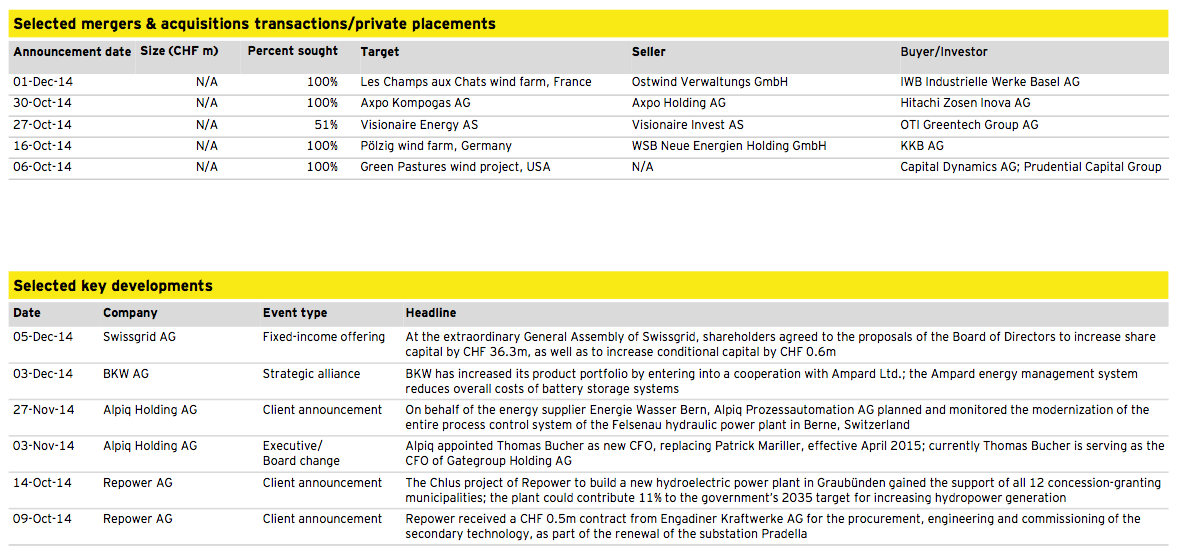
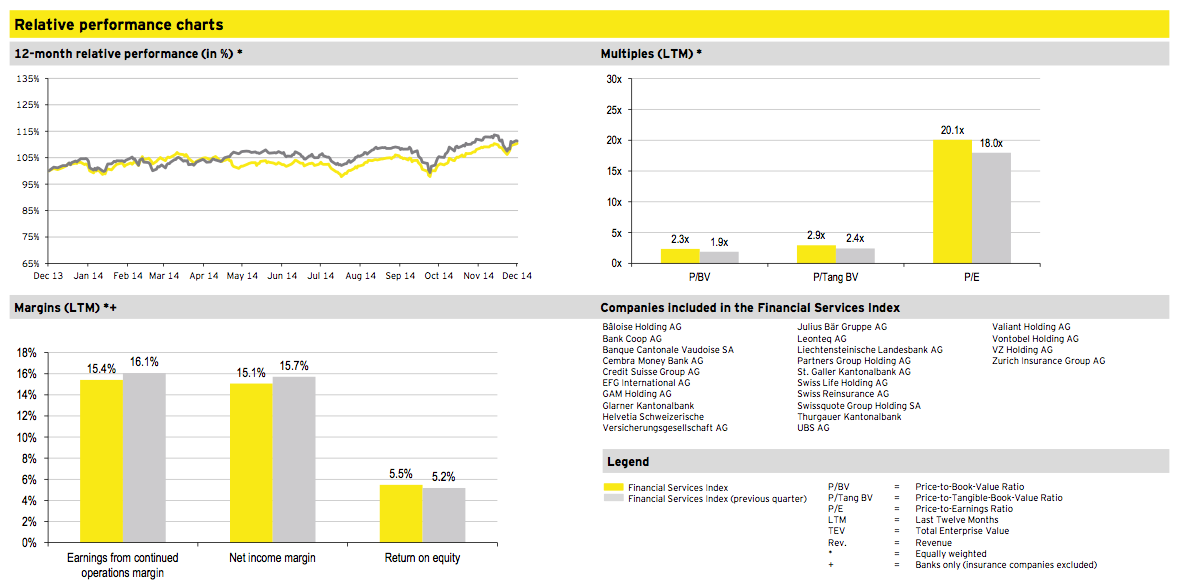
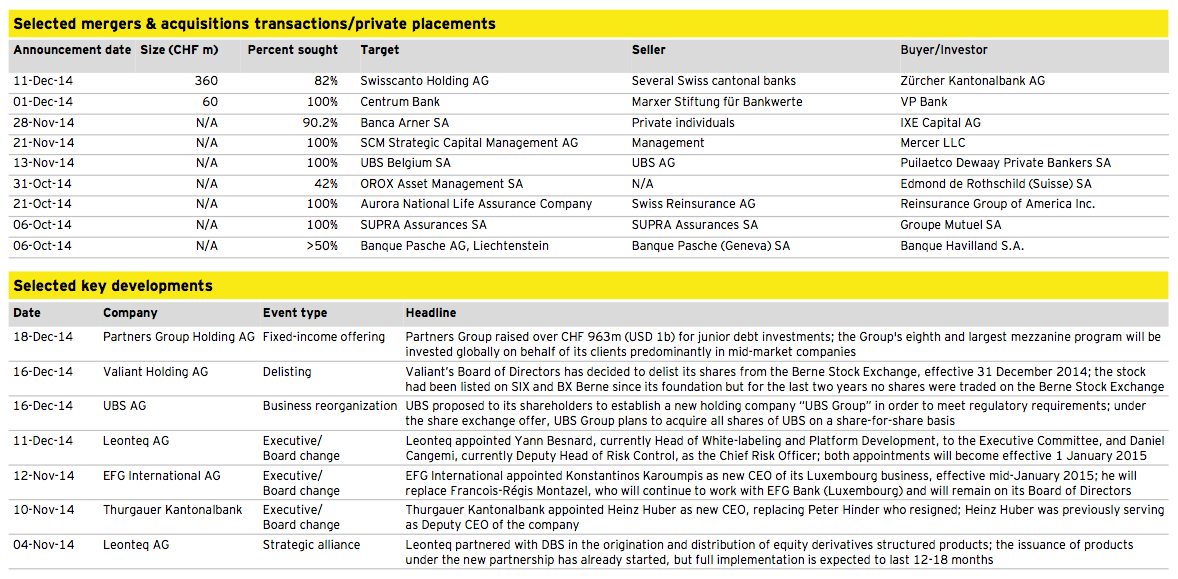
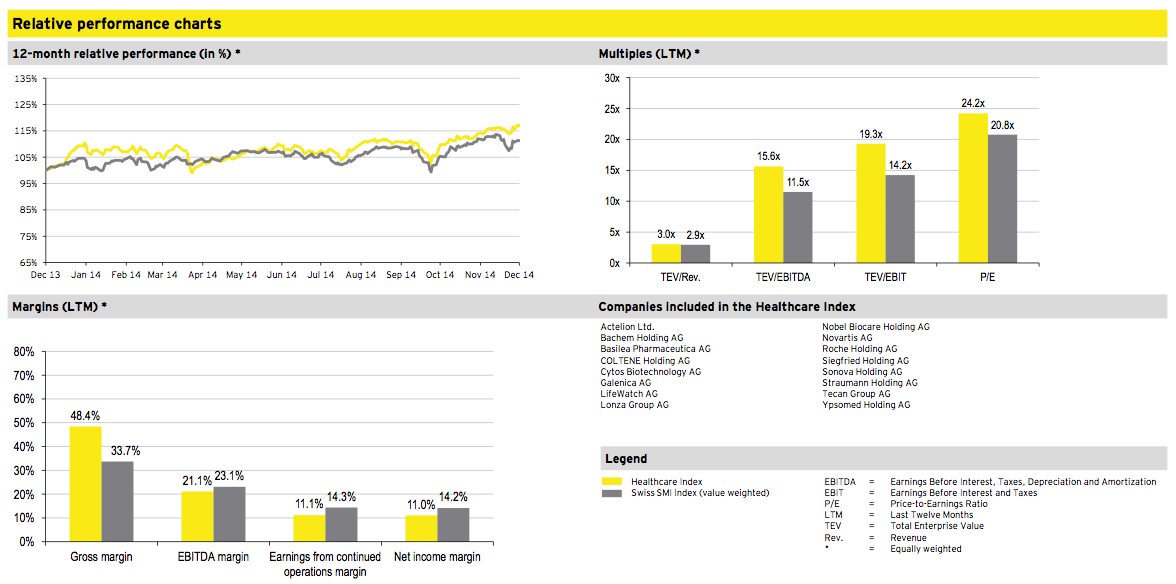
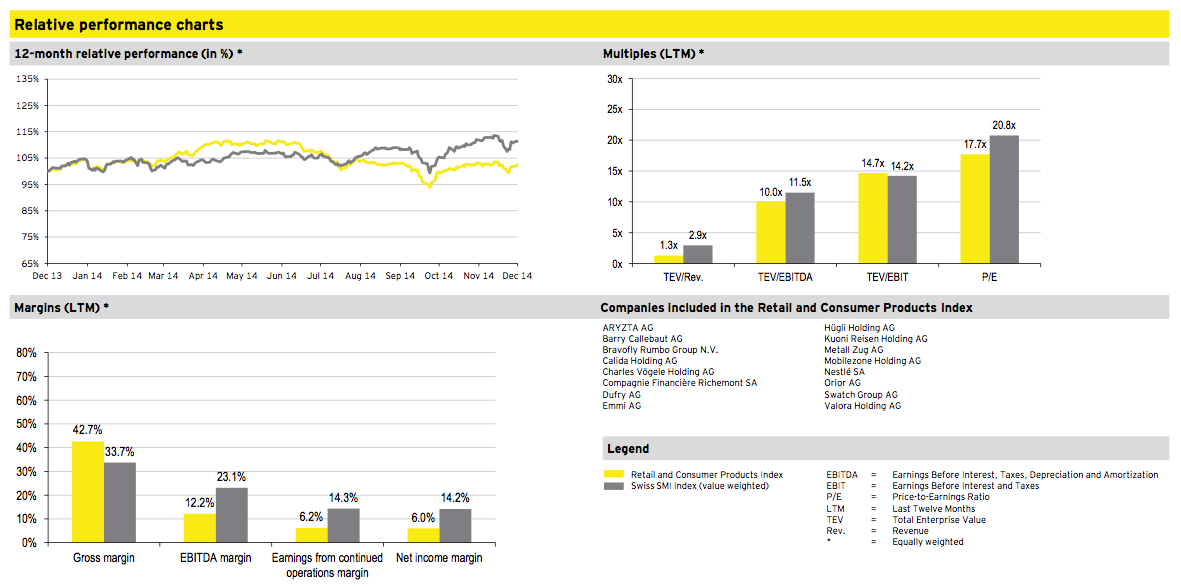
► The SMI gained 11.3% over the last 12-month period, showing positive performance across all sectors except Energy and Utilities.
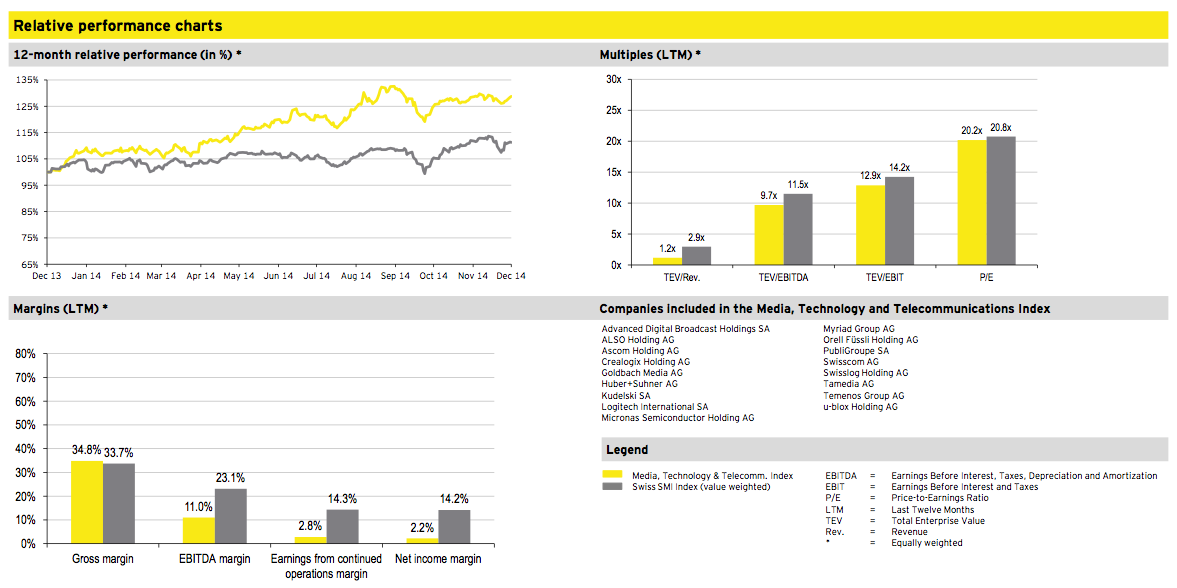
► Media, Technology and Telecommunications displayed the strongest industry performance with an improvement of 28.8% over the last 12 months, thus outperforming the SMI by a factor of around 2.6.

Transactions by industry
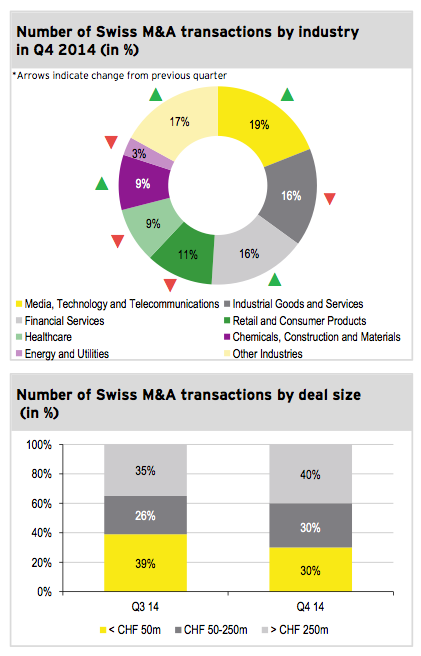
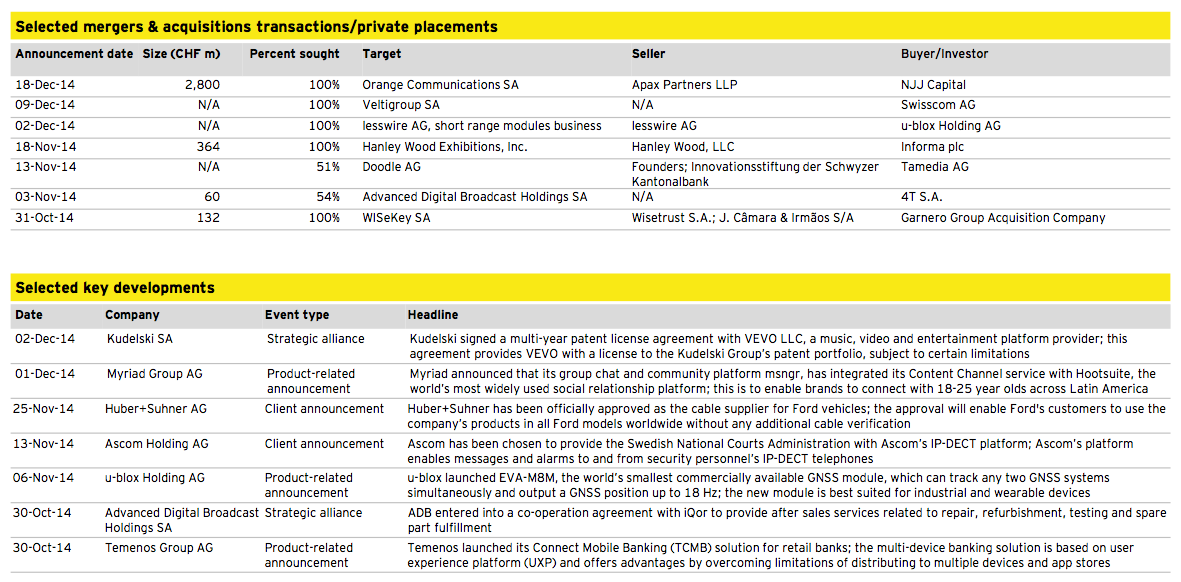
► In the fourth quarter of 2014, Media, Technology and Telecommunications was the most active sector in Switzerland, contributing 30 transactions or 19% to the 158 deals announced in Switzerland. The largest transaction with disclosed deal volume stemming from this sector was the acquisition of Orange Communications by NJJ Capital for ~CHF 2.8b.
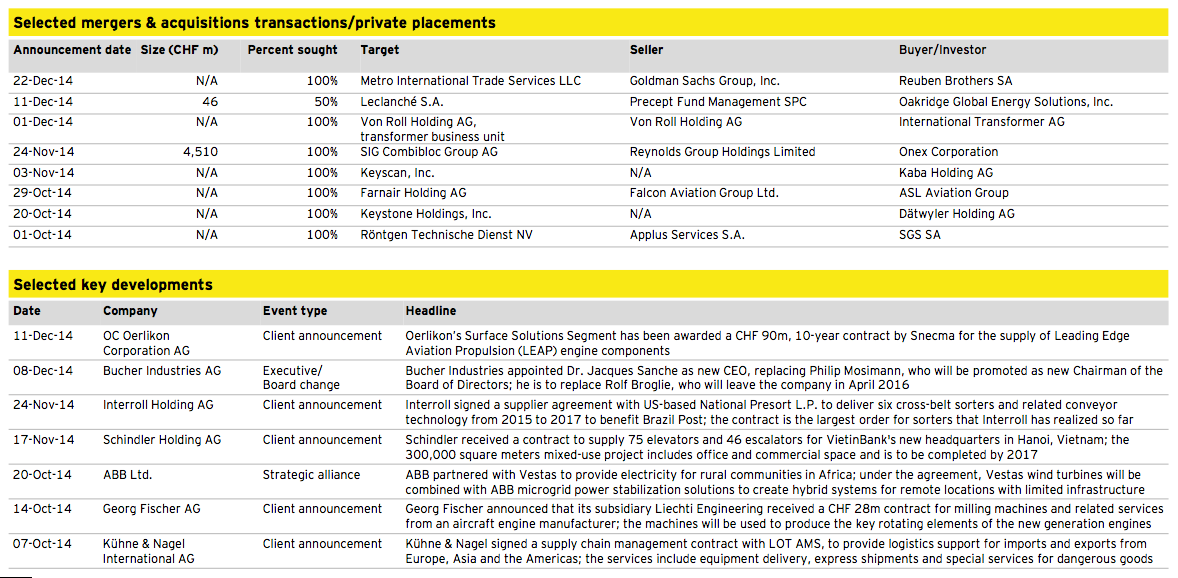
► After being the most active sector in Switzerland for the last four consecutive quarters, Industrial Goods and Services recorded a decline of 5 percentage points in Q4 2014 and ranked second, accounting for 16% of all transactions.
► Healthcare accounted for just 9% of deals in Q4 2014 following exceptional growth in the number of transactions in Q3 2014 when it contributed 17%. However, from a yearly perspective, the sector accounted for 12% of all announced deals – the highest value since 2009.
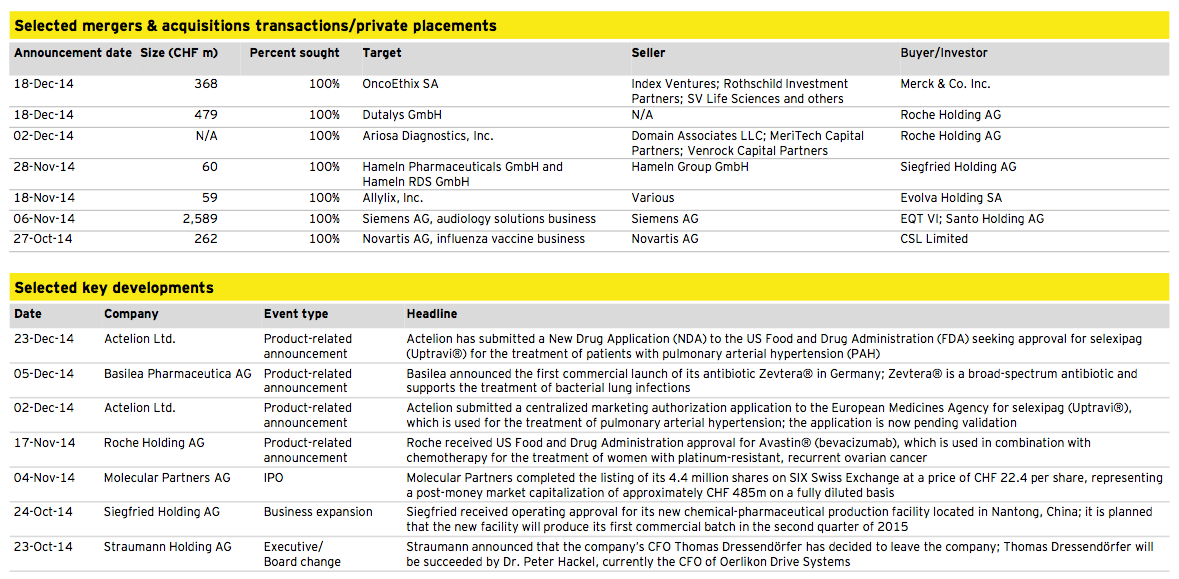
► Furthermore, the Healthcare sector stood out for its exceptional deal volume of CHF 75.9b in calendar year 2014 and accounted for four out of the five largest transactions or 43.2% of the entire 2014 deal volume.
Transactions by size
► In 2014 high volume transactions clearly dominated the Swiss M&A market. Over 2014 as a whole, 62 transactions reached a deal volume above CHF 250m, representing the highest contribution since the inception of this publication in 2008.
► This development was underpinned by a further increase in high volume transactions in Q4 2014, confirming the pattern observed over the previous quarters. It is the first time that this size category has contributed more than 40% of all transactions with disclosed deal volume per quarter.
► Due to an increase in large and mid-market deals, smaller transactions accounted for only 30% in Q4 2014, significantly below the long-term average of 45%.
► Deal size was disclosed for 30% of all announced transactions in Q4 2014.
Outlook 2015
► In December, the Swiss State Secretary for Economic Affairs (SECO) published its new growth forecast for the Swiss economy, predicting a positive development assuming the Euro region continues its gradual recovery. In its forecast, Swiss GDP growth for 2015 is predicted to be 2.1%, slightly above 1.8% for 2014.
► From a monetary policy perspective, the Swiss National Bank took extensive action by introducing negative interest rates on certain types of deposits. This measure aims to keep three-month LIBOR rates within the desired boundaries of -0.75% and 0.25% and maintain the lower CHF/EUR exchange rate limit of 1.20. The Swiss currency recently faced upward revaluation pressure, as investors reacted to crisis surrounding Russia and Greece.
► The outlook on the global economy is mixed, as geopolitical risks continue to exist, especially in regard to the Ukraine crisis, developments in the Middle East and fears around the Eurozone. Most recently the risks associated with a potential recession in Russia further added to the existing uncertainty.
► According to the latest issue of EY’s Capital Confidence Barometer, executives still mostly exhibit confidence in the stability of the global economy and predict growing M&A activity in 2015. Strong equity markets and enhanced corporate earnings have helped to boost the M&A outlook among respondents.
► Overall, the Swiss M&A market is expected to continue its strong performance although it will be tough to beat the record breaking 2014 results. This positive forecast is accompanied by some downside risks, however, mostly associated with global economic and geopolitical developments.
Private equity statistics: Germany, Switzerland and Austria
Private equity Q4 2014
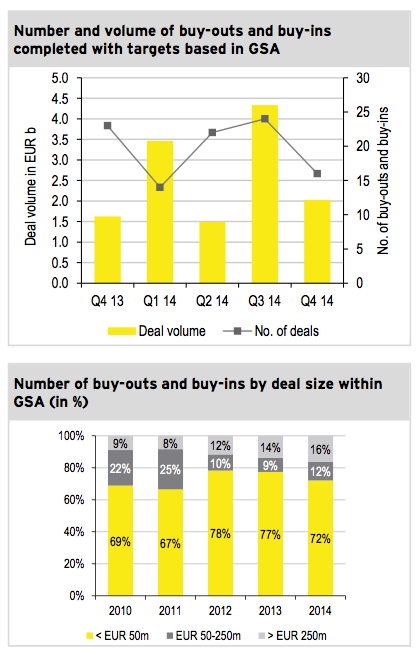
► In Q4 2014, 16 private equity (PE) deals were completed in Germany, Switzerland and Austria (GSA). This reflects a decrease of eight deals compared to Q3 2014. At the same time, deal volume of buy-outs and buy-ins in GSA decreased from EUR 4.3b in the previous quarter to EUR 2.0b in Q4 2014.
► Deal volume in Q4 2014 was mainly attributable to the sale of GEA’s heat exchanger business unit to funds advised by Triton for a consideration of EUR 1.3b, which represents the second largest PE transaction completed in GSA in the entire year 2014. The largest PE transaction closed in calendar year 2014 within GSA was Deutsche Telekom’s sale of Scout 24 Holding to Hellmann & Friedmann, a US-based private equity firm with a total enterprise value of EUR 2.0b.
► Average deal size per quarter decreased by nearly 30% compared to the last quarter, falling to EUR 127m. Also, from a year-to-year perspective, average deal volume decreased from EUR 191m in 2013 to EUR 149m in 2014.
► Overall, the transaction volume of EUR 11.3b in calendar year 2014 was 17% below that of 2013, even though the number of completed PE transaction increased from 71 to 76.
► Compared to the rest of Europe, GSA accounted for 12% of all completed PE transactions in 2014, making it the third most active market region after the UK and France. However, GSA contributed only 3% of Europe’s total transaction volume, while the UK accounted for 30%.
► In 2014, PE transactions with a deal volume of less than EUR 50m represented 72% of all PE transactions completed in GSA compared to 77% in 2013. The decrease in low value transactions benefited both mid- market as well as high volume PE transactions, resulting in a contribution increase of three and two percentage points, respectively.
Chemicals, Construction and Materials
Energy and Utilities
Financial Services
Healthcare
Industrial Goods and Services

Media, Technology and Telecommunications
Retail and Consumer Products
Deal of the quarter
Transaction overview
Deal summary
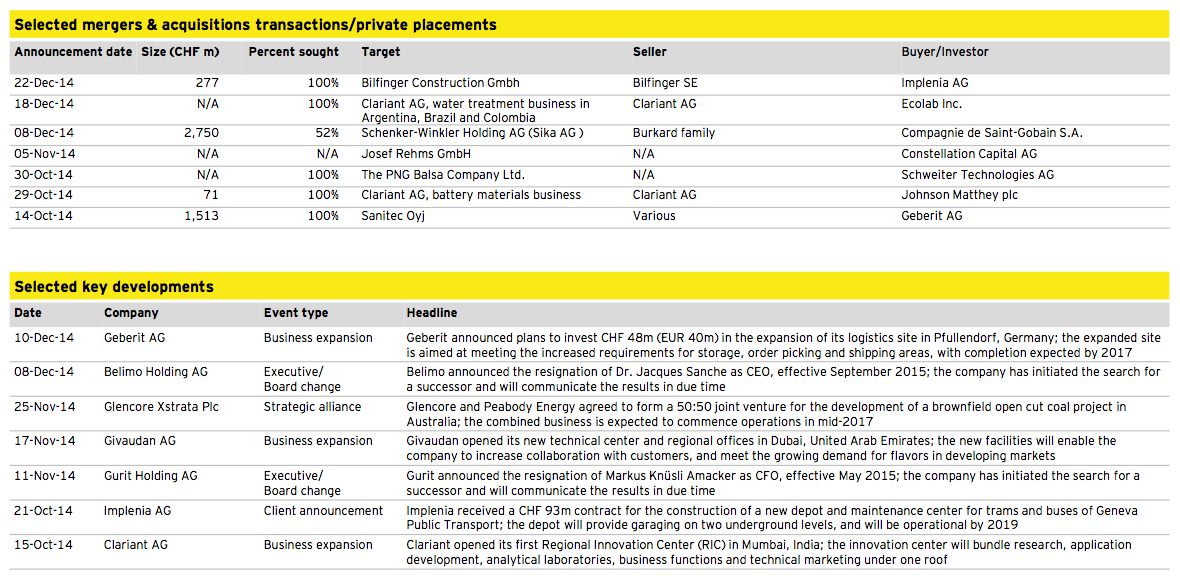
On 14 October 2014, Geberit announced its offer to acquire up to 100% in Sanitec at a price of SEK 97 per share, corresponding to a total transaction value of CHF1.4b. The offer’s acceptance period lasts from 17 November 2014 to 22 December 2014. Sanitec’s two major shareholders, EQT Partners and Zeres Capital, hold a combined stake of 25.5% and gave their irrevocable undertakings to accept the offer. However, the transaction is subject to clearance from relevant merger control authorities. Sanitec shares are planned to be delisted from the Stockholm Stock Exchange following a successful completion of the transaction.
Sanitec is a producer and supplier of bathroom ceramics based in Finland. The company employs 6,200 people, with net sales of ~CHF 850m in 2013. Based on 2013 figures, a combined entity would generate sales of ~CHF 2.9b and operating profit of ~CHF 600m.
Deal rationale
► Geberit and Sanitec are considered complementary with regard to their product offerings of behind-the-wall technology and in-front-of-the-wall products, respectively.
► The transaction is expected to strengthen Geberit’s position as a multi-brand company and expand its customer base through direct access to end users via Sanitec’s showrooms and established regional brands.
► Potential synergies of ~CHF 55m per annum at EBIT level are expected to be realized in the medium term, by implementing continuous productivity improvements and a lean functional organization structure.



Stay up to date with M&A news!
Subscribe to our newsletter

