M&A Statistics
M&A Statistics
IMAA offers extensive and up-to-date information, data, research on M&A and Mergers & Acquisitions statistics for registered users. Corporate members have access to tailored research services.
M&A Deal
We provide you with selected, regularly updated M&A statistics
In this section the Institute of Mergers, Acquisitions and Alliances (IMAA) provides you with selected, regularly updated M&A statistics worldwide and for various regions or industries. As a free user or individual / corporate member of our Institute you have full access and can also download M&A data and statistics with the actual numbers in spreadsheets (google sheets and excel format). Please see our Membership section to sign up.
Follow Any M&A Statistics
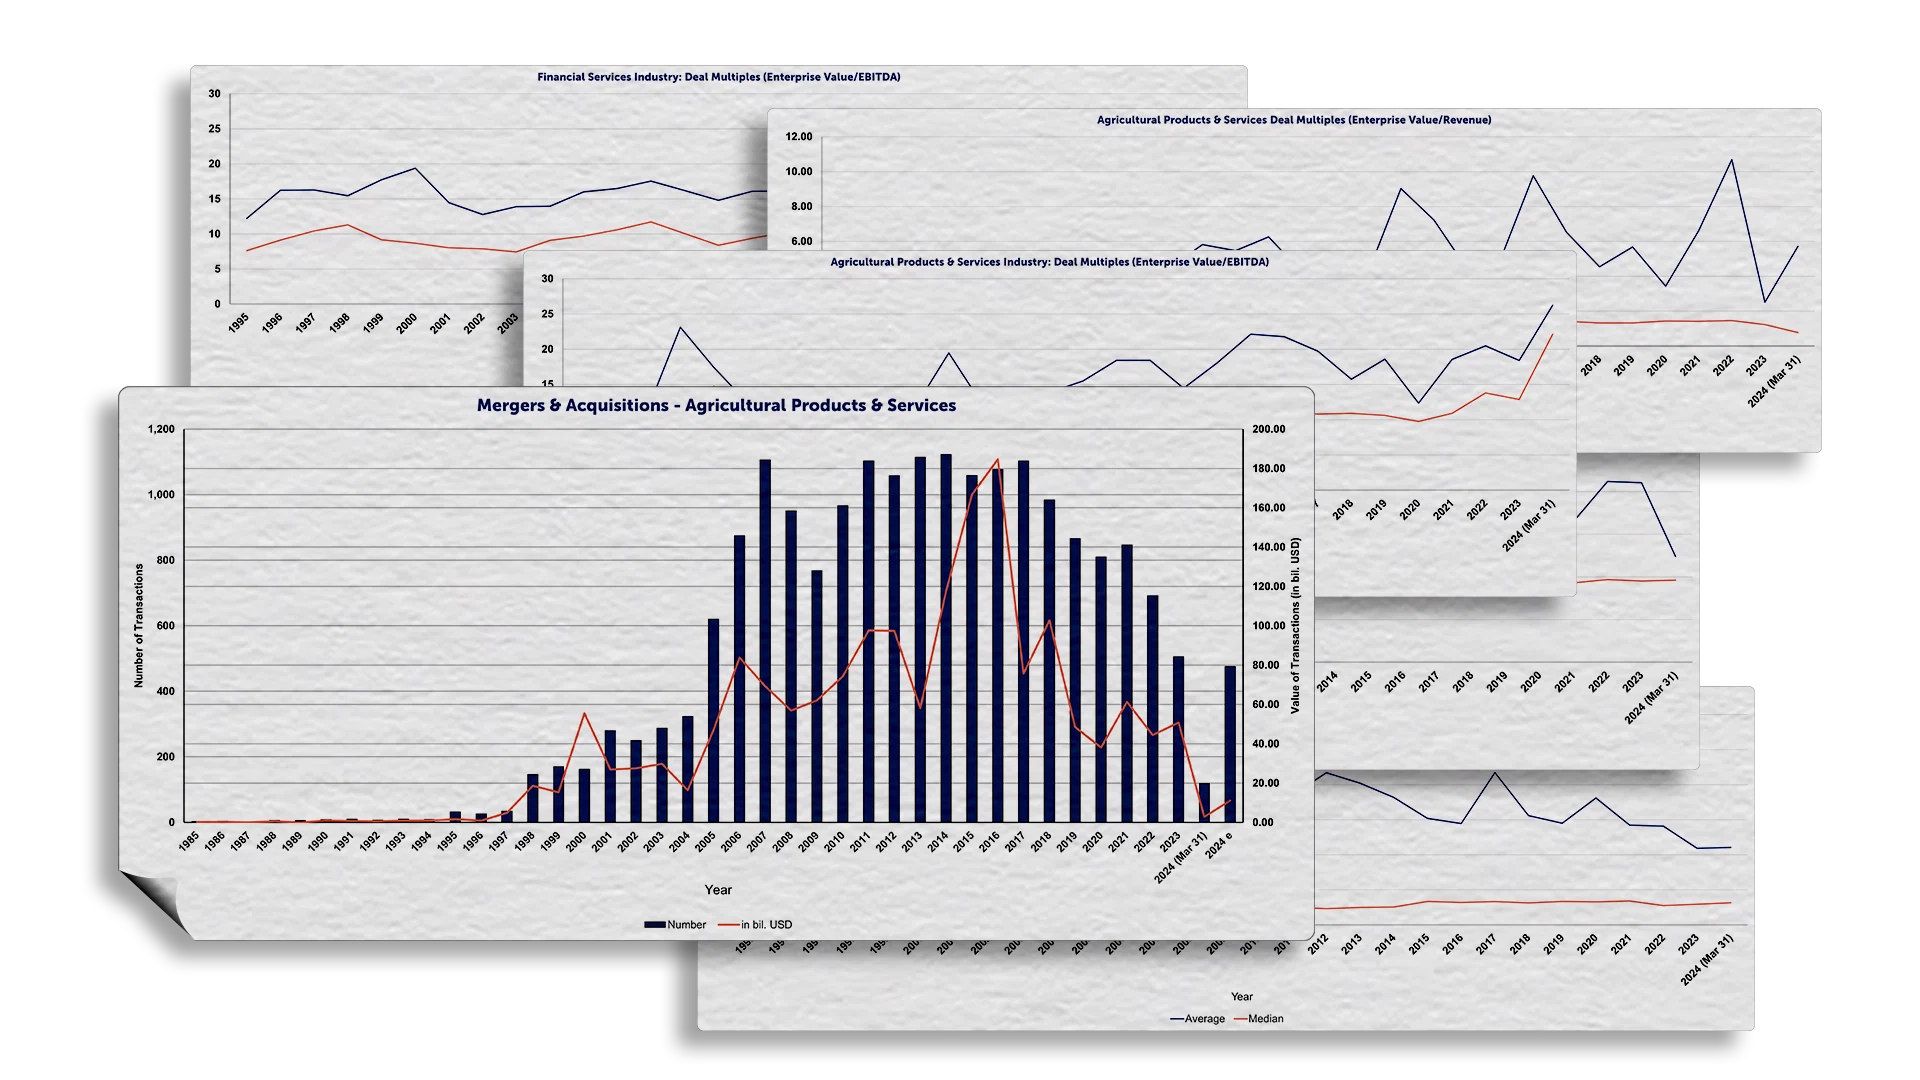
Number & Value of M&A Worldwide
Since 2000, more than 790’000 transactions have been announced worldwide with a known value of over 57 trillion USD. In 2018, the number of deals has decreased by 8% to about 49’000 transactions, while their value has increased by 4% to 3.8 trillion USD.
Login or Become a Member or Free User to download Number and Value not only in USD but also in EUR, GBP, and YEN as a Spreadsheet
Number & Value of M&A North America
Login or Become a Member or Free User to download Number and Value not only in USD but also in EUR, GBP, and YEN as a Spreadsheet
Number & Value of M&A Europe
Login or Become a Member or Free User to download Number and Value not only in USD but also in EUR, GBP, and YEN as a Spreadsheet
Number & Value of M&A Western Europe
Login or Become a Member or Free User to download Number and Value not only in USD but also in EUR, GBP, and YEN as a Spreadsheet
Number & Value of M&A Eastern Europe
Login or Become a Member or Free User to download Number and Value not only in USD but also in EUR, GBP, and YEN as a Spreadsheet
Number & Value of M&A Asia-Pacific
Login or Become a Member or Free User to download Number and Value not only in USD but also in EUR, GBP, and YEN as a Spreadsheet
Number & Value of M&A South East Asia / ASEAN
Login or Become a Member or Free User to download Number and Value not only in USD but also in EUR, GBP, and YEN as a Spreadsheet
Number & Value of M&A Gulf Cooperation Council (GCC)
Login or Become a Member or Free User to download Number and Value not only in USD but also in EUR, GBP, and YEN as a Spreadsheet
Number & Value of M&A Middle East & North Africa (MENA)
Login or Become a Member or Free User to download Number and Value not only in USD but also in EUR, GBP, and YEN as a Spreadsheet
Number & Value of M&A South America
Login or Become a Member or Free User to download Number and Value not only in USD but also in EUR, GBP, and YEN as a Spreadsheet
Largest M&A Transactions Worldwide
The latest trasnactions to make it into the global top 10 transactions was Walt Disney’s acquistion of 21st Century Fox for 84 bil. USD in 2017 and Bristol-Myers Squibb’s acquisition of Celgene (see table below). Last year, two transactions got on the list of the top 50 (available as a download), nameley Cigna’s acquisition of Express Scripts, Tadeka Pharmaceutical’s acquisition of Shire.
| Rank | Year | Acquirer Name | Target Name | Value of Transaction (in bil. USD) | Value of Transaction (in bil. EUR) |
| 1 | 1999 | Vodafone AirTouch PLC | Mannesmann AG | 202,7 | 204.7 |
| 2 | 2000 | America Online Inc | Time Warner | 164,7 | 160,7 |
| 3 | 2013 | Verizon Communications Inc | Verizon Wireless Inc | 130.2 | 100.5 |
| 4 | 2007 | Shareholders (Spin out) | Philip Morris Intl Inc | 107.6 | 68.1 |
| 5 | 2015 | Anheuser-Busch Inbev SA/NV | SABMiller PLC | 101.5 | 92,3 |
| 6 | 2007 | RFS Holdings BV | ABN-AMRO Holding NV | 98.2 | 71,3 |
| 7 | 1999 | Pfizer Inc | Warner-Lambert Co | 89.6 | 85.3 |
| 8 | 2017 | Walt Disney Co | 21st Century Fox Inc | 84.2 | 72.5 |
| 9 | 2016 | AT&T Inc | Time Warner Inc | 79,4 | 72.9 |
| 10 | 2019 | Bristol-Myers Squibb Co | Celgene Corp | 79.4 | 69,7 |
Login or Become a Member or Free User to download Number and Value not only in USD but also in EUR, GBP, and YEN as a Spreadsheet
Largest M&A Transactions North America
| Rank | Year | Acquirer Name | Target Name | Value of Transaction (in bil. USD) | Value of Transaction (in bil. EUR) |
| 1 | 2000 | America Online Inc | Time Warner | 164.7 | 160.7 |
| 2 | 2013 | Verizon Communications Inc | Verizon Wireless Inc | 130.3 | 100.5 |
| 3 | 1999 | Pfizer Inc | Warner-Lambert Co | 89.6 | 85.3 |
| 4 | 2017 | Walt Disney Co | 21st Century Fox Inc | 84.2 | 72.5 |
| 5 | 2016 | AT&T Inc | Time Warner Inc | 79.4 | 72.9 |
| 6 | 2019 | Bristol-Myers Squibb Co | Celgene Corp | 79.4 | 69.7 |
| 7 | 1998 | Exxon Corp | Mobil Corp | 78.9 | 68.4 |
| 8 | 2006 | AT&T Inc | BellSouth Corp | 72.7 | 60.2 |
| 9 | 1998 | Travelers Group Inc | Citicorp | 72.6 | 67.2 |
| 10 | 2001 | Comcast Corp | AT&T Broadband & Internet Svcs | 72.0 | 85.1 |
Login or Become a Member or Free User to download Number and Value not only in USD but also in EUR, GBP, and YEN as a Spreadsheet
Largest M&A Transactions Europe
| Rank | Jahr | Acquirer | Target | Value (in bil. USD) | Value (in bil. EUR) | Deal Status |
| 1 | 1999 | Vodafone AirTouch PLC | Mannesmann AG | 202.79 | 204.79 | Completed |
| 2 | 2007 | Spin-off | Philip Morris Intl Inc | 107.65 | 68.08 | Completed |
| 3 | 2015 | Anheuser-Busch Inbev SA/NV | SABMiller PLC | 101.10 | 91.93 | Completed |
| 4 | 2007 | RFS Holdings BV | ABN-AMRO Holding NV | 98.19 | 71.3 | Completed |
| 5 | 2000 | Glaxo Wellcome PLC | SmithKline Beecham PLC | 75.96 | 74.9 | Completed |
| 6 | 2004 | Royal Dutch Petroleum Co | Shell Transport & Trading Co | 74.56 | 58.49 | Completed |
| 7 | 2015 | Royal Dutch Shell PLC | BG Group PLC | 69.45 | 64.4 | Completed |
| 8 | 2006 | Gaz de France SA | Suez SA | 60.86 | 44.64 | Completed |
| 9 | 1999 | Vodafone Group PLC | AirTouch Communications Inc | 60.29 | 51.65 | Completed |
| 10 | 2004 | Sanofi-Synthelabo SA | Aventis SA | 60.24 | 49.99 | Completed |
| 11 | 2016 | Bayer AG | Monsanto Co | 56.60 | 49.75 | Pending |
| 12 | 2008 | InBev NV | Anheuser-Busch Cos Inc | 52.18 | 39.73 | Completed |
| 13 | 1999 | Total Fina SA | Elf Aquitaine | 50.07 | 48.33 | Completed |
| 14 | 2016 | British American Tobacco PLC | Reynolds American Inc | 49.05 | 45.06 | Pending |
| 15 | 1998 | British Petroleum Co PLC | Amoco Corp | 48.17 | 43.53 | Completed |
| 16 | 2008 | Roche Holding AG | Genentech Inc | 46.69 | 29.32 | Completed |
| 17 | 2000 | France Telecom SA | Orange PLC | 45.97 | 50.78 | Completed |
| 18 | 2016 | CNAC Saturn (NL) BV | Syngenta AG | 44.18 | 40.43 | Pending |
| 19 | 2014 | Medtronic Inc | Covidien PLC | 42.73 | 31.56 | Completed |
| 20 | 2009 | HM Treasury | Royal Bank of Scotland Group | 41.88 | 28.45 | Completed |
| 21 | 1998 | Daimler-Benz AG | Chrysler Corp | 40.47 | 36.28 | Completed |
| 22 | 2000 | Vivendi SA | Seagram Co Ltd | 40.43 | 42.23 | Completed |
| 23 | 1999 | Royal Bank of Scotland Group | National Westminster Bank PLC | 38.41 | 39.6 | Completed |
| 24 | 2006 | Banca Intesa SpA | SanPaolo IMI SpA | 37.62 | 29.49 | Completed |
| 25 | 2012 | Glencore International PLC | Xstrata PLC | 37.44 | 29.21 | Completed |
Largest M&A Transactions Western Europe
| Rank | Jahr | Acquirer | Target | Value (in bil. USD) | Value (in bil. EUR) | Deal Status |
| 1 | 1999 | Vodafone AirTouch PLC | Mannesmann AG | 202.79 | 204.79 | Completed |
| 2 | 2007 | Spin-off | Philip Morris Intl Inc | 107.65 | 68.08 | Completed |
| 3 | 2015 | Anheuser-Busch Inbev SA/NV | SABMiller PLC | 101.10 | 91.93 | Completed |
| 4 | 2007 | RFS Holdings BV | ABN-AMRO Holding NV | 98.19 | 71.3 | Completed |
| 5 | 2000 | Glaxo Wellcome PLC | SmithKline Beecham PLC | 75.96 | 74.9 | Completed |
| 6 | 2004 | Royal Dutch Petroleum Co | Shell Transport & Trading Co | 74.56 | 58.49 | Completed |
| 7 | 2015 | Royal Dutch Shell PLC | BG Group PLC | 69.45 | 64.4 | Completed |
| 8 | 2006 | Gaz de France SA | Suez SA | 60.86 | 44.64 | Completed |
| 9 | 1999 | Vodafone Group PLC | AirTouch Communications Inc | 60.29 | 51.65 | Completed |
| 10 | 2004 | Sanofi-Synthelabo SA | Aventis SA | 60.24 | 49.99 | Completed |
| 11 | 2016 | Bayer AG | Monsanto Co | 56.60 | 49.75 | Pending |
| 12 | 2008 | InBev NV | Anheuser-Busch Cos Inc | 52.18 | 39.73 | Completed |
| 13 | 1999 | Total Fina SA | Elf Aquitaine | 50.07 | 48.33 | Completed |
| 14 | 2016 | British American Tobacco PLC | Reynolds American Inc | 49.05 | 45.06 | Pending |
| 15 | 1998 | British Petroleum Co PLC | Amoco Corp | 48.17 | 43.53 | Completed |
| 16 | 2008 | Roche Holding AG | Genentech Inc | 46.69 | 29.32 | Completed |
| 17 | 2000 | France Telecom SA | Orange PLC | 45.97 | 50.78 | Completed |
| 18 | 2016 | CNAC Saturn (NL) BV | Syngenta AG | 44.18 | 40.43 | Pending |
| 19 | 2014 | Medtronic Inc | Covidien PLC | 42.73 | 31.56 | Completed |
| 20 | 2009 | HM Treasury | Royal Bank of Scotland Group | 41.88 | 28.45 | Completed |
| 21 | 1998 | Daimler-Benz AG | Chrysler Corp | 40.47 | 36.28 | Completed |
| 22 | 2000 | Vivendi SA | Seagram Co Ltd | 40.43 | 42.23 | Completed |
| 23 | 1999 | Royal Bank of Scotland Group | National Westminster Bank PLC | 38.41 | 39.6 | Completed |
| 24 | 2006 | Banca Intesa SpA | SanPaolo IMI SpA | 37.62 | 29.49 | Completed |
| 25 | 2012 | Glencore International PLC | Xstrata PLC | 37.44 | 29.21 | Completed |
Largest M&A Transactions Eastern Europe
| Rank | Year | Acquirer | Target | Value (in bil. USD) | Value (in bil. EUR) | Deal Status |
| 1 | 2012 | NK Rosneft' | TNK-BP Ltd | 53.9 | 41.8 | Completed |
| 2 | 2003 | Yukosneftegaz | Sibneft | 13.6 | 12.4 | Completed |
| 3 | 2005 | Gazprom | Sibneft | 13.1 | 10.9 | Completed |
| 4 | 2005 | Spin-off | Polyus | 12.9 | 9.9 | Completed |
| 5 | 2007 | Spin-off | HydroOGK | 12.4 | 8.5 | Completed |
| 6 | 2016 | QHG Shares Pte Ltd | NK Rosneft' | 10.8 | 10.2 | Completed |
| 7 | 2008 | Vladimir Potanin | GMK Noril'skii Nikel' | 9.7 | 6.2 | Pending |
| 8 | 2004 | BaikalFinans Group | Yuganskneftegaz | 9.3 | 7 | Completed |
| 9 | 2011 | Evraz plc | Evraz Group SA | 8.3 | 6.1 | Completed |
| 10 | 2016 | Asahi Group Holdings Ltd | Plzensky Prazdroj As | 7.8 | 7.3 | Pending |
| 11 | 1994 | Split-off | Nafta Moskva | 7.7 | 6.1 | Pending |
| 12 | 2007 | RN-Razvitye | NK Rosneft' | 7.6 | 5.7 | Completed |
| 13 | 2003 | BP PLC-Russian Assets | Alfa,Renova-Russian Assets | 7.6 | 7.1 | Completed |
| 14 | 2005 | Gazprom | Sakhalin 2 Project | 7.5 | 5.7 | Completed |
| 15 | 2005 | Rosneftegaz | Gazprom | 7.1 | 5.8 | Completed |
| 16 | 2007 | Neft'-Aktiv | Yukossibneft Oil Co-Lot 10 | 6.8 | 5 | Completed |
| 17 | 2010 | Uralkali | Sil'vinit | 6.8 | 5.1 | Completed |
| 18 | 2011 | Spartan Capital Hldgs Sp zoo | Polkomtel SA | 6.6 | 4.6 | Completed |
| 19 | 2005 | Oger Telecom Ltd | Turk Telekomunikasyon AS | 6.6 | 5.5 | Completed |
| 20 | 2007 | Neft'-Aktiv | Yukossibneft Oil Co-Lot 11 | 6.4 | 4.7 | Completed |
Largest M&A Transactions Asia-Pacific
| Rank | Year | Acquirer | Nation | Target | Value (in bil. USD) | Value (in bil. EUR) | Deal Status | ||
| 1 | 2014 | CITIC Pacific Ltd | Hong Kong | CITIC Ltd | China | 42.2 | 32.0 | 25.5 | Completed |
| 2 | 2000 | Pacific Century CyberWorks Ltd | Hong Kong | Cable & Wireless HKT | Hong Kong | 37.4 | 38.4 | 23.5 | Completed |
| 3 | 2015 | Spin-off | Hong Kong | Cheung Kong (Hldg) Ltd- Ppty | Hong Kong | 36.9 | 32.7 | 24.0 | Completed |
| 4 | 2000 | China Telecom Hong Kong Ltd | Hong Kong | Beijing Mobile,6 others | China | 34.2 | 39.7 | 23.8 | Completed |
| 5 | 2008 | China Unicom Ltd | Hong Kong | China Netcom Grp(HK)Corp Ltd | Hong Kong | 25.4 | 16.4 | 13,0 | Completed |
| 6 | 2015 | Cheung Kong(Holdings)Ltd | Hong Kong | Hutchison Whampoa Ltd | Hong Kong | 23.6 | 20 | 15,6 | Completed |
| 7 | 2015 | China Tower Corp Ltd | China | China-Telecommun tower asts | China | 18.3 | 16.1 | 12.0 | Completed |
| 8 | 2012 | China Telecom Corp Ltd | China | China Telecom Corp-3G Assets | China | 18 | 14.4 | 11.4 | Completed |
| 9 | 2008 | Westpac Banking Corp | Australia | St George Bank Ltd | Australia | 17.9 | 11.6 | 9.2 | Completed |
| 10 | 2014 | Investor Group | China | Sinopec Sales Co Ltd | China | 17.5 | 13.5 | 10.7 | Completed |
| 11 | 2007 | Spin-off | South Korea | SK Corp-Petrochemical Business | South Korea | 17 | 12.4 | 8.3 | Completed |
| 12 | 2016 | Maanshan Dingtai Rare Earth & | China | SF Holding (Group) Co Ltd | China | 16.8 | 15.0 | 11.6 | Completed |
| 13 | 2007 | Wesfarmers Ltd | Australia | Coles Group Ltd | Australia | 15.3 | 11.3 | 7.6 | Completed |
| 14 | 2006 | Kemble Water Ltd | Australia | Thames Water PLC | United Kingdom | 14.9 | 11.9 | 8.0 | Completed |
| 15 | 2016 | Jinan Diesel Engine Co Ltd | China | CNPC Capital Co Ltd | China | 14.5 | 13.0 | 10.9 | Completed |
| 16 | 2008 | Shining Prospect Pte Ltd | Singapore | Rio Tinto PLC | United Kingdom | 14.23 | 9.7 | 7.2 | Completed |
| 17 | 2006 | Cemex SAB de CV | Mexico | Rinker Group Ltd | Australia | 14.2 | 10.6 | 7.2 | Completed |
| 18 | 2015 | China Resources (Hldg) Co Ltd | Hong Kong | Ondereel Ltd,Best-Growth es | Hong Kong | 14 | 12.4 | 9.0 | Completed |
| 19 | 2015 | China Yangtze Power Co Ltd | China | Sanxia Jinsha River Chuanyun | China | 14 | 13 | 9.3 | Completed |
| 20 | 2015 | Petrol Complex Pte Ltd | Singapore | Essar Oil Ltd | India | 12.9 | 11.8 | 10.6 | Pending |
| 21 | 2014 | CSR Corp Ltd | China | China CNR Corp Ltd | China | 12.8 | 10.6 | 8.2 | Completed |
| 22 | 2007 | Vodafone Group PLC | United Kingdom | Hutchison Essar Ltd | India | 12.7 | 9.4 | 6.4 | Completed |
| 23 | 2016 | Investor Group | Australia | Ausgrid Pty Ltd | Australia | 12.5 | 11.4 | 10.2 | Completet |
| 24 | 2015 | Investor Group | China | Tongfang Guoxin Electns Co Ltd | China | 12.0 | 11.1 | 7.9 | Pending |
| 25 | 2017 | Vodafone Grp PLC Vodafone Asts | India | Idea Cellular Ltd0Mobile Bus | India | 11.6 | 10.8 | 9.4 | Pending |
Largest M&A Transactions South East Asia / ASEAN
| Rank | Year | Acquirer | Target | Value (in bil. USD) | Value (in bil. EUR) | Deal Status |
| 1 | 2008 | Shining Prospect Pte Ltd | Rio Tinto PLC | 14.3 | 9.7 | Completed |
| 2 | 2015 | Petrol Complex Pte Ltd | Essar Oil Ltd | 12.9 | 11.8 | Pending |
| 3 | 2016 | QHG Shares Pte Ltd | NK Rosneft' | 10.8 | 10.2 | Completed |
| 4 | 2007 | Government of Singapore Invest | UBS AG | 9.8 | 6.6 | Completed |
| 5 | 2012 | Investor Group | Ping An Insurance (Grp) Co | 9.4 | 7.2 | Completed |
| 6 | 2007 | Spin-off | TM International Sdn Bhd | 9 | 5.7 | Completed |
| 7 | 2001 | Singapore Telecommunications | Cable & Wireless Optus Lt | 8.5 | 9.5 | Completed |
| 8 | 2014 | Investor Group | IndCor Properties Inc | 8.1 | 6.5 | Completed |
| 9 | 2007 | Investor Group | Alinta Ltd | 7.5 | 5.5 | Completed |
| 10 | 2010 | PLUS Malaysia Sdn Bhd | Plus Expressways Bhd | 7.5 | 5.3 | Completed |
| 11 | 2012 | TCC Assets Ltd | Fraser & Neave Ltd | 6.9 | 5.2 | Completed |
| 12 | 2008 | Government of Singapore Invest | Citigroup Inc | 6.9 | 4.7 | Completed |
| 13 | 2001 | DBS Group Holdings Ltd | Dao Heng Bank Group(Guoco) | 5.7 | 6.4 | Completed |
| 14 | 2014 | Mayon Investments Pte Ltd | AS Watson Holdings Ltd | 5.7 | 4.1 | Completed |
| 15 | 2001 | UOB | Overseas Union Bank Ltd | 5.5 | 6.4 | Completed |
| 16 | 2005 | Spin-off | Sterling Energy-Philippine Ast | 5.4 | 4.4 | Completed |
| 17 | 2013 | Bank of Tokyo-Mitsubishi UFJ | Bank of Ayudhya PCL | 5.3 | 3.9 | Completed |
| 18 | 2014 | OCBC Pearl Ltd | Wing Hang Bank Ltd | 4.8 | 3.5 | Completed |
| 19 | 2007 | Binariang GSM Sdn Bhd | Maxis Communications Bhd | 4.7 | 3.4 | Completed |
| 20 | 2015 | Global Logistic Properties Ltd | Industrial Income Tr Inc-US | 4.6 | 4.1 | Completed |
| 21 | 2006 | Synergy Drive Sdn Bhd | Sime Darby Bhd | 4.4 | 3.4 | Completed |
| 22 | 2007 | Temasek Holdings(Pte)Ltd | Merrill Lynch & Co Inc | 4.4 | 3.1 | Completed |
| 23 | 2006 | PSA Corp Ltd | Hutchison Port Holdings Ltd | 4.4 | 3.6 | Completed |
| 24 | 2012 | Heineken International BV | Asia Pacific Breweries Ltd | 4.3 | 3.5 | Completed |
| 25 | 2013 | CP ALL PCL | Siam Makro PCL | 4.2 | 3.2 | Completed |
| 26 | 2016 | Exxon Mobil Corp | InterOil Corp | 3.95 | 3.75 | Completed |
| 27 | 2007 | Investor Group | Transco | 4 | 2.7 | Completed |
| 28 | 2009 | Advanced Tech Invest Co LLC | Chartered Semiconductor Mnfg | 3.9 | 2.7 | Completed |
| 29 | 2008 | Bakrie & Brothers Tbk PT | Bumi Resources Tbk PT | 3.9 | 2.7 | Completed |
| 30 | 2011 | PTT Chemical PCL | PTT Aromatics & Refining PCL | 3.8 | 2.7 | Completed |
Largest M&A Transactions Gulf Cooperation Council (GCC)
| Rank | Acquirer | Target | Value (in bil. USD) | Value (in bil. EUR) | Deal Status |
| 1 | National Bank of Abu Dhabi | First Gulf Bank PJSC | 14.84 | 13.32 | Completed |
| 2 | SABIC | GE Plastics | 11.6 | 8.9 | Completed |
| 3 | Qatar Investment Authority | Volkswagen AG | 9.6 | 6.7 | Completed |
| 4 | Al Noor Hospitals Group PLC | Mediclinic International Ltd | 9.3 | 8.2 | Completed |
| 5 | EMAL | DUBAL | 7.5 | 5.7 | Completed |
| 6 | Abu Dhabi Investment Authority | Citigroup Inc | 7.5 | 5 | Completed |
| 7 | Thunder FZE | Peninsular & Oriental Steam | 6.9 | 5.7 | Completed |
| 8 | Oger Telecom Ltd | Turk Telekomunikasyon AS | 6.6 | 5.5 | Completed |
| 9 | HH Sheikh Mansour Bin Zayed Al | Barclays PLC | 5.7 | 4.5 | Completed |
| 10 | Emirates Telecommun Grp Co | Itissalat Al Maghrib SA | 5.7 | 4.2 | Completed |
| 11 | Investor Group | Shandong Dongming Petrochem | 5 | 4.6 | Pending |
| 12 | IPIC | CEPSA | 5 | 3.7 | Completed |
| 13 | IPIC | CEPSA | 4.4 | 3.3 | Completed |
| 14 | TAQA | PrimeWest Energy Trust | 4 | 2.8 | Completed |
| 15 | Advanced Tech Invest Co LLC | Chartered Semiconductor Mnfg | 3.9 | 2.7 | Completed |
| 16 | Qtel | Wataniya | 3.8 | 2.9 | Completed |
| 17 | Emirates Bank Intl PJSC | National Bank of Dubai Ltd | 3.7 | 2.7 | Completed |
| 18 | Public Investment Fund | Uber Technologies Inc | 3.5 | 2.2 | Completed |
| 19 | Qatar Holding LLC | Barclays PLC | 3.5 | 2.2 | Completed |
| 20 | DIFC | OMX AB | 3.4 | 2.4 | Completed |
| 21 | Qatar Holding LLC | Barclays PLC | 3.3 | 2.5 | Pending |
| 22 | Henley Holding Co | Exeter Ppty Grp LLC-Industrial | 3.2 | 2.9 | Completed |
| 23 | QNB | Finansbank AS | 3.1 | 2.7 | Completed |
| 24 | Saudi Telecom Co SJSC | Binariang GSM Sdn Bhd | 3 | 2.3 | Completed |
| 25 | Qatari Diar Real Estate Invest | Cegelec SA | 3 | 1.9 | Completed |
Largest M&A Transactions Middle East & North Africa (MENA)
| Rank | Year | Acquirer | Target | Value (in bil. USD) | Value (in bil. EUR) | Deal Status |
| 1 | 2015 | Teva Pharmaceutical Industries | Allergan PLC-Generic Drug Bus | 38.75 | 34.93 | Completed |
| 2 | 2017 | Cyclops Holdings Inc | Mobileye NV | 15.39 | 14.4 | Pending |
| 3 | 2007 | Lafarge SA | OCI Cement Group | 15 | 10.2 | Completed |
| 4 | 2016 | National Bank of Abu Dhabi | First Gulf Bank PJSC | 14.84 | 13.32 | Completed |
| 5 | 2007 | SABIC | GE Plastics | 11.6 | 8.9 | Completed |
| 6 | 2009 | Qatar Investment Authority | Volkswagen AG | 9.6 | 6.7 | Completed |
| 7 | 2015 | Al Noor Hospitals Group PLC | Mediclinic International Ltd | 9.3 | 8.2 | Completed |
| 8 | 2008 | Teva Pharmaceutical Industries | Barr Pharmaceuticals Inc | 8.8 | 5.6 | Completed |
| 9 | 2011 | EMAL | DUBAL | 7.5 | 5.7 | Completed |
| 10 | 2007 | Abu Dhabi Investment Authority | Citigroup Inc | 7.5 | 5 | Completed |
| 11 | 2005 | Teva Pharmaceutical Industries | IVAX Corp | 7.4 | 6.1 | Completed |
| 12 | 2005 | Thunder FZE | Peninsular & Oriental Steam | 6.9 | 5.7 | Completed |
| 13 | 2005 | Oger Telecom Ltd | Turk Telekomunikasyon AS | 6.6 | 5.5 | Completed |
| 14 | 2011 | Teva Pharmaceutical Industries | Cephalon Inc | 6.3 | 4.5 | Completed |
| 15 | 2008 | HH Sheikh Mansour Bin Zayed Al | Barclays PLC | 5.7 | 4.5 | Completed |
| 16 | 2013 | Emirates Telecommun Grp Co | Itissalat Al Maghrib SA | 5.7 | 4.2 | Completed |
| 17 | 2016 | Chongqing New Century Cruise | Alpha Frontier Ltd | 5.2 | 5.1 | Pending |
| 18 | 2006 | MTN Group Ltd | Investcom LLC | 5.5 | 4.4 | Completed |
| 19 | 2015 | Investor Group | Shandong Dongming Petrochem | 5 | 4.6 | Pending |
| 20 | 2011 | IPIC | CEPSA | 5 | 3.7 | Completed |
Largest M&A Transactions South America
| Date Announced | Acquiror Name | Rank | Year | Acquirer Name | Target Name | Value of Transaction (in bil. USD) | Value of Transaction (in bil. EUR) |
| 01/10/2000 | America Online Inc | 1 | 2000 | America Online Inc | Time Warner | 164.7 | 160.7 |
| 09/02/2013 | Verizon Communications Inc | 2 | 2013 | Verizon Communications Inc | Verizon Wireless Inc | 130.3 | 100.5 |
| 11/04/1999 | Pfizer Inc | 3 | 1999 | Pfizer Inc | Warner-Lambert Co | 89.6 | 85.3 |
| 12/14/2017 | Walt Disney Co | 4 | 2017 | Walt Disney Co | 21st Century Fox Inc | 84.2 | 72.5 |
| 10/22/2016 | AT&T Inc | 5 | 2016 | AT&T Inc | Time Warner Inc | 79.4 | 72.9 |
| 01/03/2019 | Bristol-Myers Squibb Co | 6 | 2019 | Bristol-Myers Squibb Co | Celgene Corp | 79.4 | 69.7 |
| 12/01/1998 | Exxon Corp | 7 | 1998 | Exxon Corp | Mobil Corp | 78.9 | 68.4 |
| 03/05/2006 | AT&T Inc | 8 | 2006 | AT&T Inc | BellSouth Corp | 72.7 | 60.2 |
| 04/06/1998 | Travelers Group Inc | 9 | 1998 | Travelers Group Inc | Citicorp | 72.6 | 67.2 |
| 07/08/2001 | Comcast Corp | 10 | 2001 | Comcast Corp | AT&T Broadband & Internet Svcs | 72.0 | 85.1 |
M&A Mega Deals Down in 2020
In the first few weeks of 2020, megal deals (transactions above 1 bil. or 5 bil. USD) are down to their levels of 2009/2010. Please download data below, if you like.
Login or Become a Member or Free User to download Number and Value not only in USD but also in EUR, GBP, and YEN as a Spreadsheet
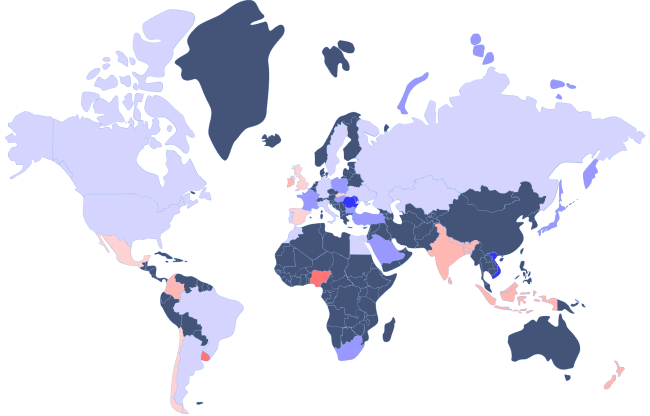
M&A Heat Maps
The Institute for Mergers, Acquisitions and Alliances (IMAA) publishes regularly Heat Maps. The most current heat maps have been published on January 09, 2019. In order to download a copy of the latest repornt, the detailed ranking, and graphs, please login with your account (if you have no account yet, you can register for free).
Unless otherwise stated source for all statistics is: Thomson Financial, Institute for Mergers, Acquisitions and Alliances (IMAA) analysis.
Research Request Assistance
For additional information, IMAA’s Research team is ready to assist you. Kindly complete the form below, and we will respond promptly with a proposal detailing the timeline and associated costs. If you are an IMAA Charterholder, you are welcome to utilize your research credits for this service.