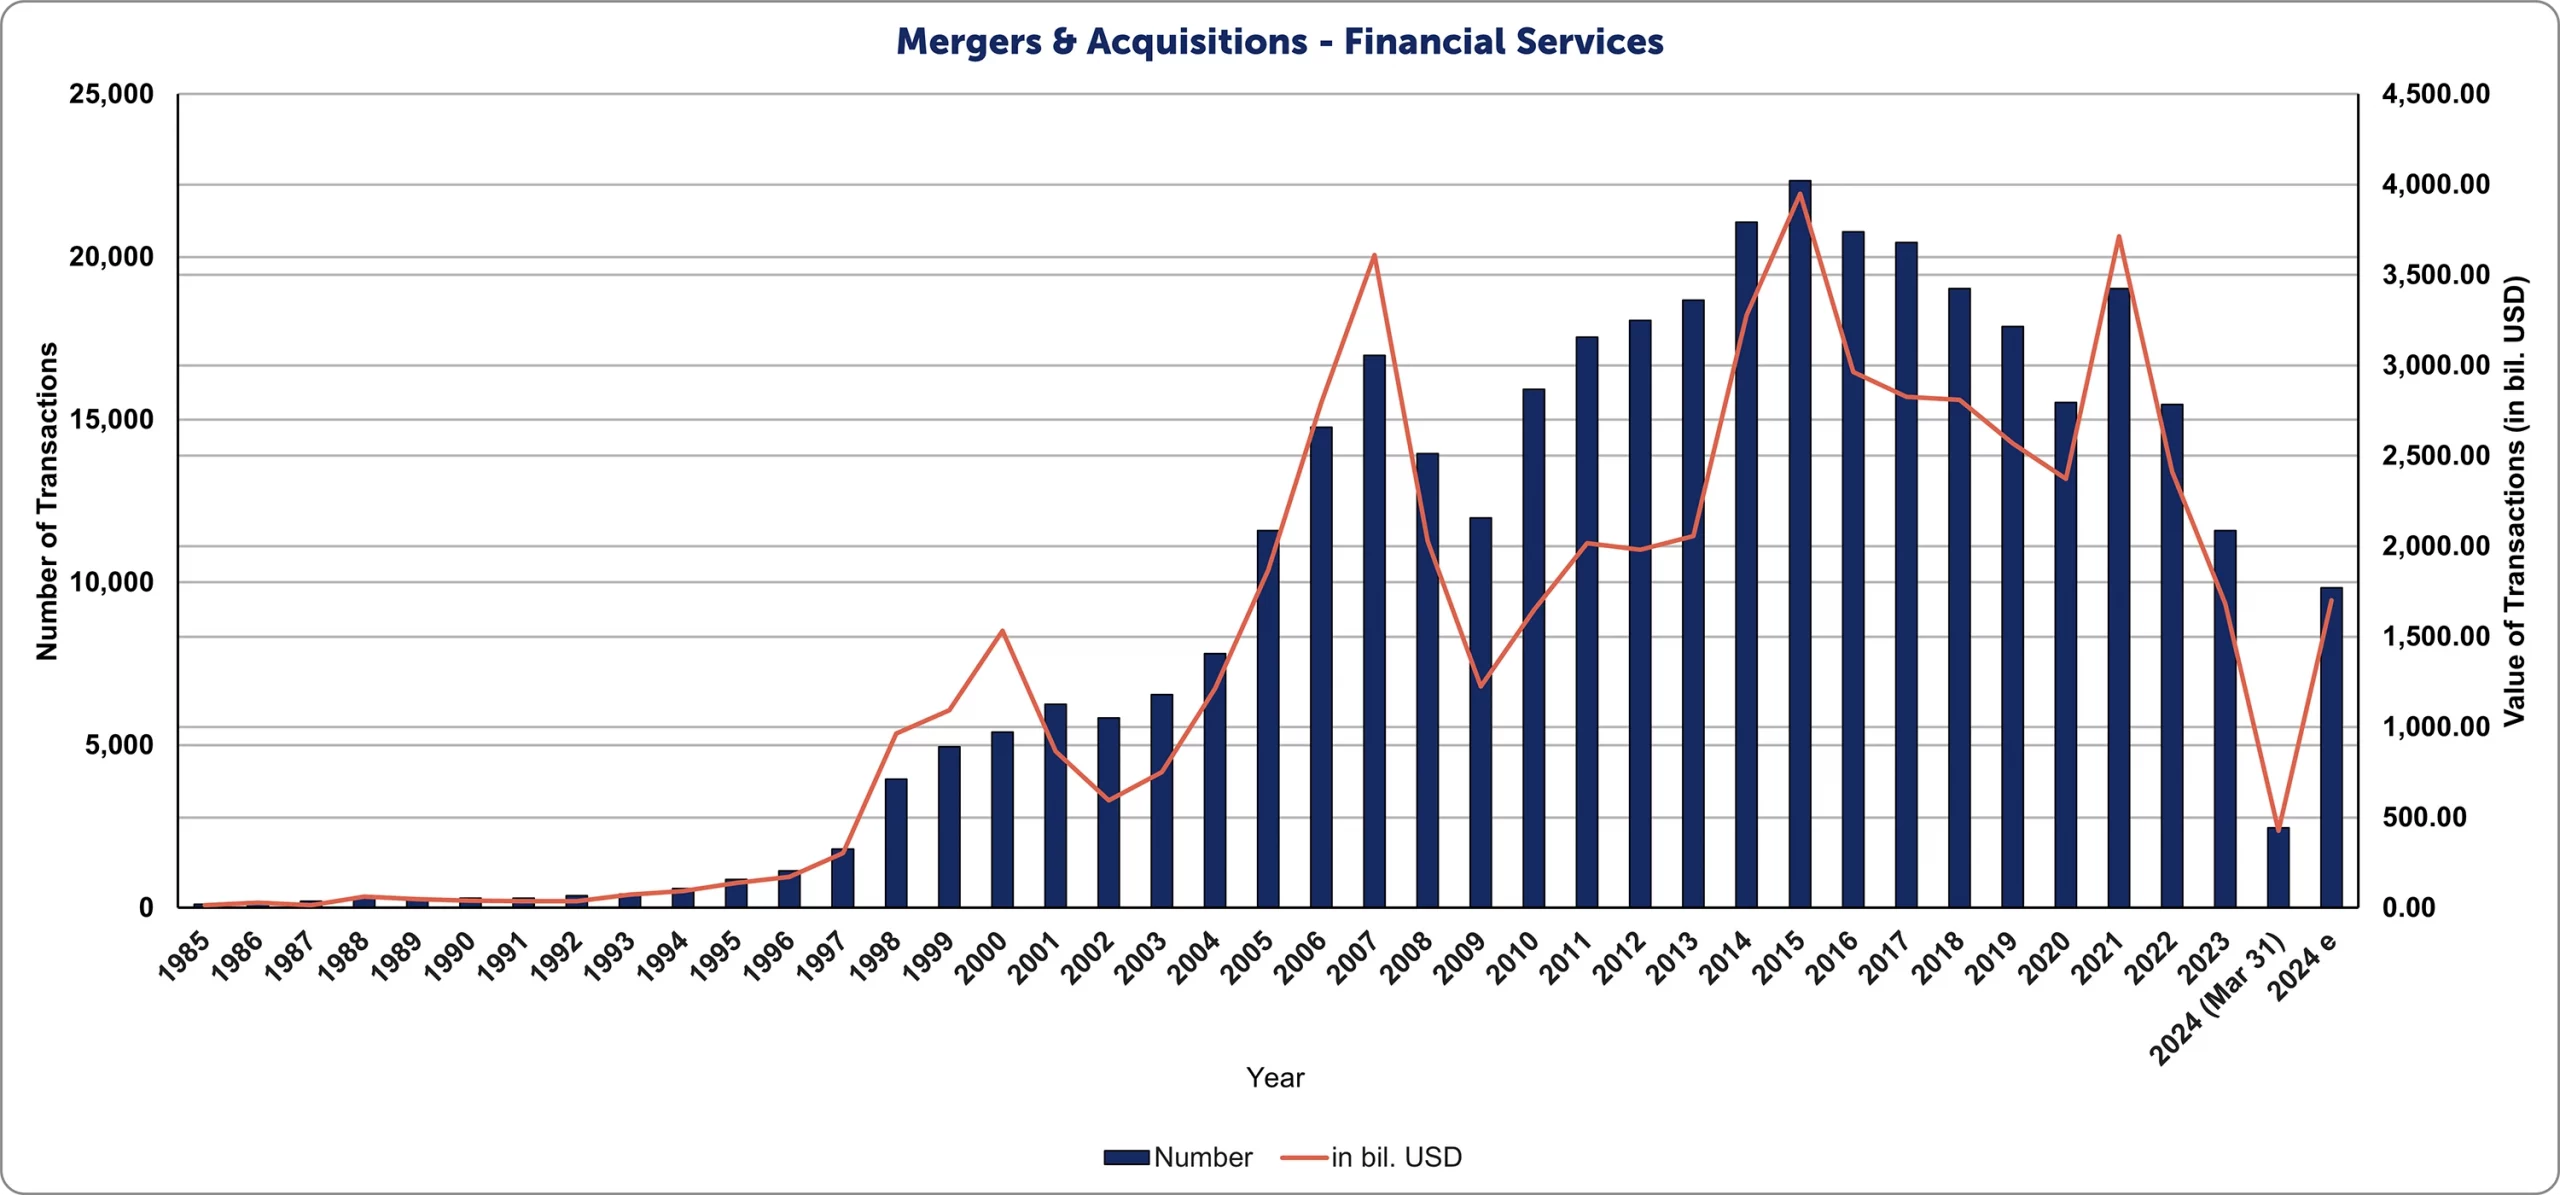
The flurry of M&A activities has been constant throughout the last decades in the Financial Services sector. From 1985 to Q1 2024, more than 372 thousand deals have been announced with a total value of over USD 56 trillion. The M&A activity reflects the industry’s growth and constant adaptation to shifting economic cycles.
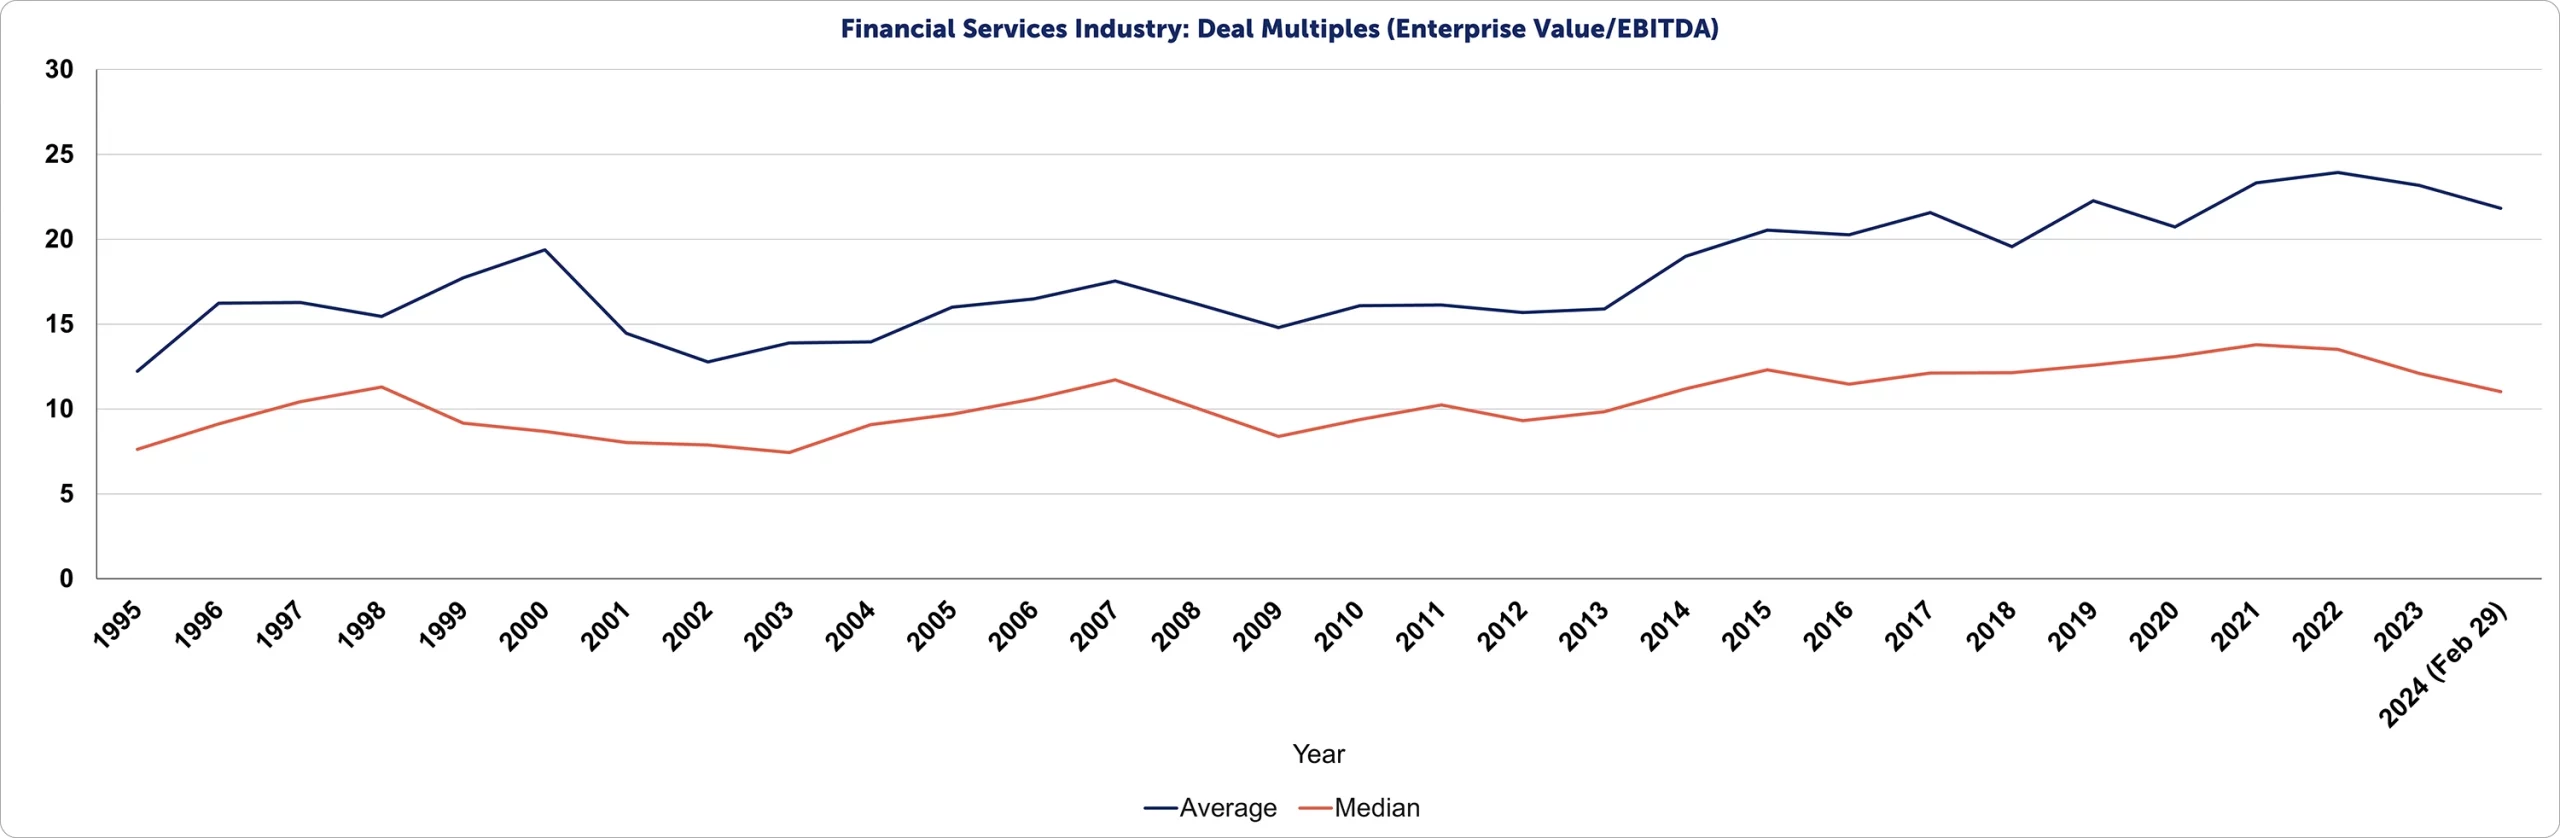
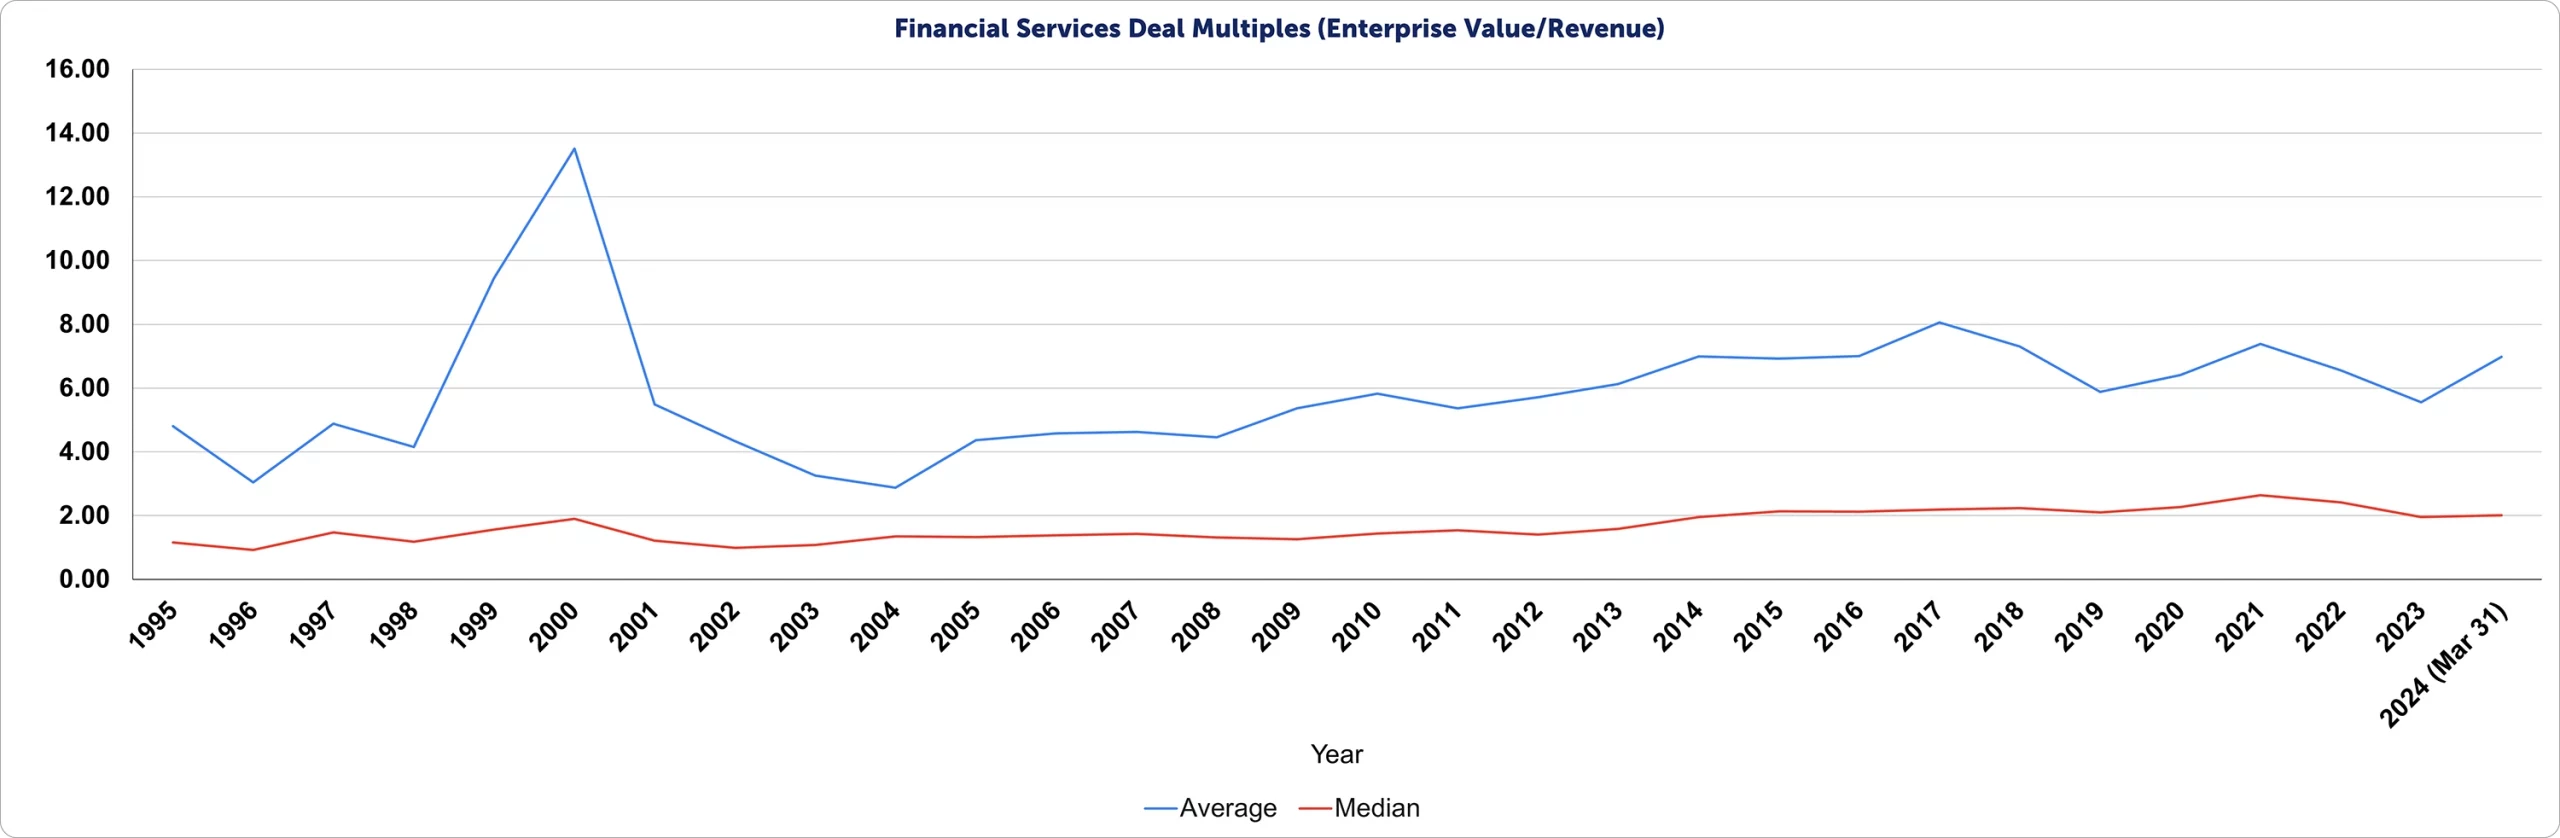
This extensive dataset, researched by the Institute for Mergers, Acquisitions, and Alliances (IMAA), tracks M&A activities within the Financial Services Industry. It covers trends in transaction volume and value and critical financial metrics such as Enterprise Value to EBITDA and Enterprise Value to Revenue. Such detailed analysis reflects the industry’s evolution over nearly four decades.
Historical M&A data in the financial services industry is valuable for analysts, investors, and policymakers. It provides deep insights into market trends, which can help make strategic decisions on market timing. This information is crucial in crafting informed investment and operational strategies for navigating market dynamics.
At a Glance: M&A Activity in the Financial Services Industry from 2021 – 2023
2021 M&A Activity
Overall Transactions
Overall Value
19,030 Deals
USD 3.7 Trillion
The lively deal activities in financial services resumed in 2021 following a slump during the start of the pandemic. A total of 19,030 deals were announced, coming from 15,522 in 2020. The year also saw larger deals announced, with the total value reaching USD 3.7 trillion, more than USD 1.4 trillion higher than in 2020.
2022 M&A Activity
Overall Transactions
Overall Value
15,473 Deals
USD 2.4 Trillion
M&A activities in the financial services sector slowed down again in 2022, with an almost 19% drop in the volume of deals. The deal size decreased, resulting in a total transaction value decline of 35% in 2022.
2023 M&A Activity
Overall Transactions
Overall Value
11,598 Deals
USD 1.7 Trillion
As banks and financial institutions continued their transformation and reacted to economic conditions in 2023, M&A activities in the sector continued their downtrend, with deal volumes declining by 25% and value down by as much as 30%.
January to March 2024 M&A Activity
Overall Transactions
Overall Value
2,460
USD 425 Billion
In the first quarter of 2024, a total of 2,460 deals were announced in the Financial Services sector, lower by 22% vs same period last year. The value of Q1 deals is slightly up at 1%.
Download the IMAA Dataset on M&A Activity in the Financial Services Industry.
IMAA’s dataset on M&A activity within the Financial Services Industry tells the story of the sector’s evolution and transformation over time. Investors, analysts, and entrepreneurs can use this information to make informed strategic recommendations and decisions. Policymakers can also leverage this data to identify gaps or opportunities that could be addressed through new policies. The data provides historical trends and financial evaluations, which aid in making informed decisions, contributing to the sector’s continuous growth and transformation.
This website uses cookies to improve your experience while you navigate through the website. Out of these, the cookies that are categorized as necessary are stored on your browser as they are essential for the working of basic functionalities of the website. We also use third-party cookies that help us analyze and understand how you use this website. These cookies will be stored in your browser only with your consent. You also have the option to opt-out of these cookies. But opting out of some of these cookies may affect your browsing experience.
Necessary cookies are absolutely essential for the website to function properly. These cookies ensure basic functionalities and security features of the website, anonymously.
Cookie
Duration
Description
cookielawinfo-checkbox-analytics
11 months
This cookie is set by GDPR Cookie Consent plugin. The cookie is used to store the user consent for the cookies in the category "Analytics".
cookielawinfo-checkbox-functional
11 months
The cookie is set by GDPR cookie consent to record the user consent for the cookies in the category "Functional".
cookielawinfo-checkbox-necessary
11 months
This cookie is set by GDPR Cookie Consent plugin. The cookies is used to store the user consent for the cookies in the category "Necessary".
cookielawinfo-checkbox-others
11 months
This cookie is set by GDPR Cookie Consent plugin. The cookie is used to store the user consent for the cookies in the category "Other.
cookielawinfo-checkbox-performance
11 months
This cookie is set by GDPR Cookie Consent plugin. The cookie is used to store the user consent for the cookies in the category "Performance".
viewed_cookie_policy
11 months
The cookie is set by the GDPR Cookie Consent plugin and is used to store whether or not user has consented to the use of cookies. It does not store any personal data.
Functional cookies help to perform certain functionalities like sharing the content of the website on social media platforms, collect feedbacks, and other third-party features.
Performance cookies are used to understand and analyze the key performance indexes of the website which helps in delivering a better user experience for the visitors.
Analytical cookies are used to understand how visitors interact with the website. These cookies help provide information on metrics the number of visitors, bounce rate, traffic source, etc.
Advertisement cookies are used to provide visitors with relevant ads and marketing campaigns. These cookies track visitors across websites and collect information to provide customized ads.