Blog Median Enterprise Value to EBITDA and Revenue Multiples
- Blog
Median Enterprise Value to EBITDA and Revenue Multiples
- Nima Noghrehkar

SHARE:
This blog is part of IMAA’s report on Thriving in Turbulence? M&A Valuations in the Age of High Interest Rates
Overview
Median Enterprise Value to EBITDA Multiples
by Industry – Overview
Median Enterprise Value to Revenue Multiples
by Industry – Overview
Industry Spotlight
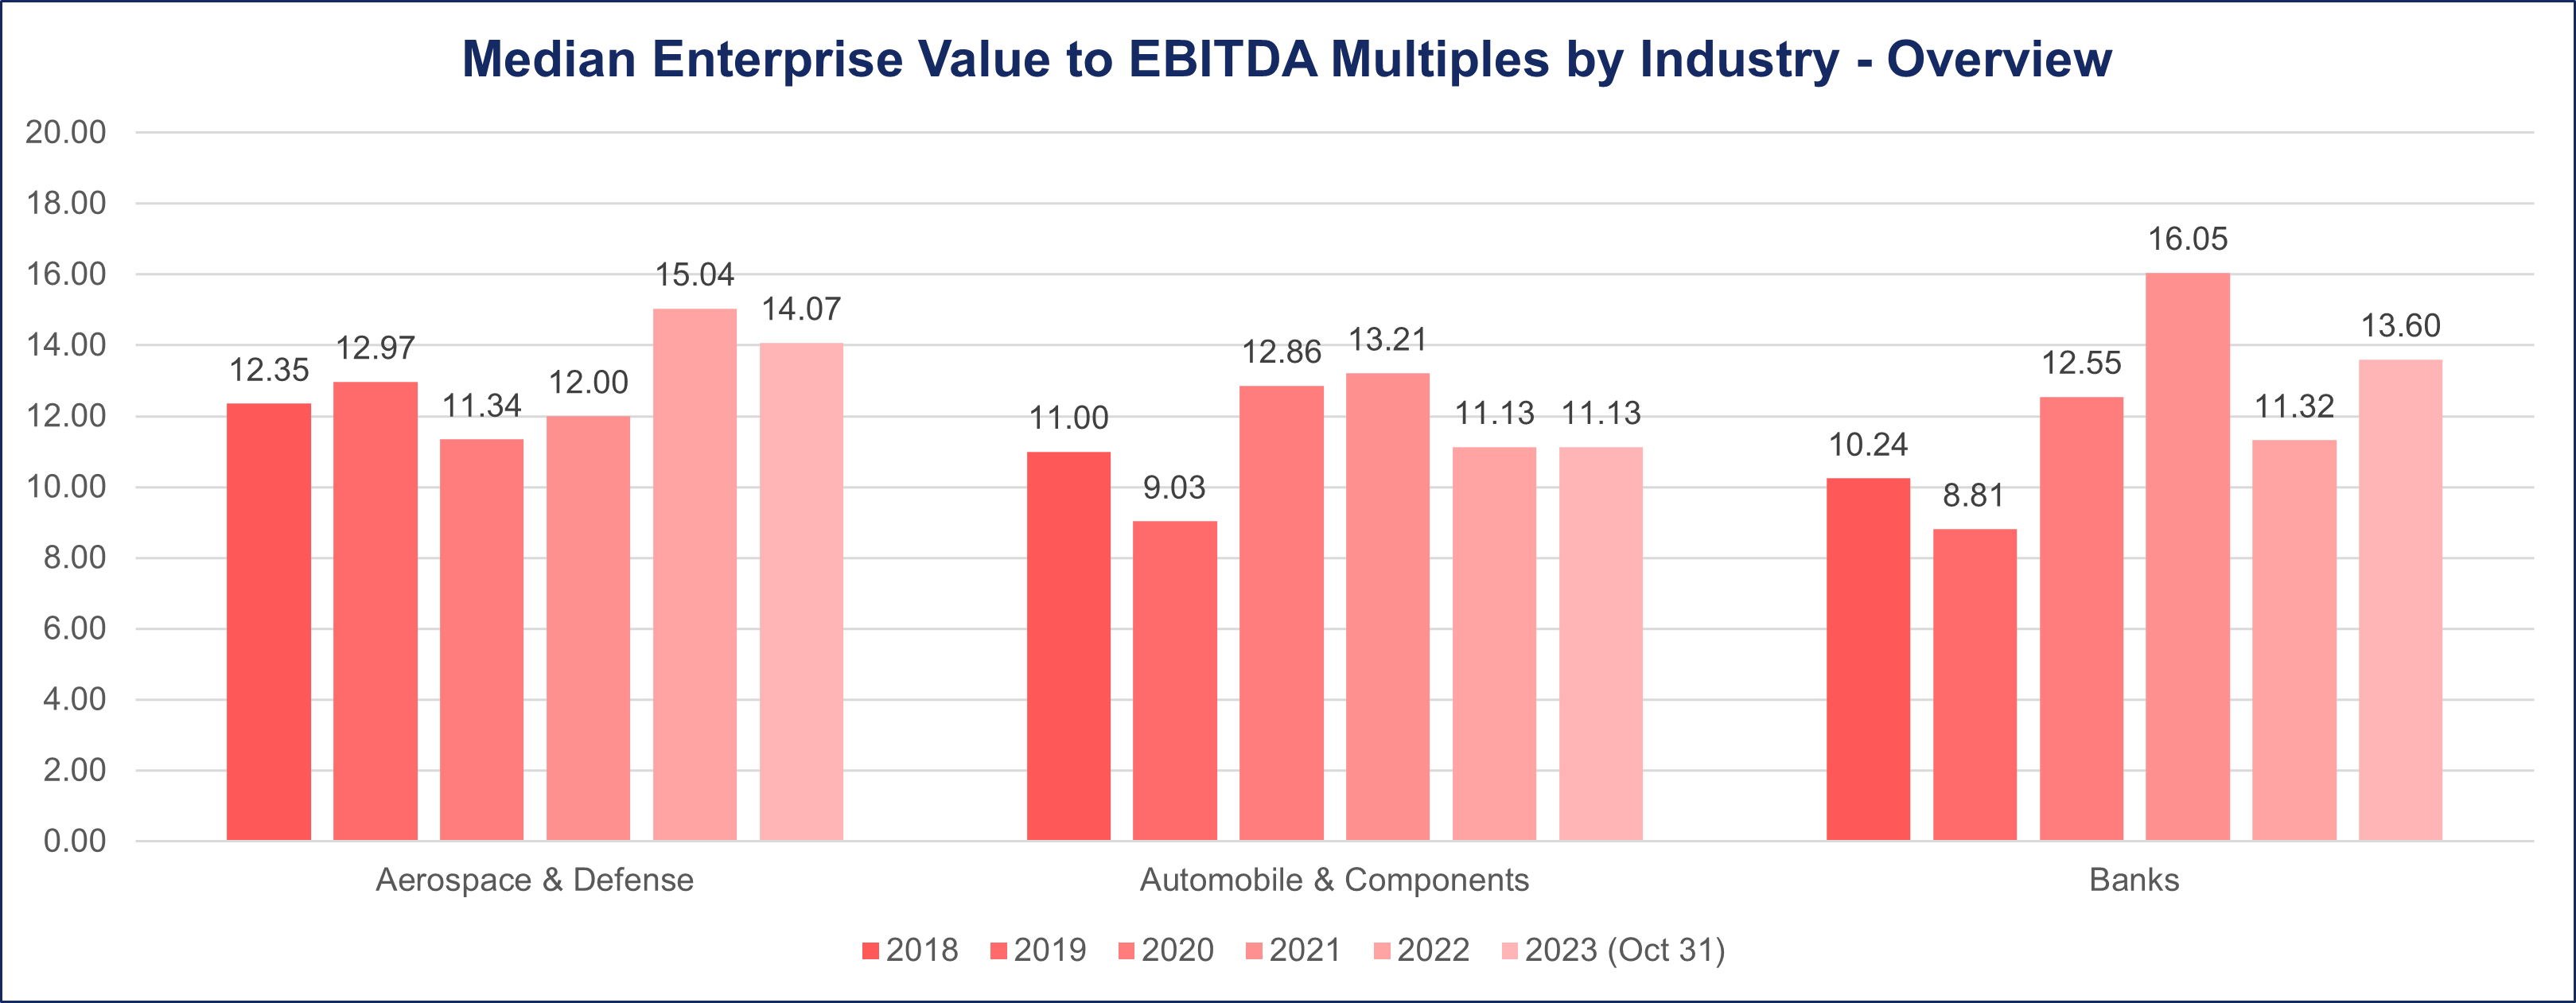
Aerospace & Defense
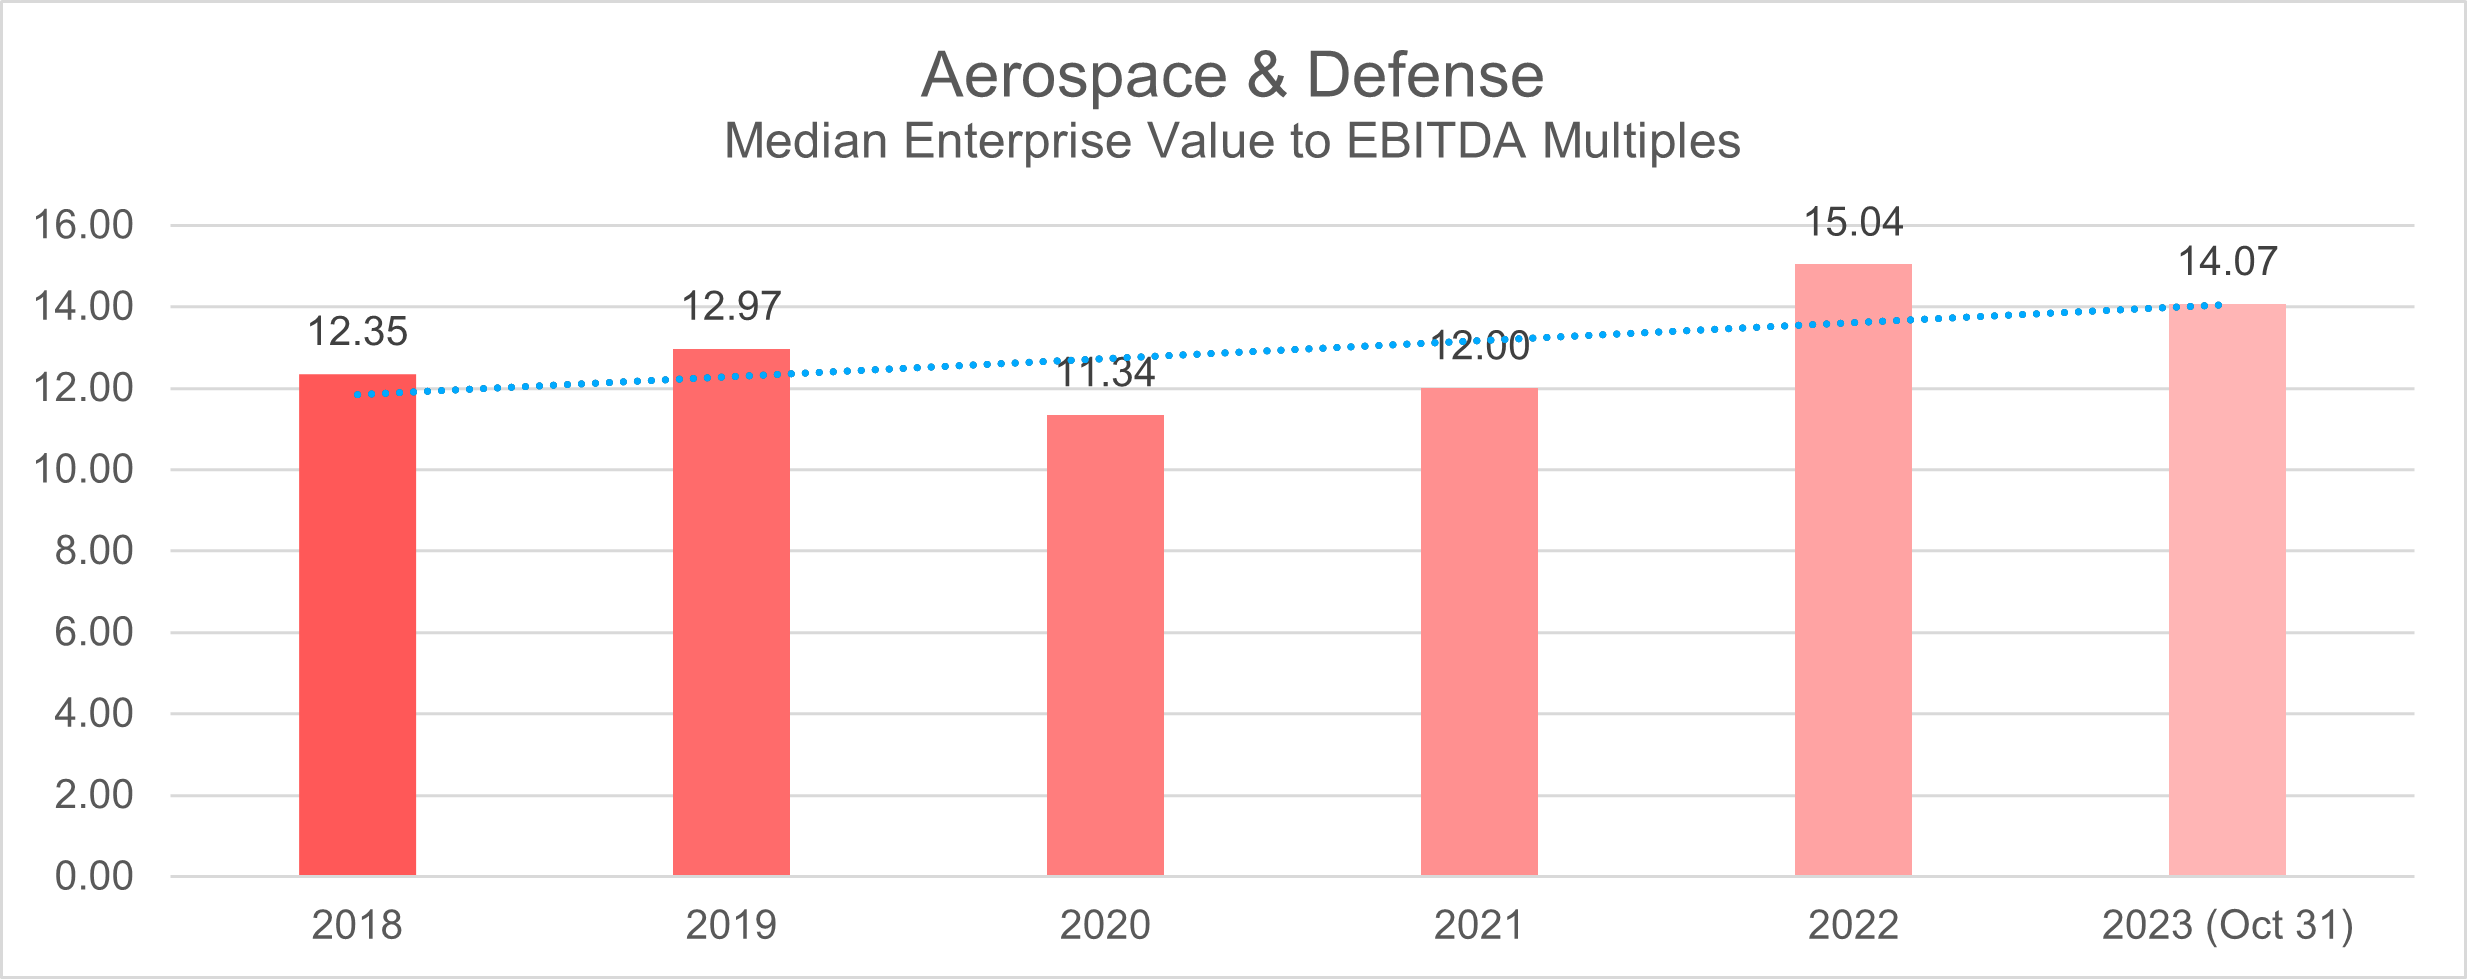
From 2018 to 2019, the Aerospace & Defense sector consistently demonstrated a steady median deal multiple of 12 to 13 using the EV/EBITDA metric.
However, the industry experienced a decline in multiples amidst the challenges posed by the pandemic from 2020 to 2021, with deal multiples plummeting to as low as 11.34. This decrease suggests a significant impact on the sector’s valuation during the pandemic period, potentially influenced by uncertainties, disruptions, and economic constraints.
Notwithstanding the setbacks encountered during the pandemic, the Aerospace & Defense sector demonstrated resilience by rebounding with an elevated median multiple of 15 in 2022. As of October 2023, the industry’s median deal multiples stand at 14.1, reflecting a sustained recovery and resilience in the market.
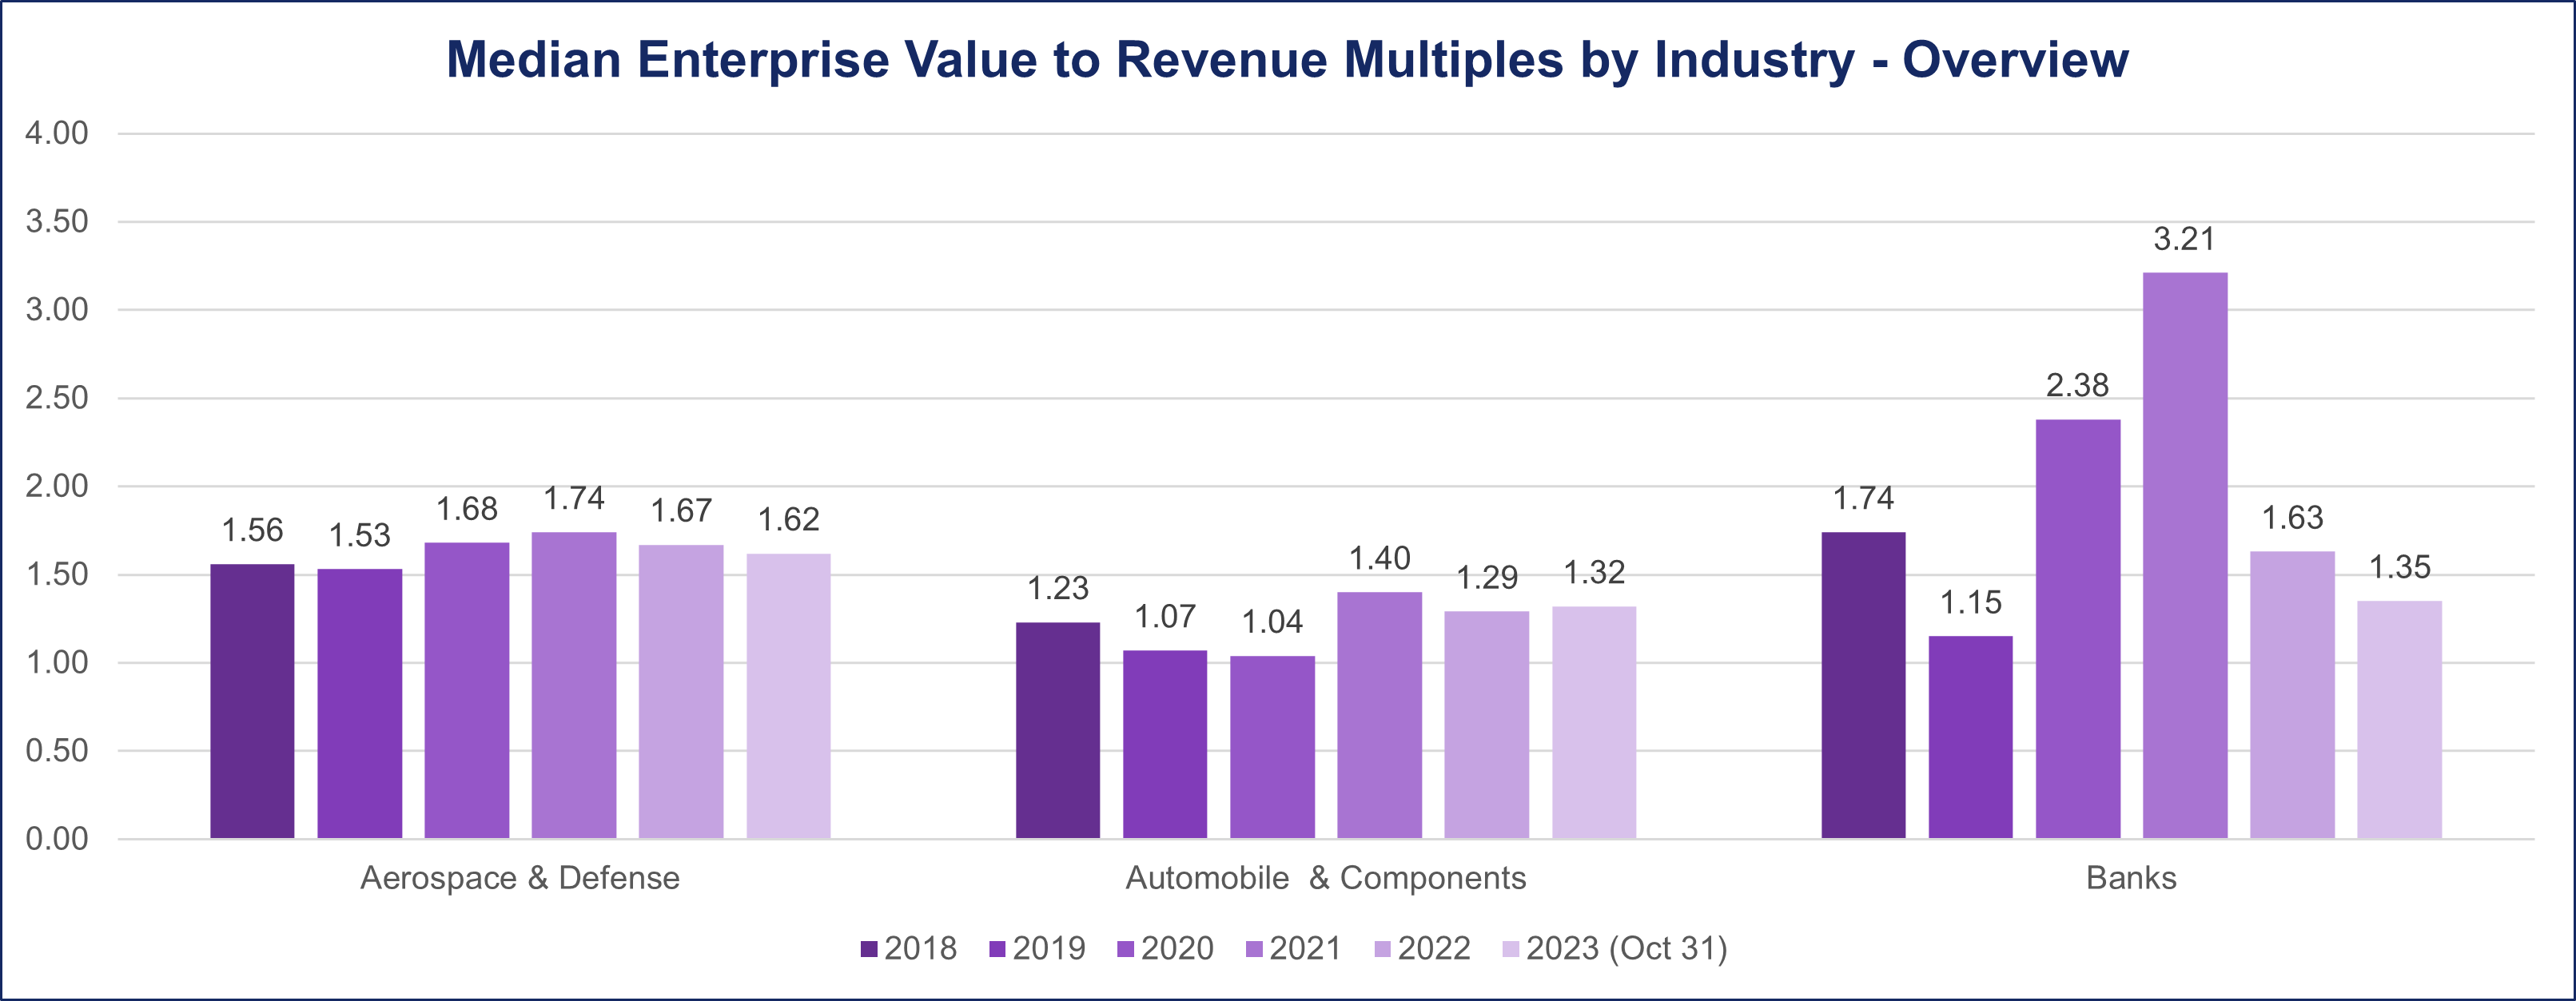
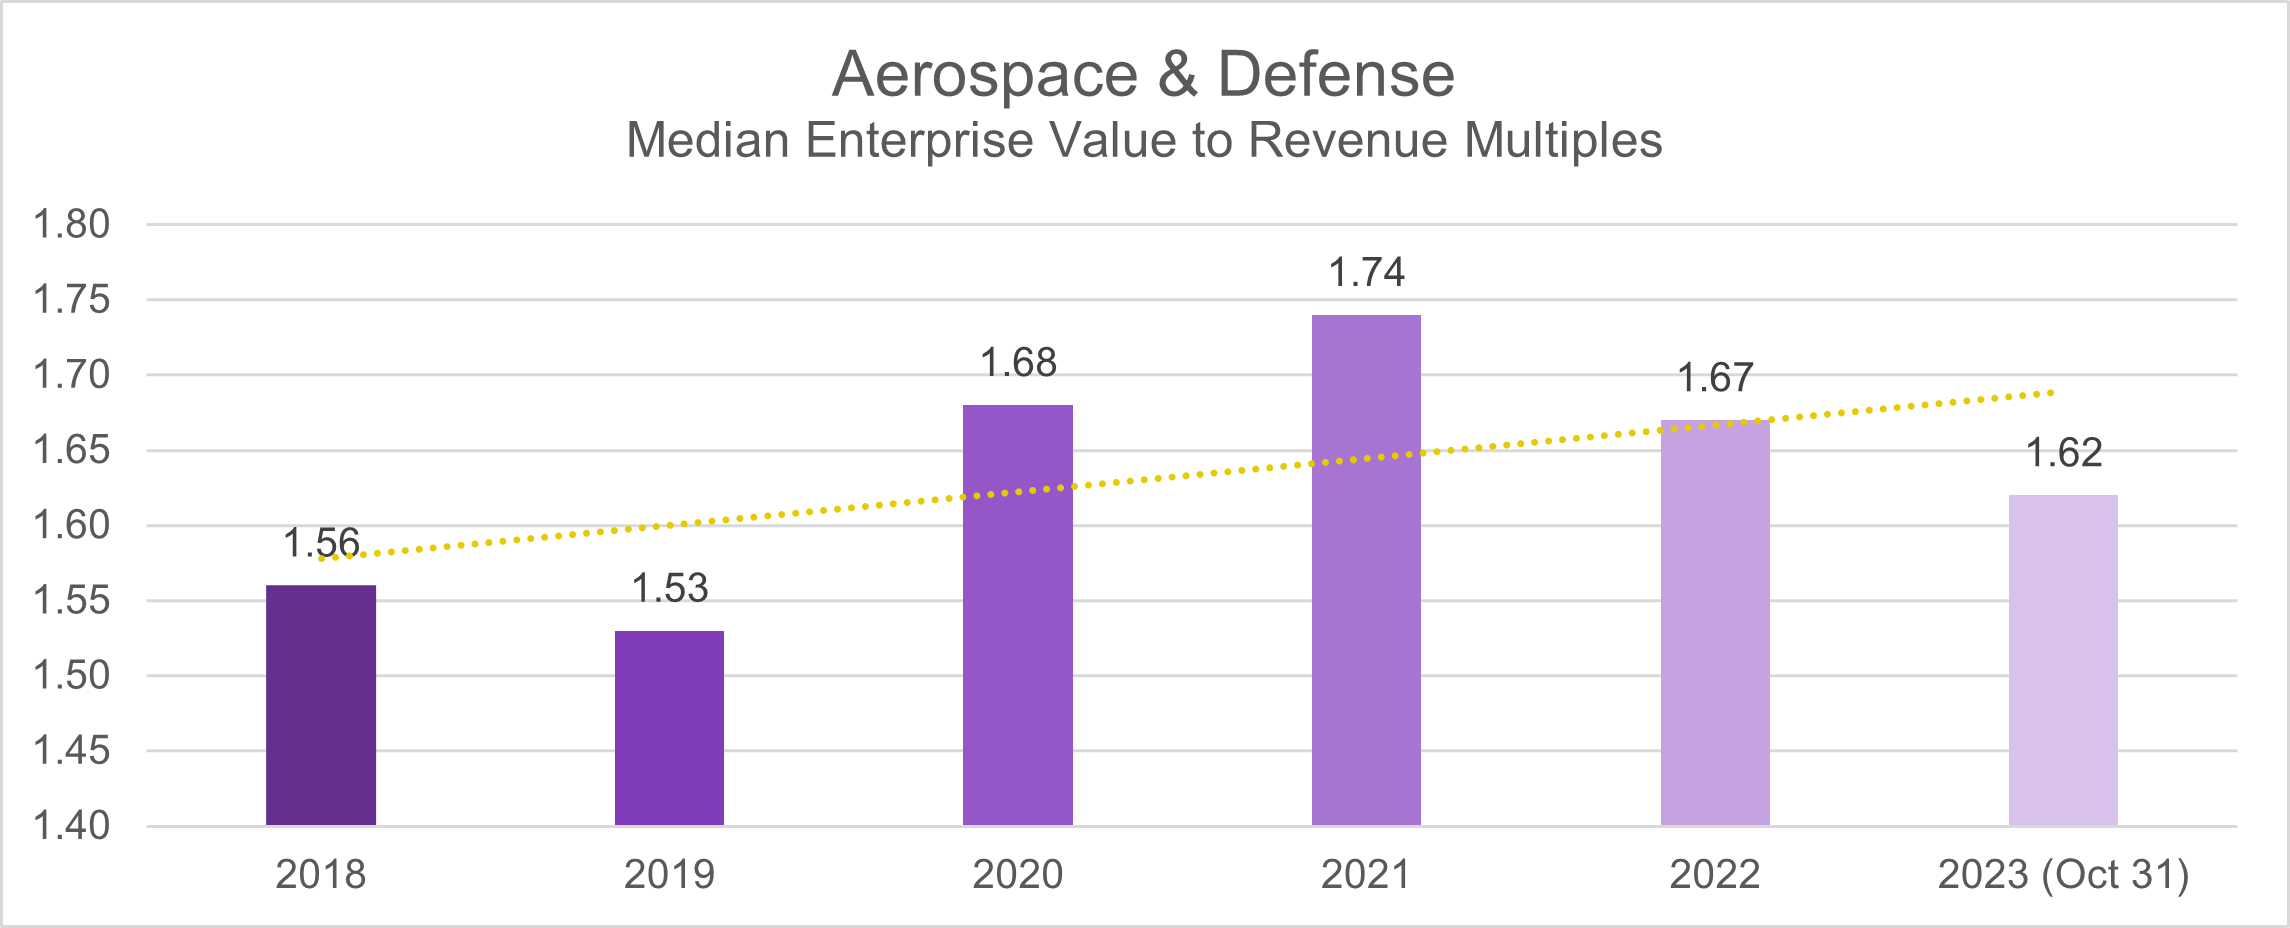
A discernible and consistent pattern emerges when analyzing the EV/Revenue metric. In the pre-pandemic phase spanning 2018-2019, the median deal multiple stands at 1.5. The pandemic era (2020-2021) witnessed a subtle shift, with the deal multiple slightly increasing to 1.7. Impressively, post-pandemic, the Aerospace & Defense industry maintains stability, demonstrating resilience as the deal multiples settle at 1.6 from 2022 to October 2023.
Automobile & Components
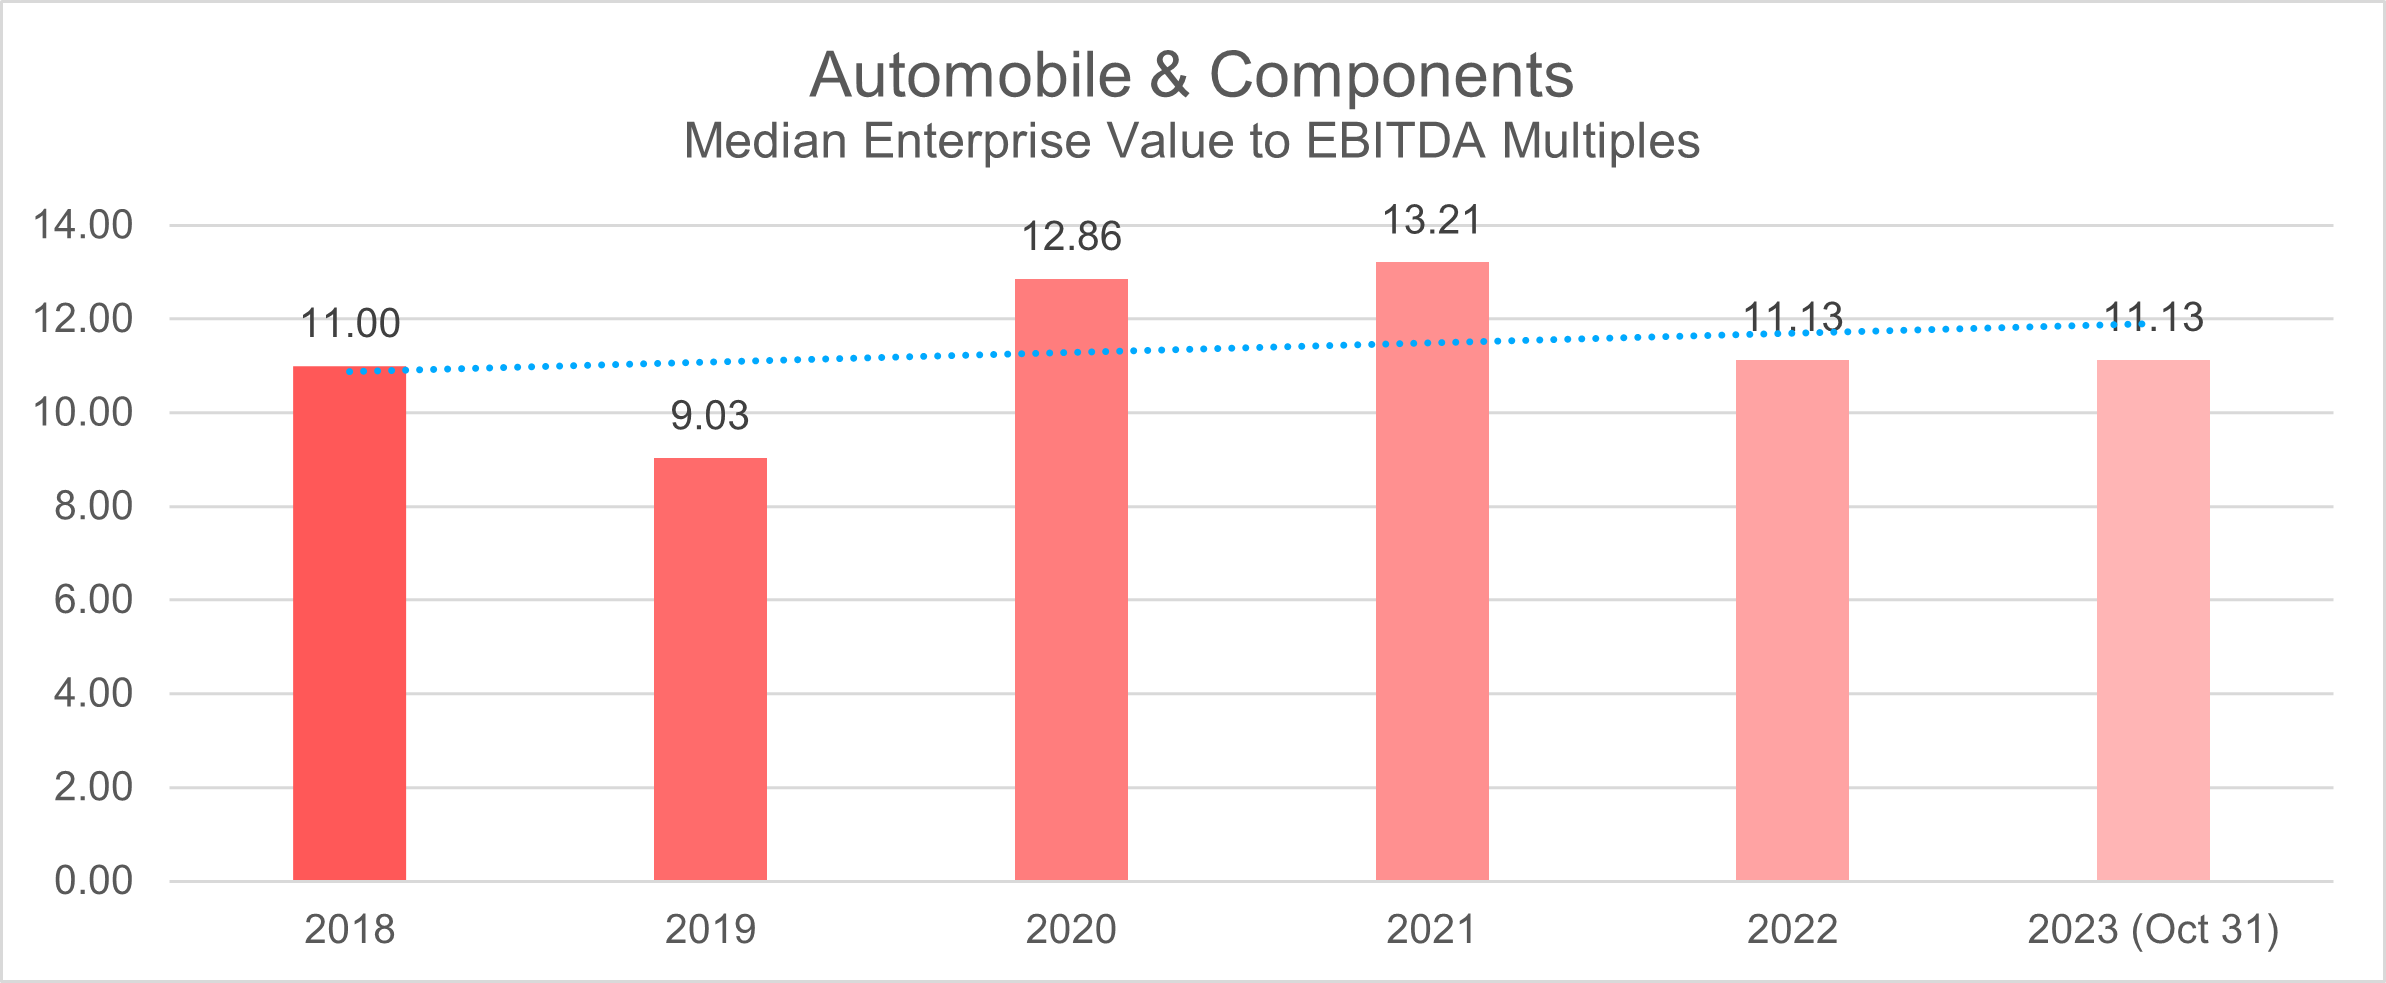
In the pre-pandemic period (2018-2019), the Automobile & Components industry reported median deal multiples of 11 and 9, respectively, when assessed using the EV/EBITDA metric.
During the pandemic (2020-2021), there was a noticeable increase in deal multiples, reaching 13, reflecting a shift in valuation dynamics within the industry.
As we transitioned into the post-pandemic landscape from 2022 to October 2023, the median multiple adjusted to 11.13, indicating a potential stabilization or realignment in the industry’s valuation landscape.
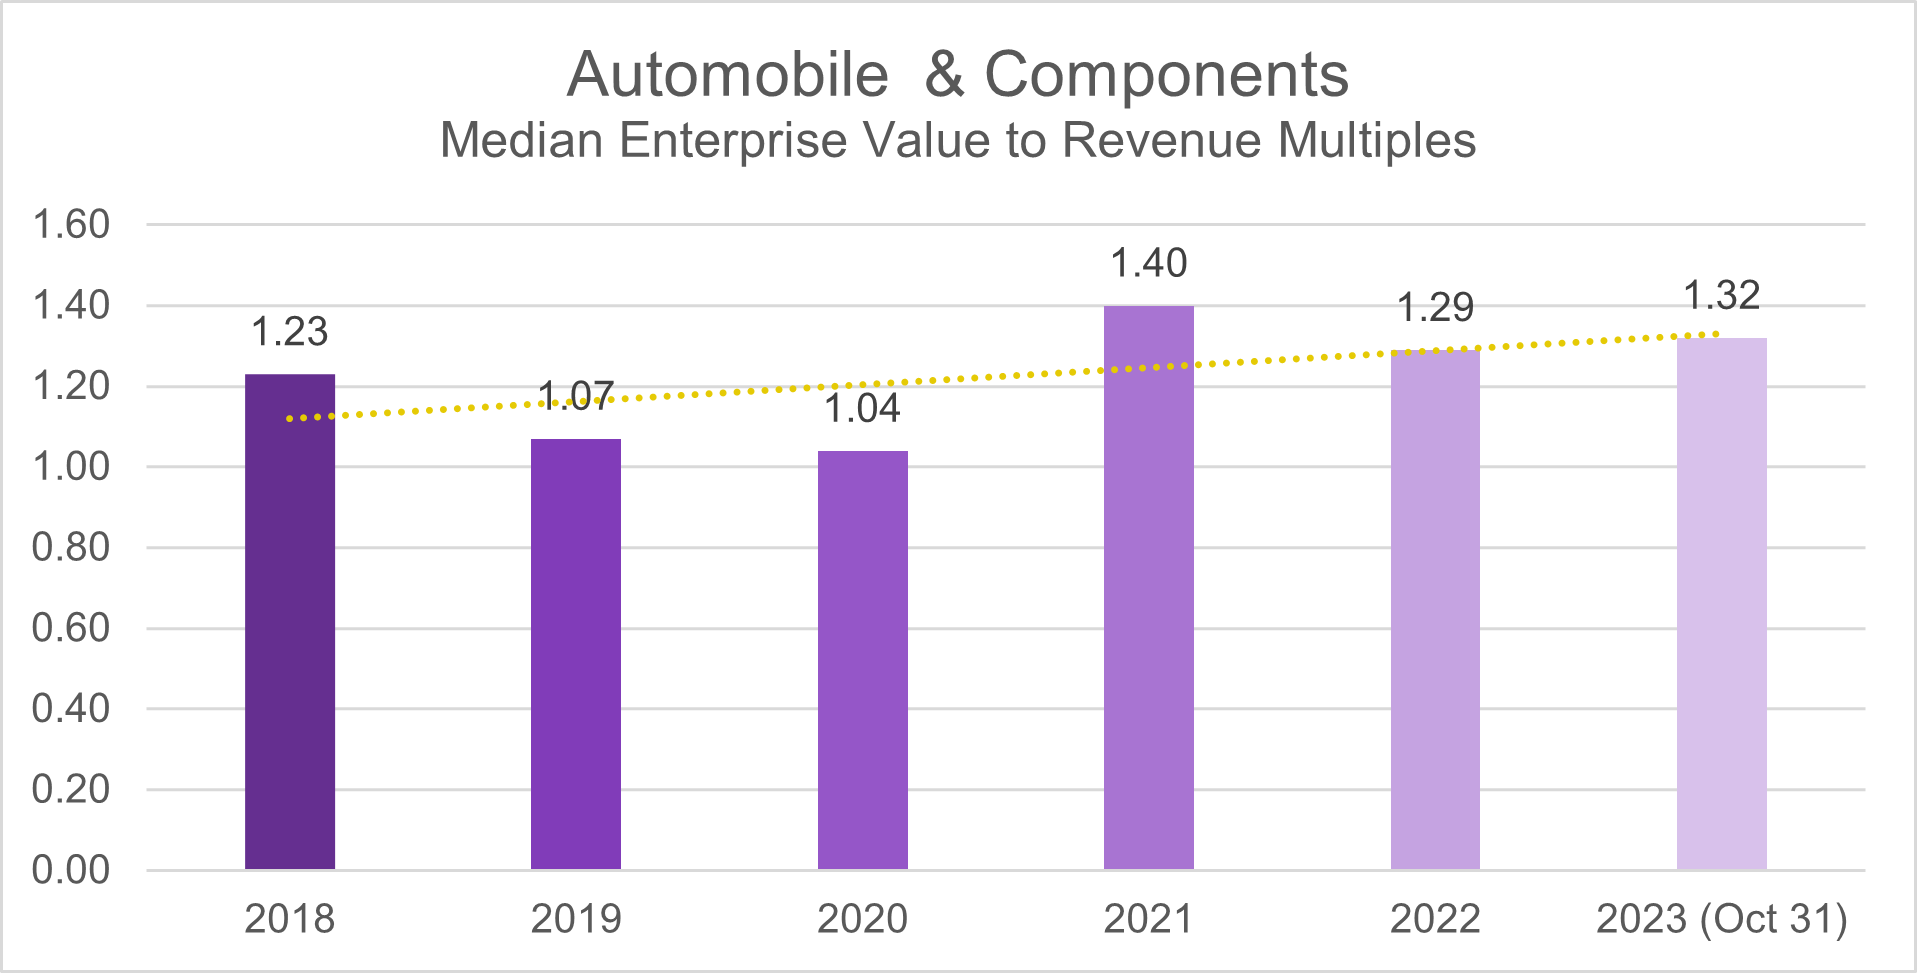
Upon examining the EV/Revenue metric, a notable pattern emerges. During 2018-2019, the median deal multiples were 1.2 and 1.1, respectively, using the EV/Revenue metric. The pandemic (2020-2021) didn’t introduce significant fluctuations, with the multiple holding steady at 1 in 2020 and then showing a slight uptick to 1.4 in 2021. Remarkably, post-pandemic, the industry’s deal multiples have maintained consistency, settling at 1.3 as of October 2023.
Banks
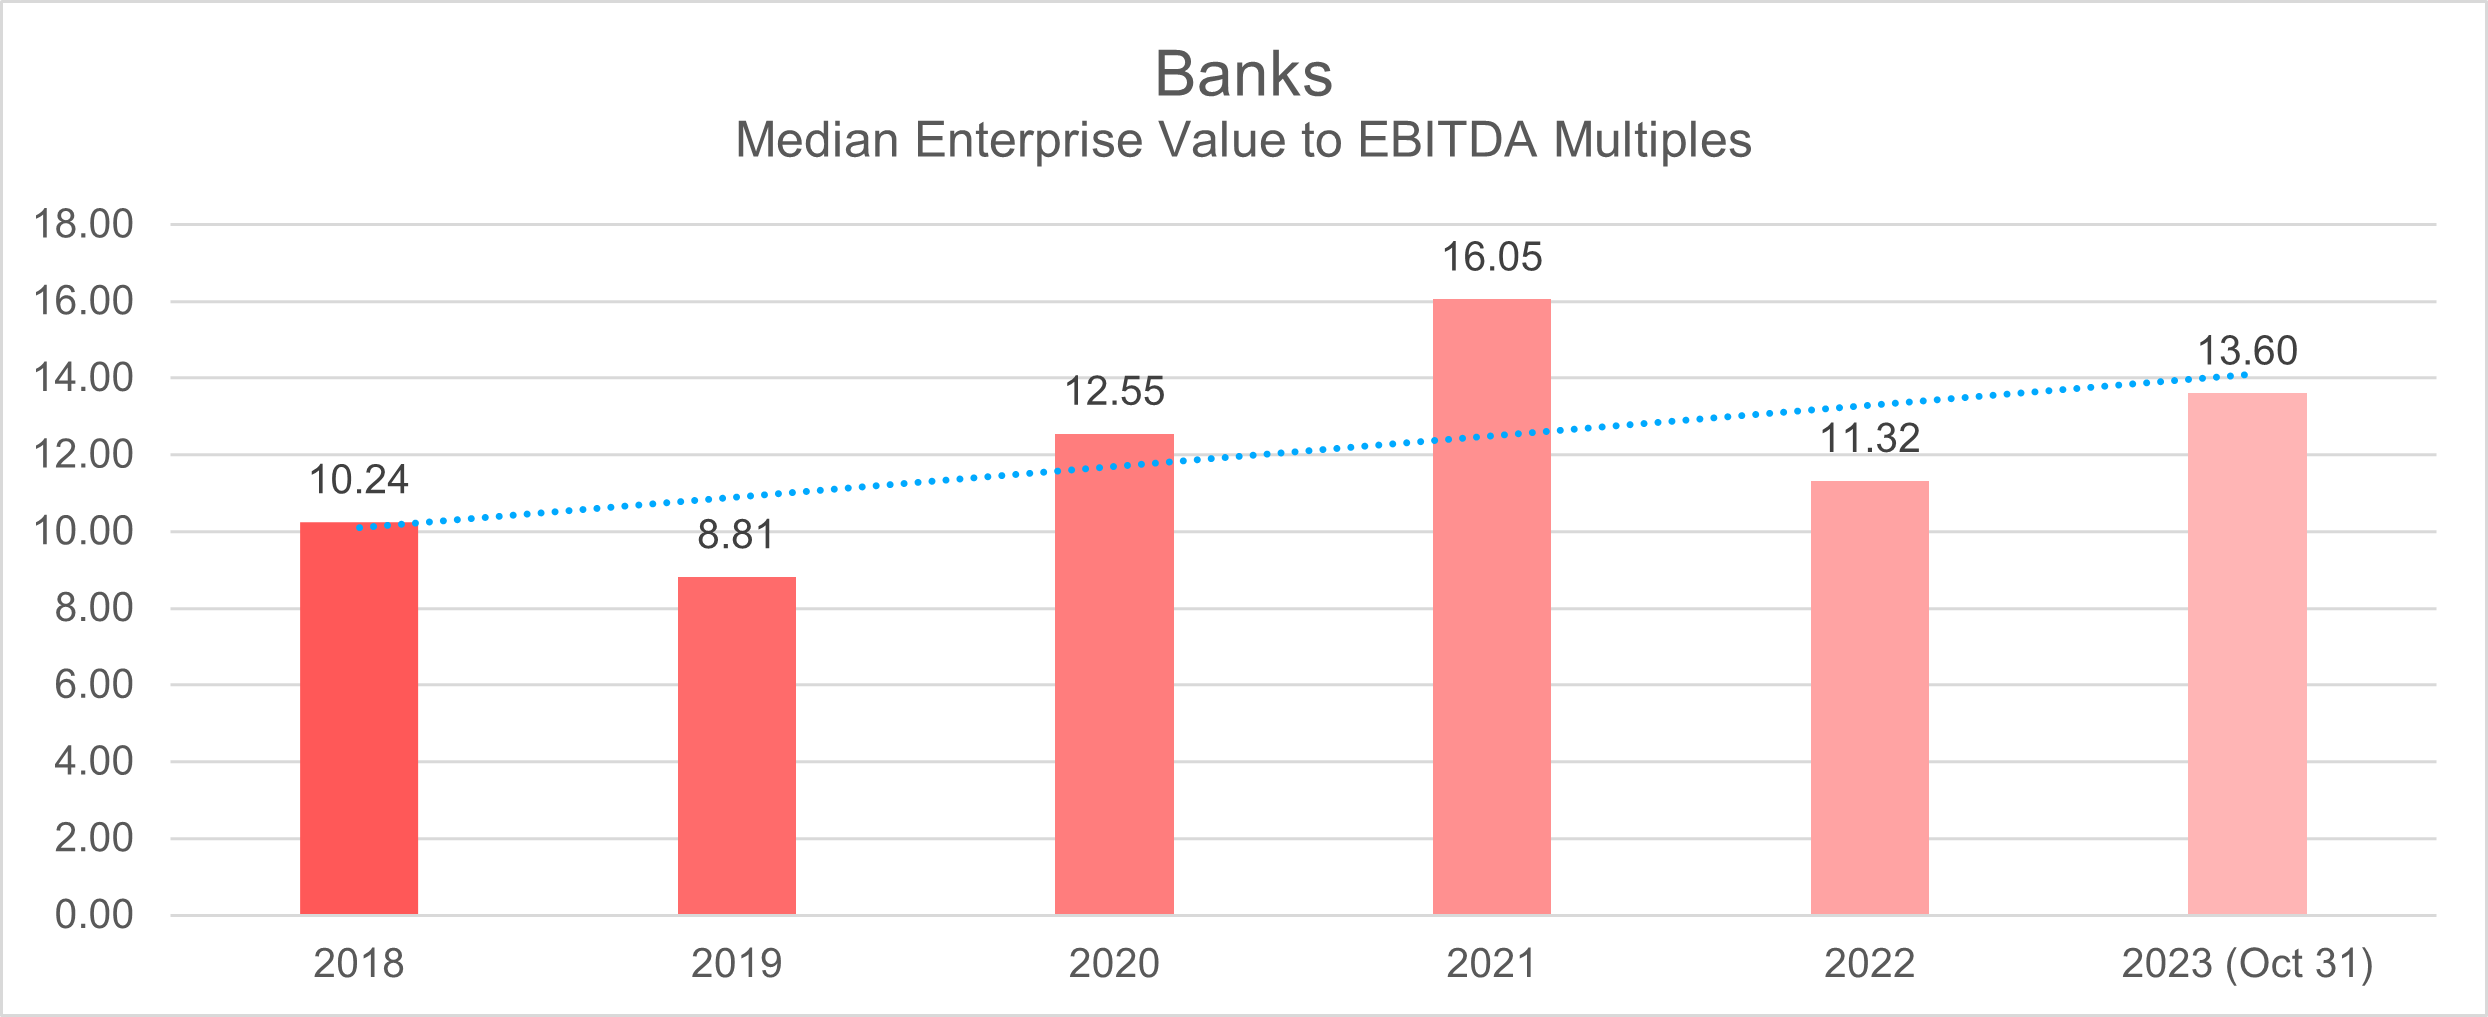
In the 2018-2019 period, the Banking sector’s median deal multiples, measured by the EV/EBITDA metric, were 10 and 8, respectively.
With the onset of the pandemic, there was a noticeable upward trend in deal multiples. In 2020, the median multiples increased to 12.5, signaling an apparent surge in valuations within the Banking sector. This trend continued into 2021, with deal multiples further rising to 16, indicating a robust market and increased investor confidence during this period.
However, following the pandemic, there was a subsequent decline in deal multiples in 2022, settling at 11.3. As of October 2023, the median deal multiples have rebounded to 13.6, suggesting a resurgence in valuations within the Banking sector.
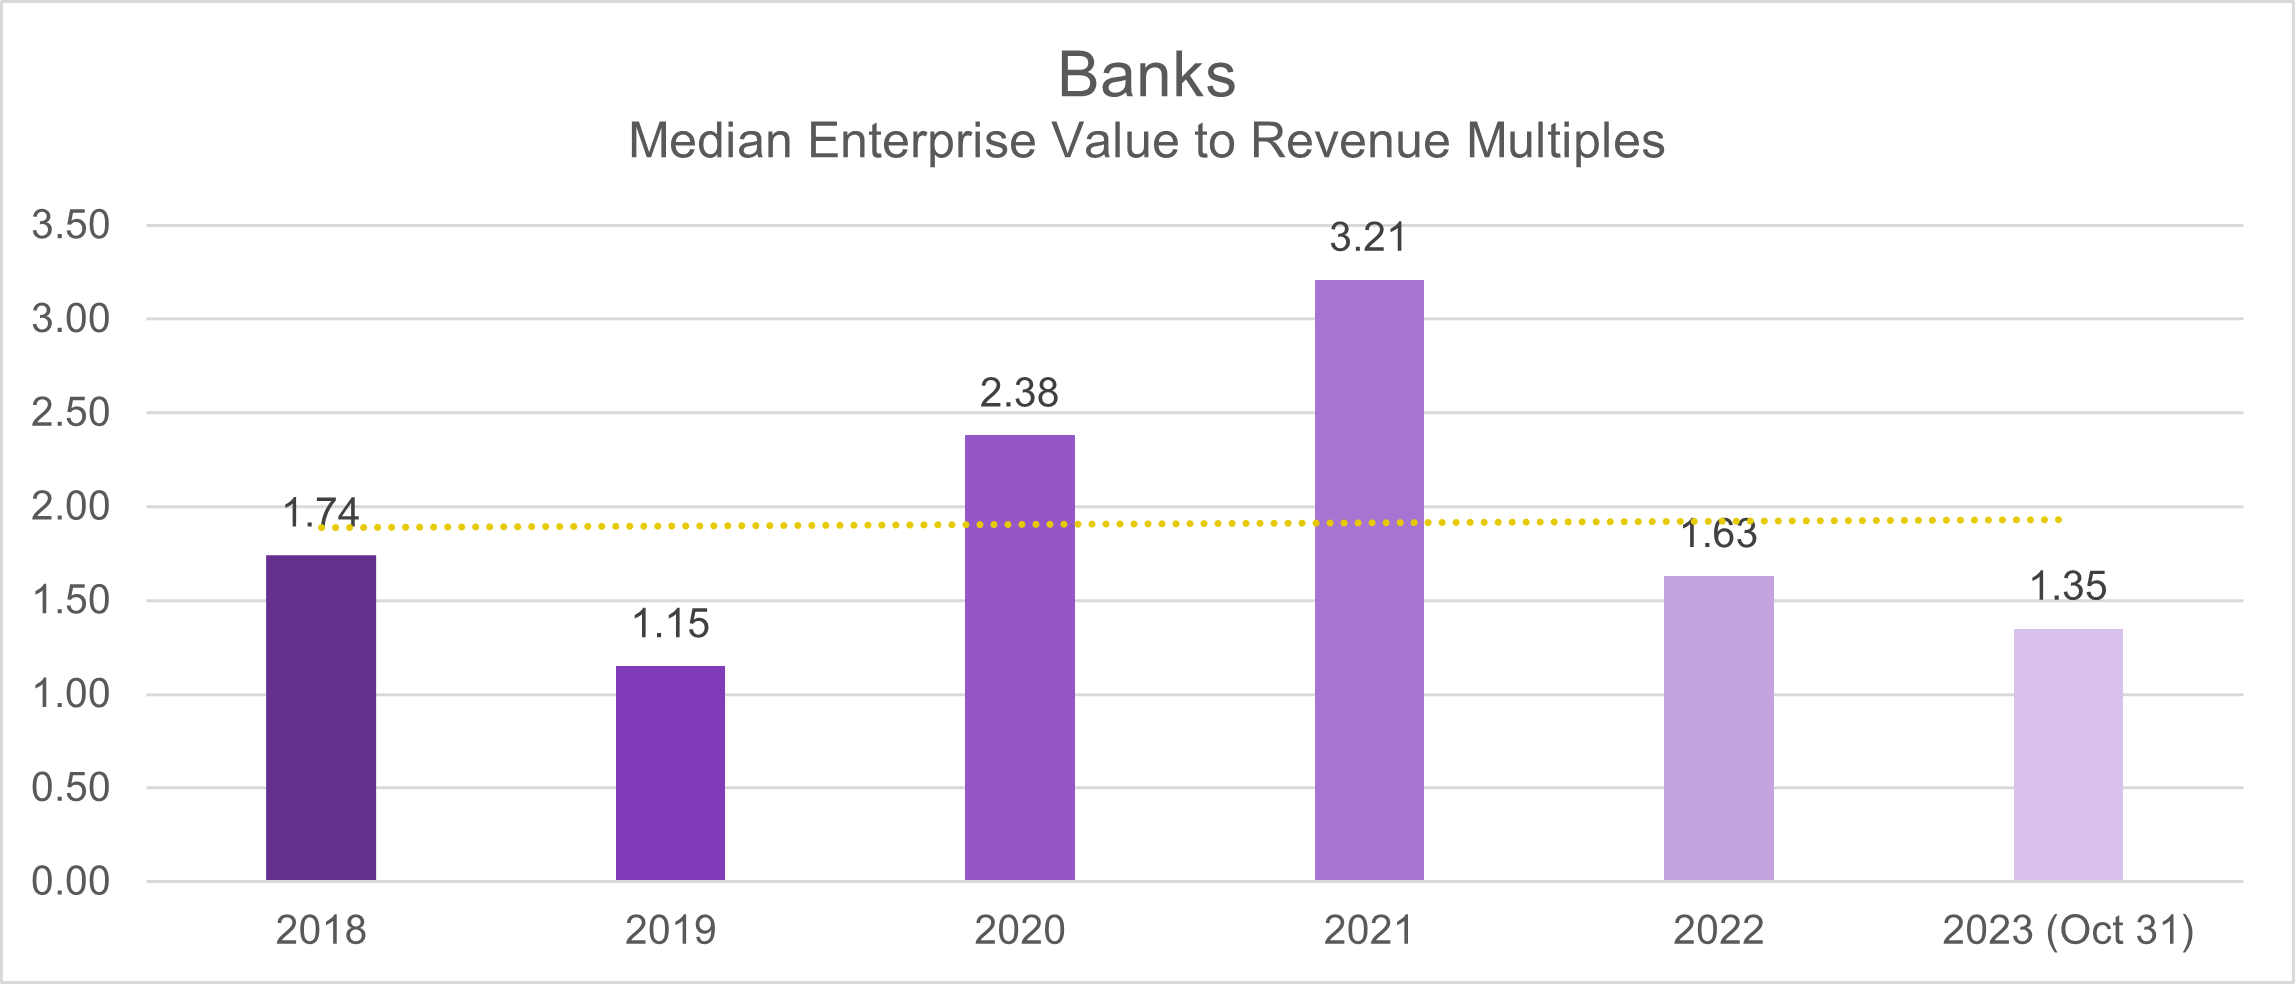
The same trend could be followed when assessed using the EV/Revenue metric. In the pre-pandemic years of 2018-2019, median deal multiples consistently ranged between 1.1 and 1.7.
However, a distinct shift occurred during 2020-2021 in the banking sector, with median deal multiples experiencing a notable increase, climbing from 1.1-1.7 in 2018-2019 to 2.4 in 2020 and further surging to 3.2 in 2021.
The post-pandemic phase witnessed a subsequent adjustment in these metrics, indicating a downward trend. In 2022, the median deal multiples decreased to 1.6 and continued to settle at 1.4 as of October 2023.
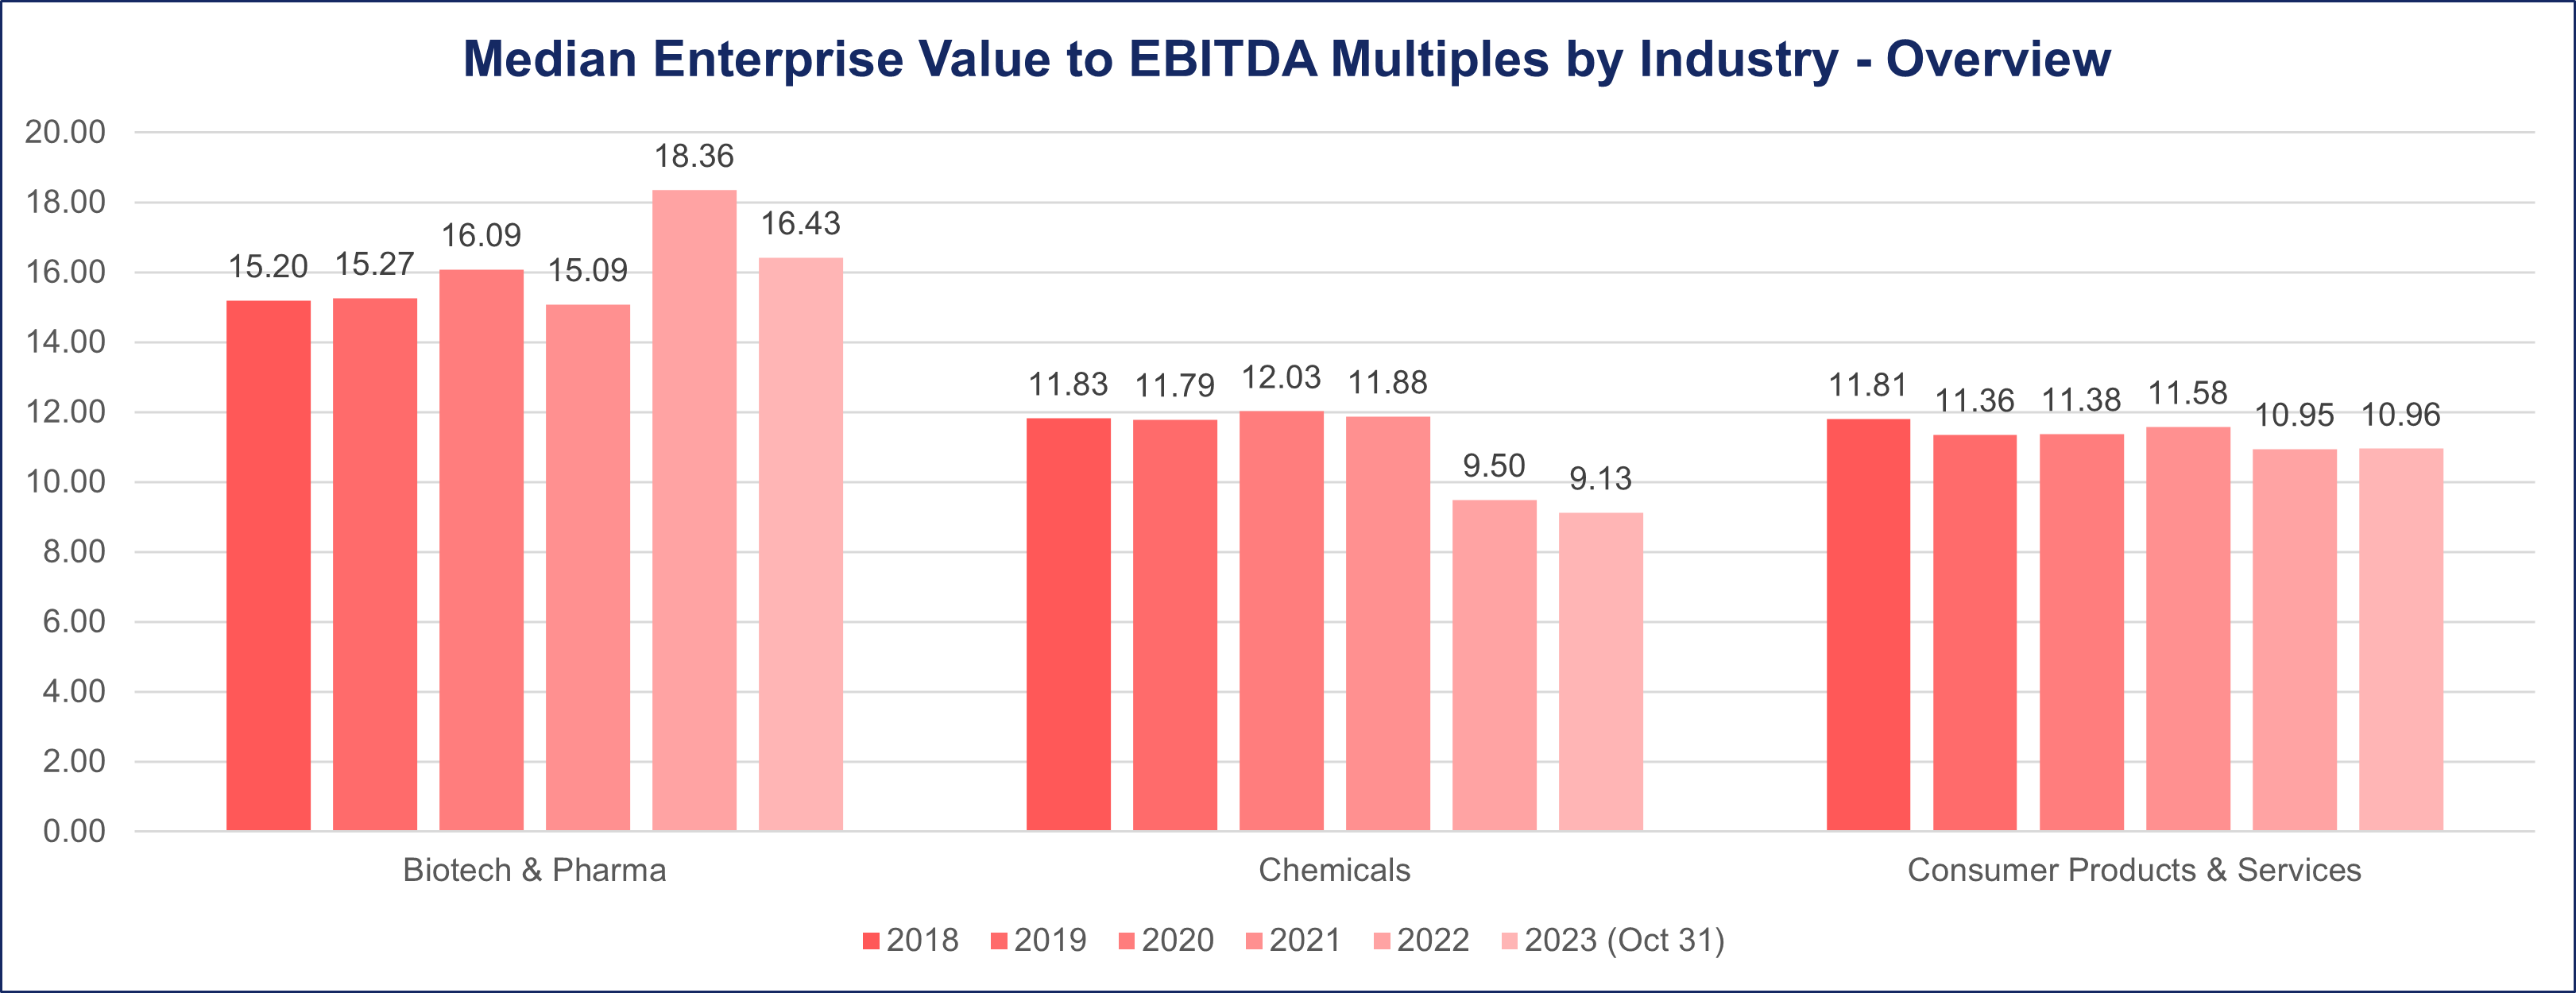
Biotech & Pharma
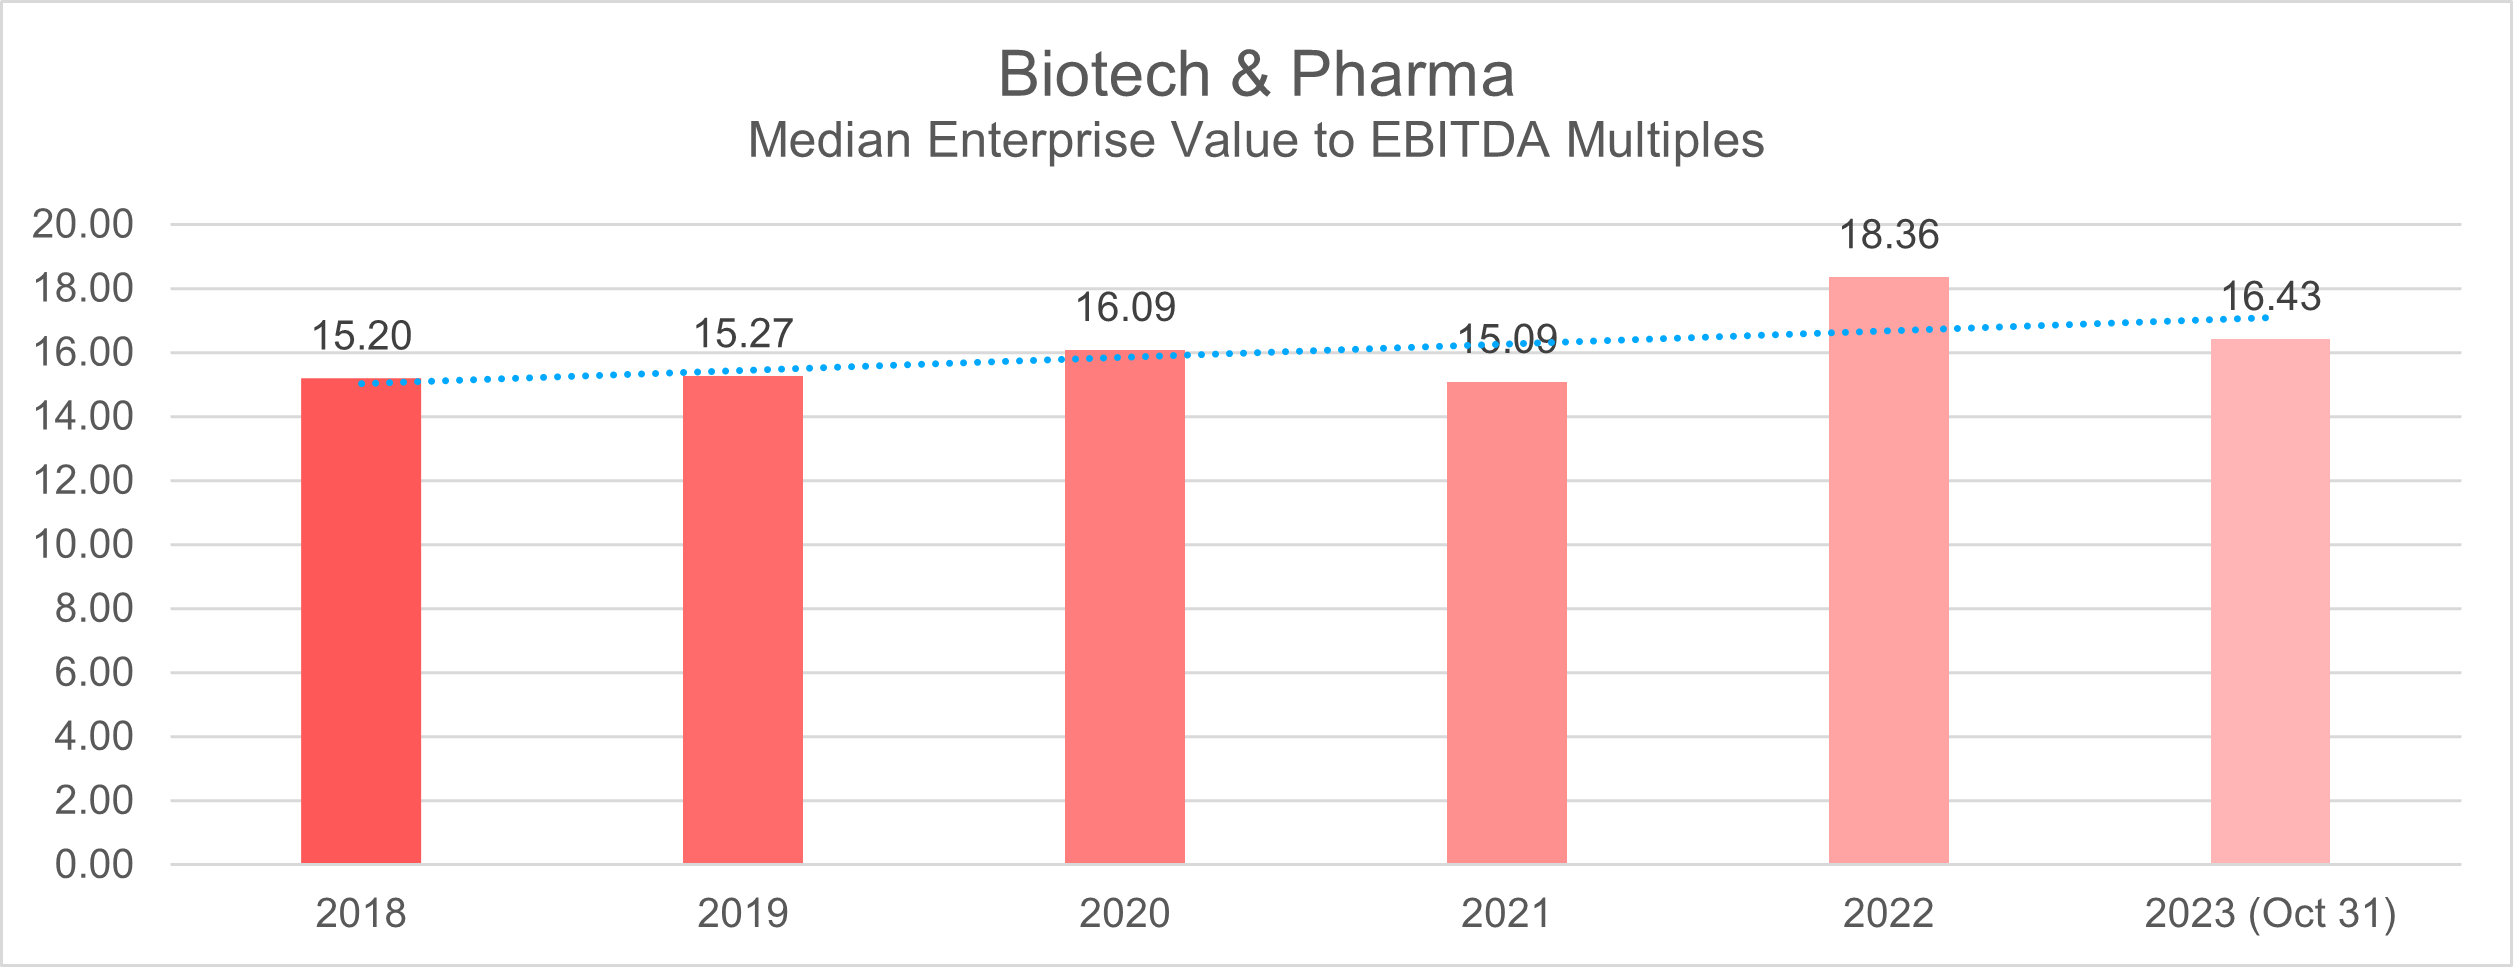
During the 2018-2019 period, the Biotech and Pharma industry consistently demonstrated strong median deal multiples of 15, as measured by the EV/EBITDA metric.
Amidst the challenges posed by the Pandemic Period, there was a notable uptick in deal multiples, reaching a peak of 16 in 2020. However, this was followed by a slight decline to 15 in 2021.
The resilience of the Biotech and Pharma sector became evident in 2022, as it not only recovered from the previous year’s dip but also experienced a significant increase in median multiples, reaching 18.4. As of October 2023, the industry’s performance remains noteworthy, with a median deal multiples figure of 16.4.
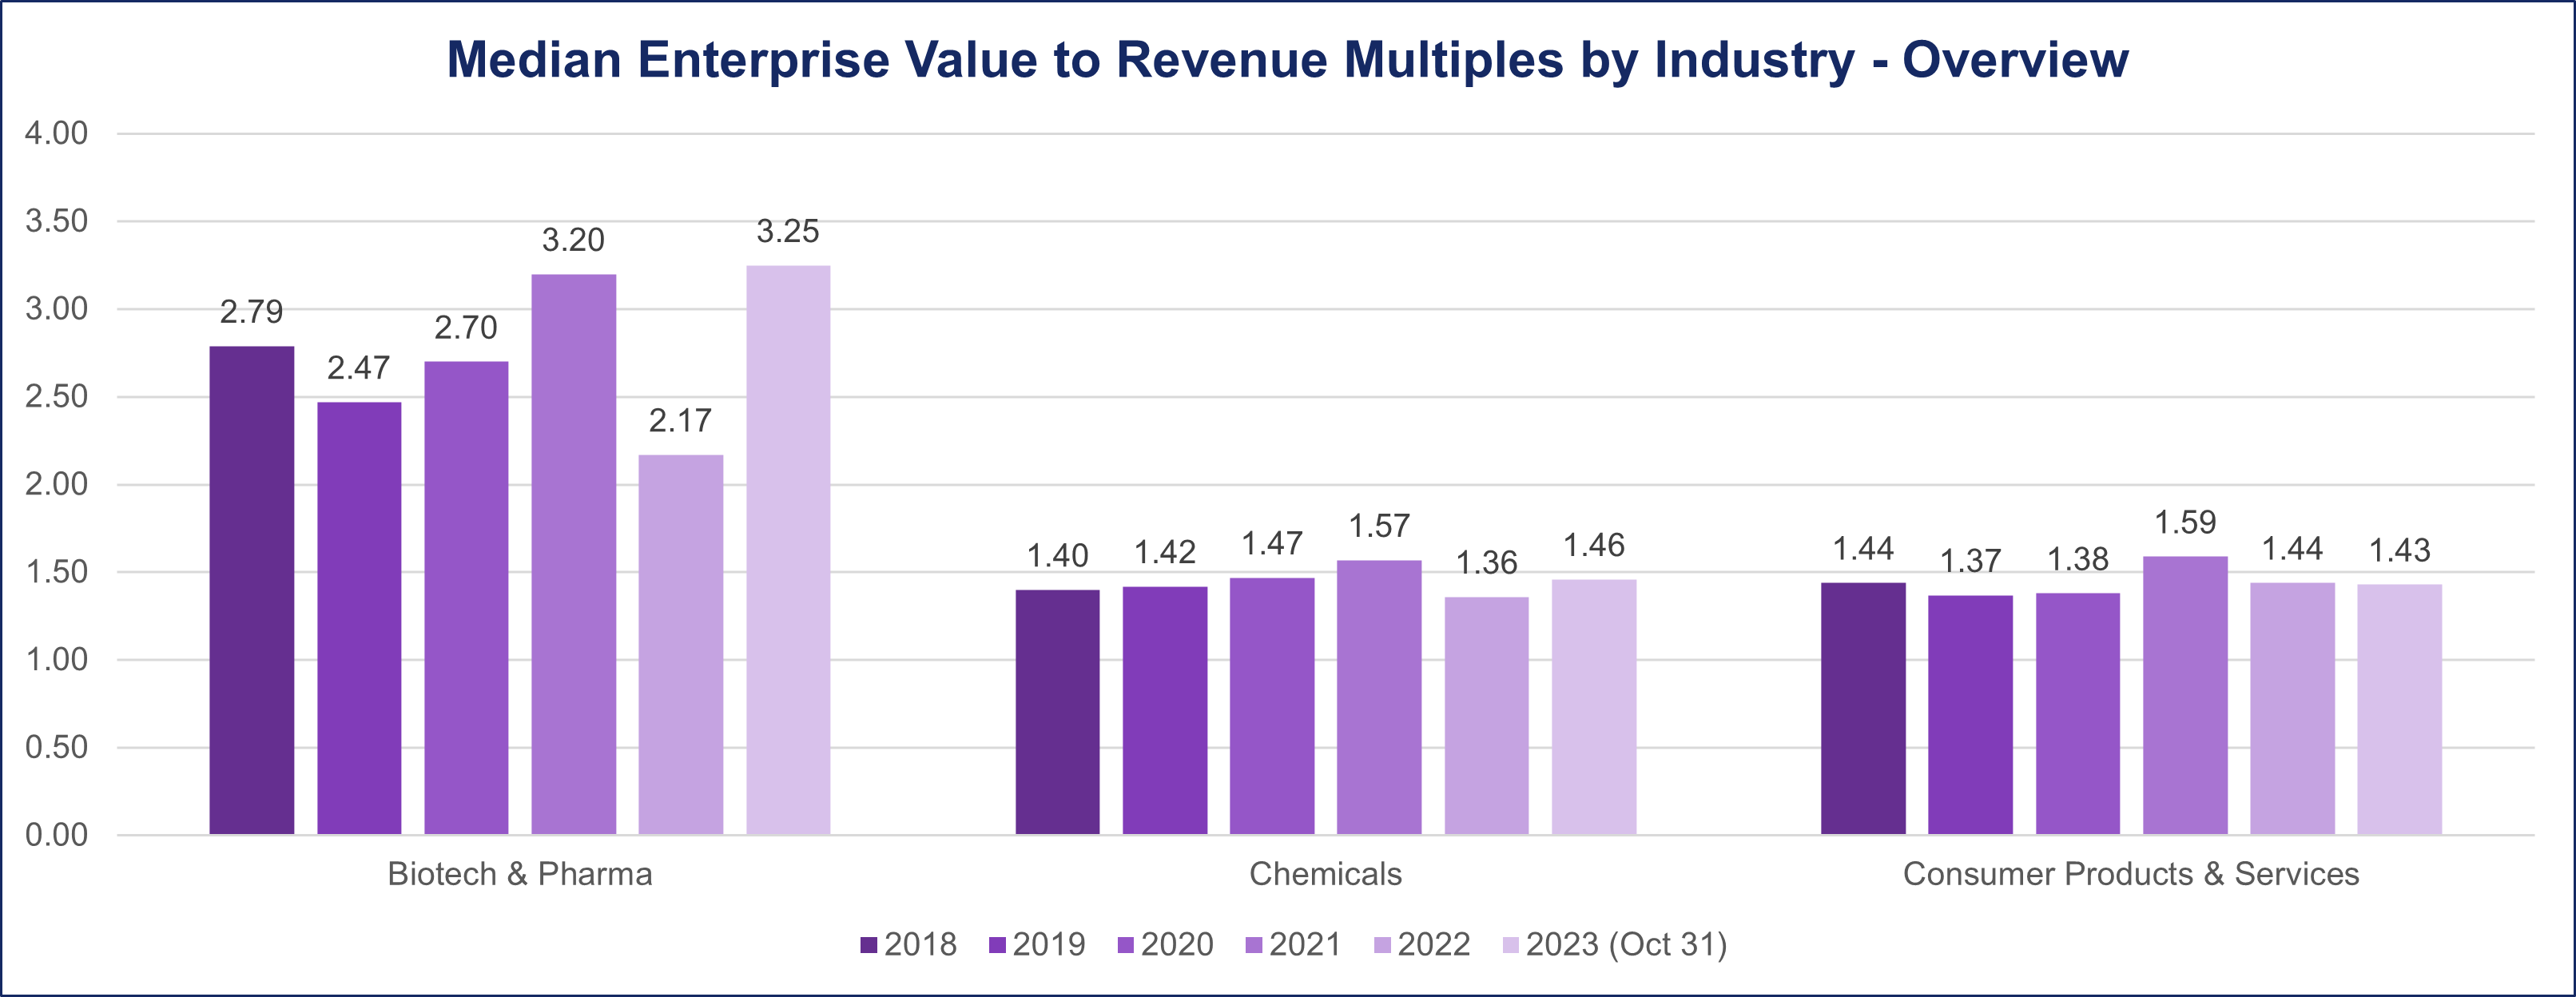
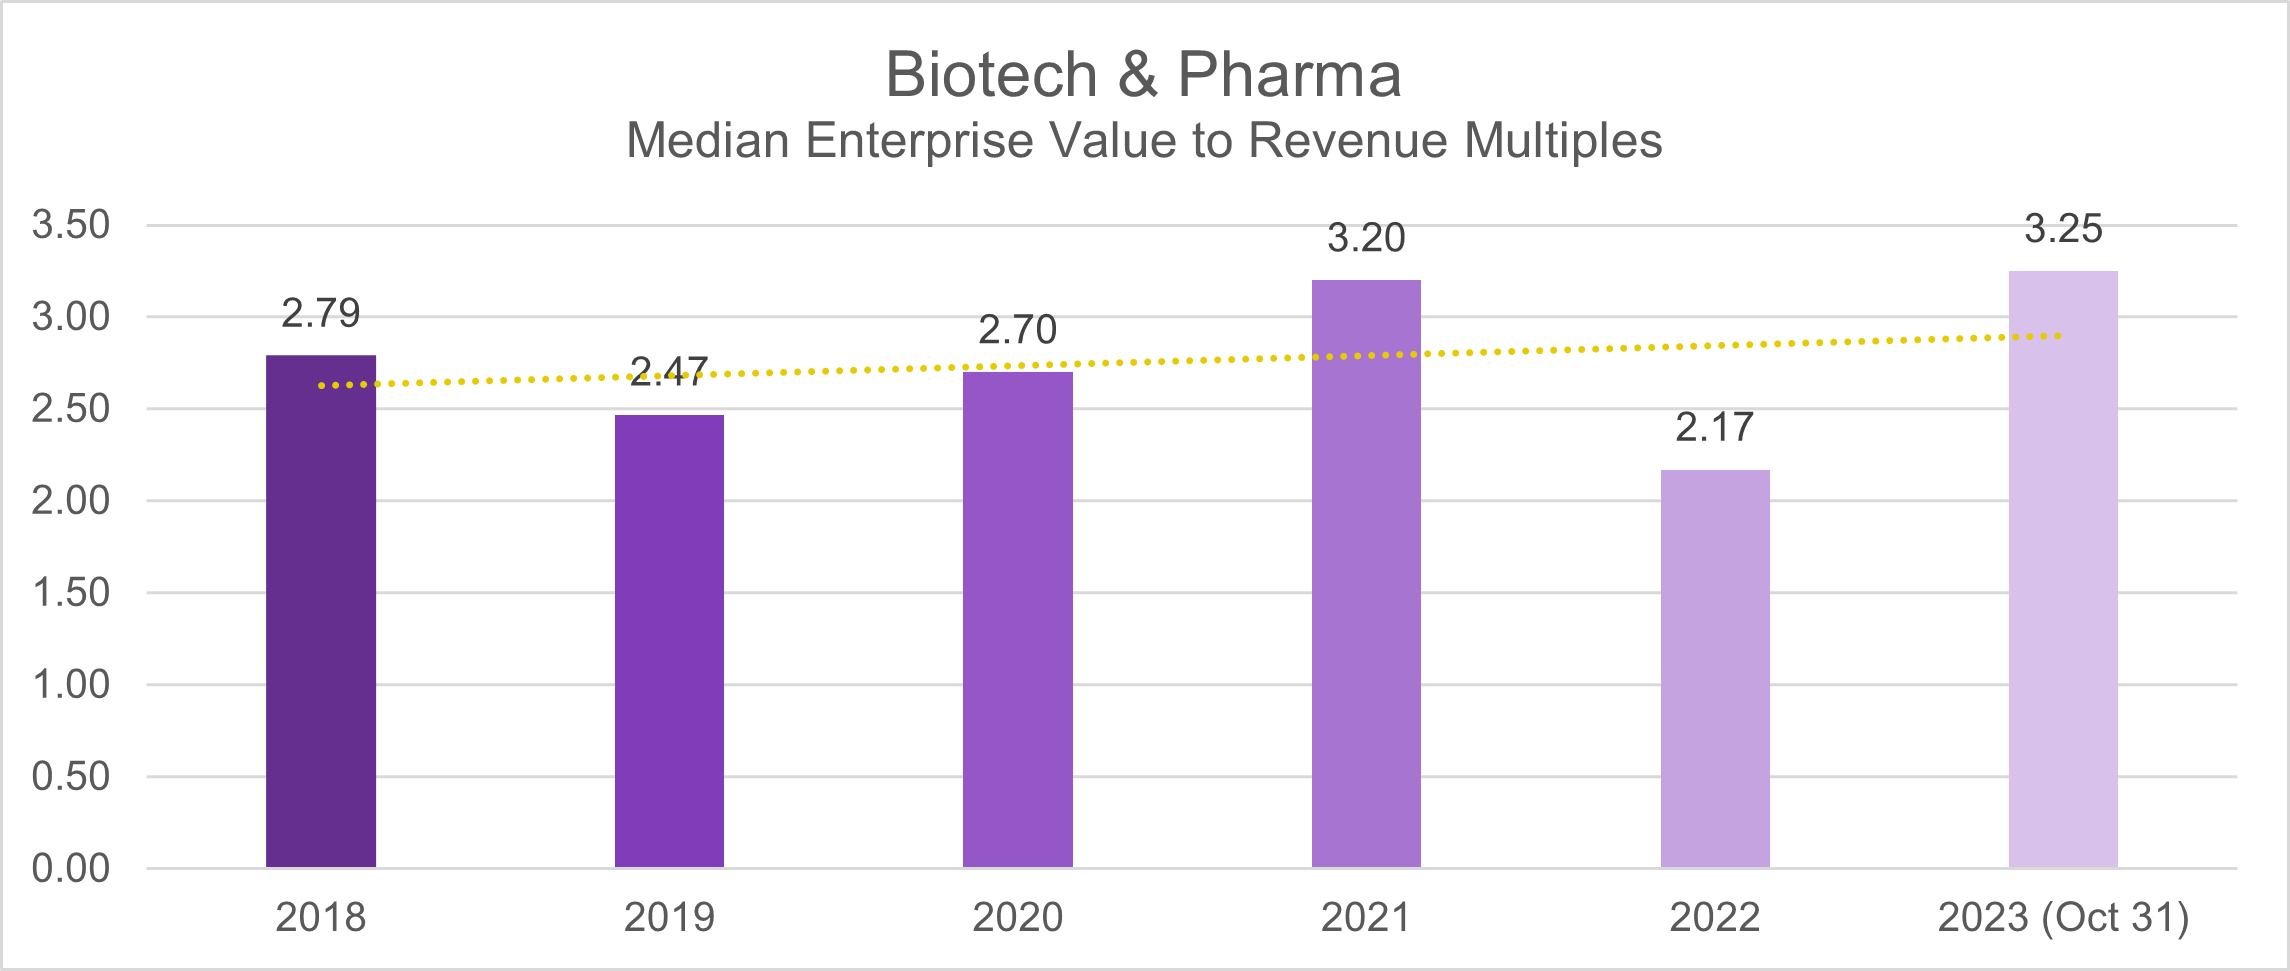
A discerning analysis of the EV/Revenue metric unveils noteworthy fluctuations in deal multiples over the years. From 2018 until the onset of the pandemic in 2020, the median deal multiples consistently hovered within the range of 2.5 to 2.7. Notably, the Biotech & Pharma sector witnessed an upswing in 2021, reaching a median deal multiple of 3.2.
However, following the pandemic in 2022, there was a downturn in deal multiples, plummeting to 2.2. By October 2023, the industry demonstrated resilience and recovery, as the median deal multiples rebounded to 3.2 once again.
Chemicals
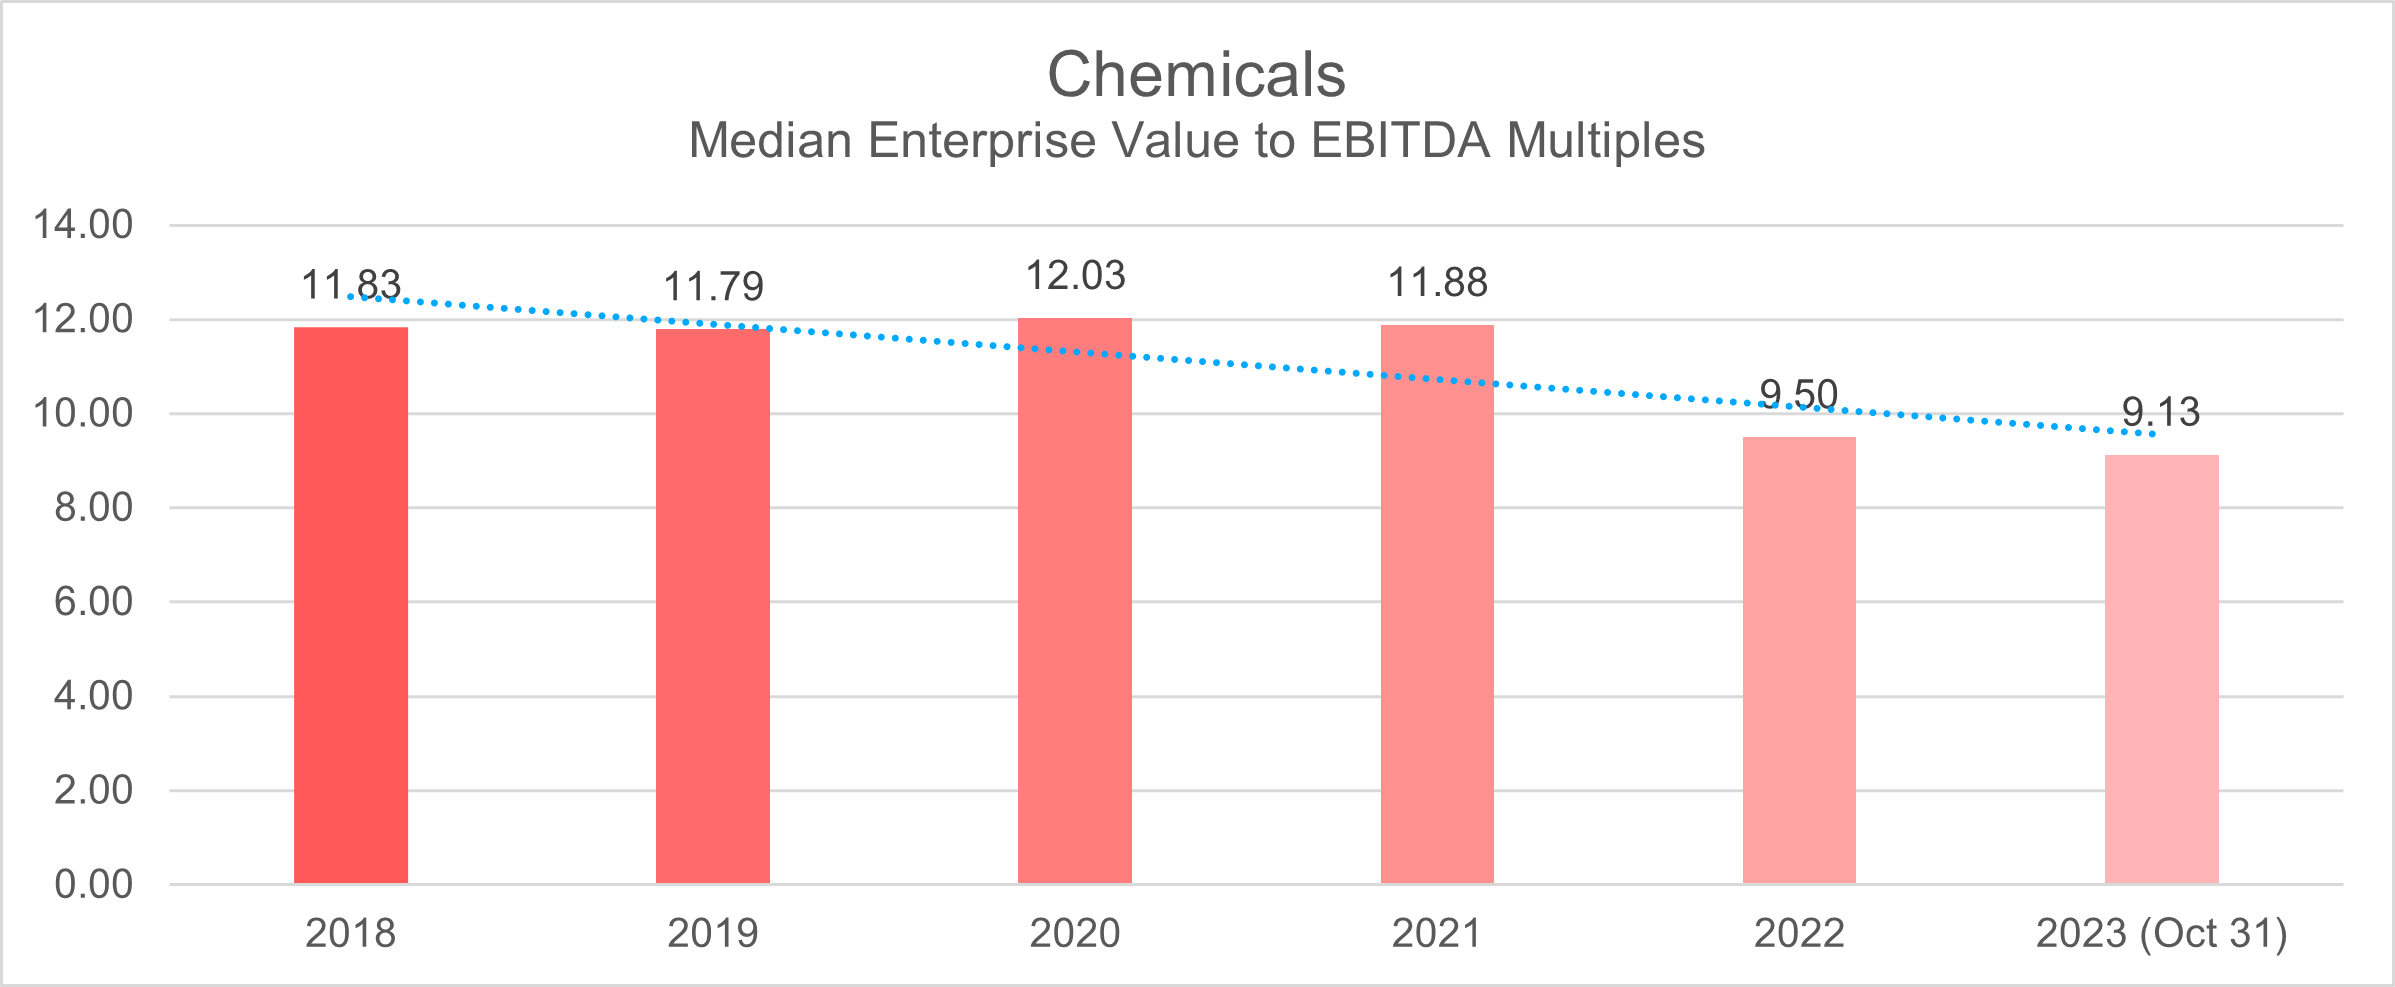
Between 2018 and 2019, the Chemical Industry consistently demonstrated a median deal multiple of 11.8, measured by the Enterprise Value to Earnings Before Interest, Taxes, Depreciation, and Amortization (EV/EBITDA) metric.
Amidst the global pandemic from 2020 to 2021, the industry exhibited resilience by experiencing an increase in deal multiples to 12, reflecting its ability to navigate economic uncertainties during challenging times.
However, the post-pandemic recovery period, from 2022 to October 2023, witnessed a shift in the deal landscape. During this time, there was a discernible downturn in deal multiples, eventually stabilizing at 9.1.
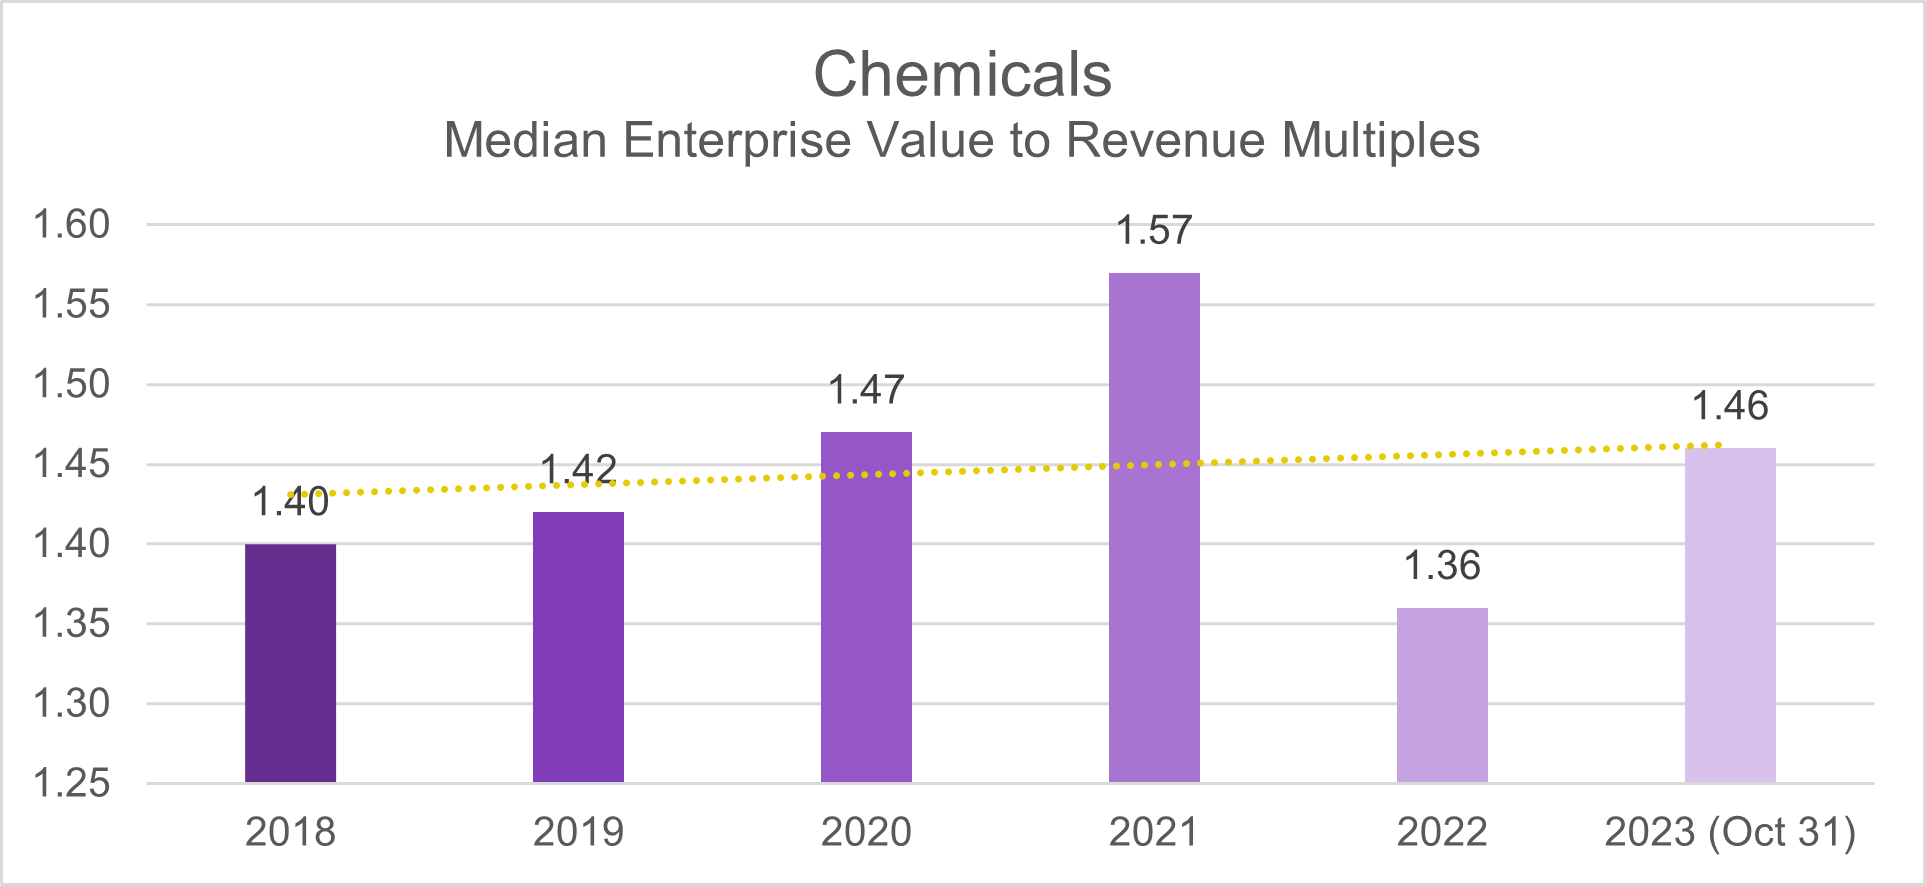
Looking at the median deal multiple trend with the EV/Revenue metric, it was observed that throughout the pre-pandemic period encompassing 2018-2019, the median deal multiple remained consistently at 1.4. A subtle deviation unfolded during the pandemic era (2020-2021), where the deal multiple experienced a slight uptick to 1.6. Notably, in the post-pandemic phase spanning from 2022 to October 2023, the median deal multiple reverted to its pre-pandemic ratio of 1.4.
Consumer Products & Services
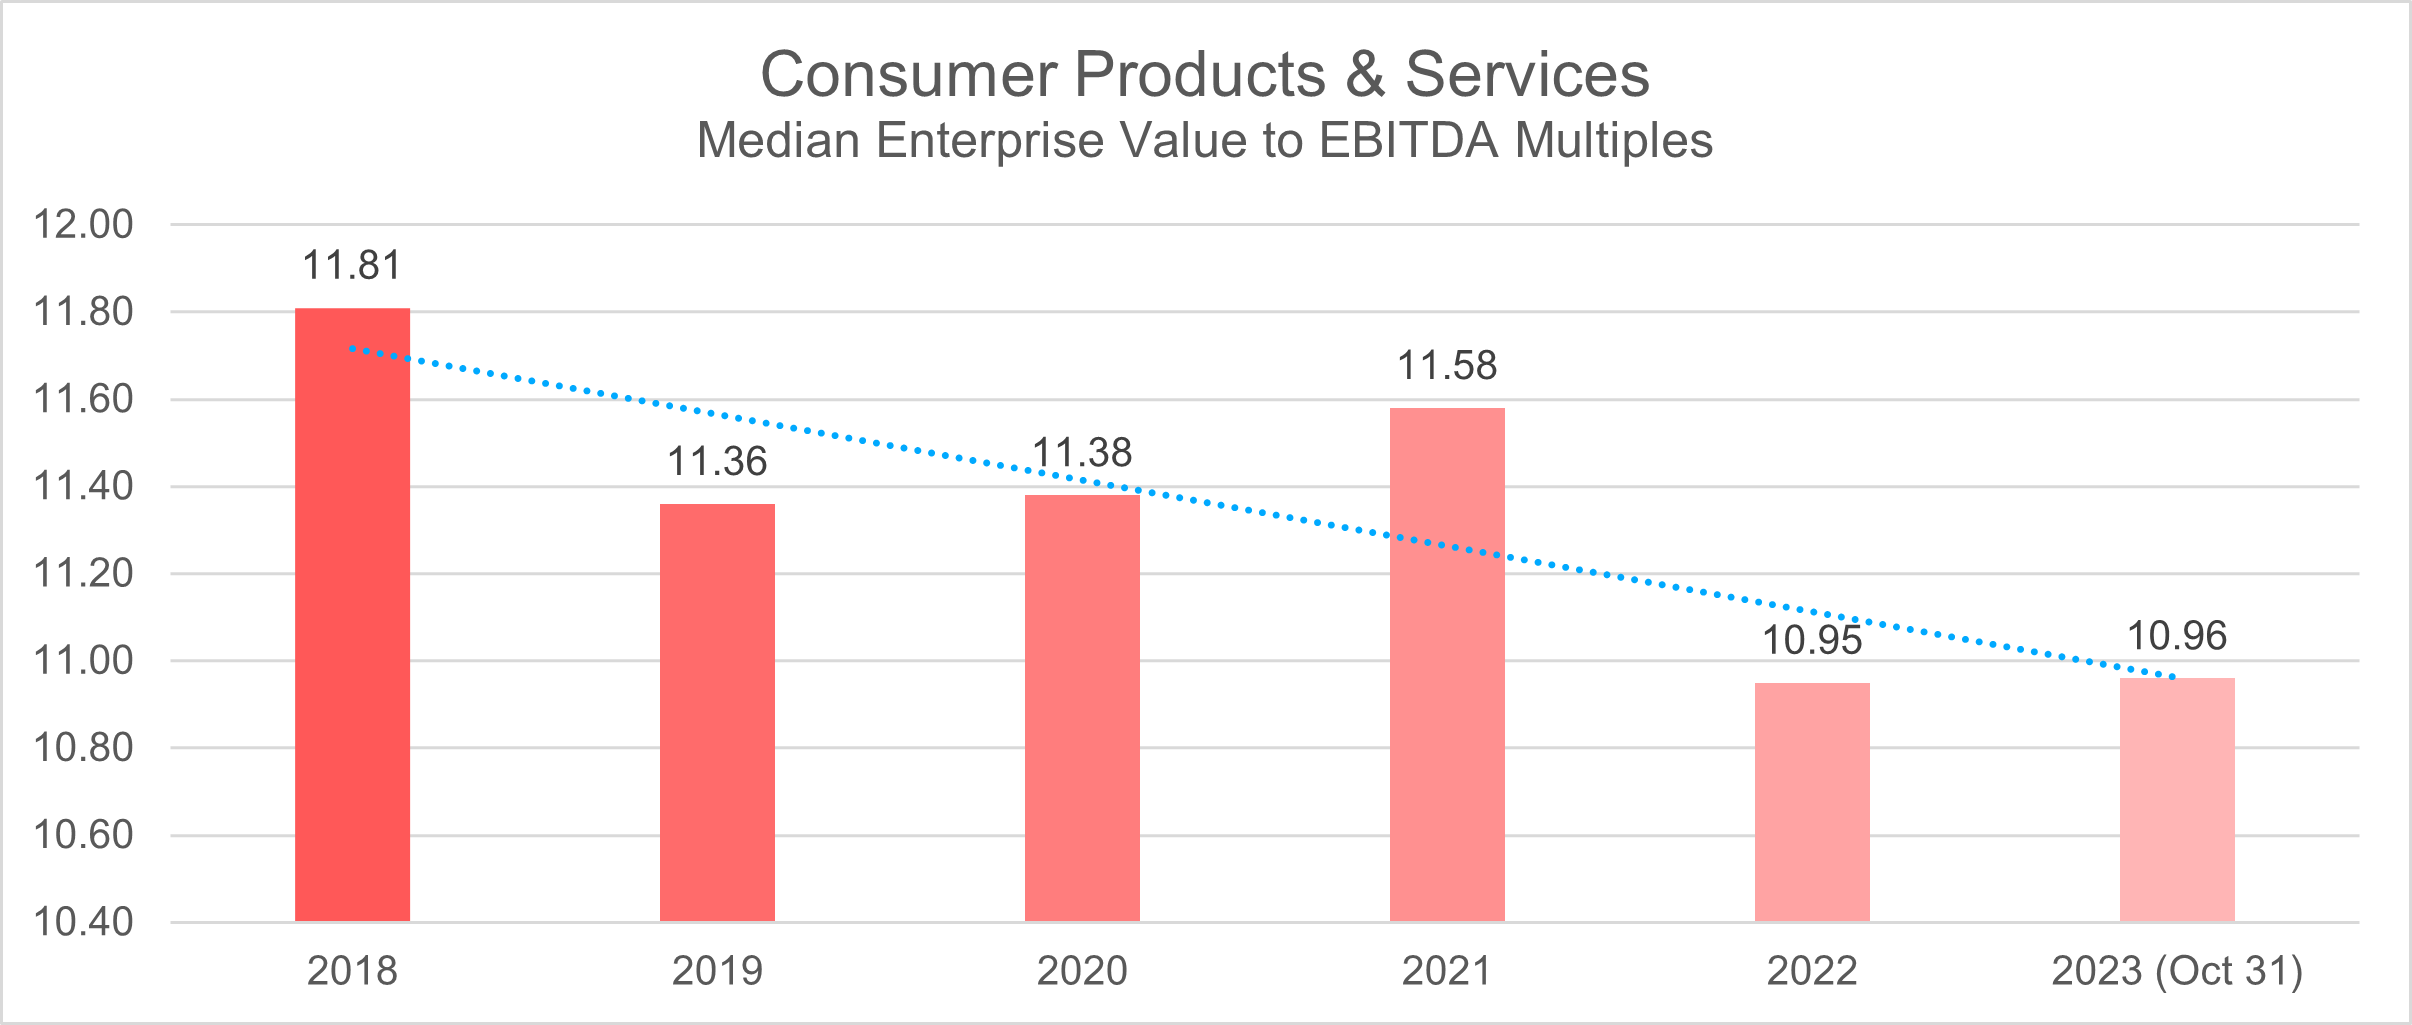
In the years leading up to the pandemic, specifically 2018 and 2019, the Consumer Products & Services Industry consistently maintained median deal multiples of 11.8 and 11.4, respectively, based on the (EV/EBITDA) ratio.
Throughout the pandemic, spanning from 2020 to 2021, the industry displayed resilience by keeping deal multiples within a relatively tight range of 11.4 to 11.6.
However, in the post-pandemic recovery phase from 2022 until October 2023, the industry witnessed a shift in deal landscape dynamics. Deal multiples experienced a downturn during this period, ultimately stabilizing at 10.9.
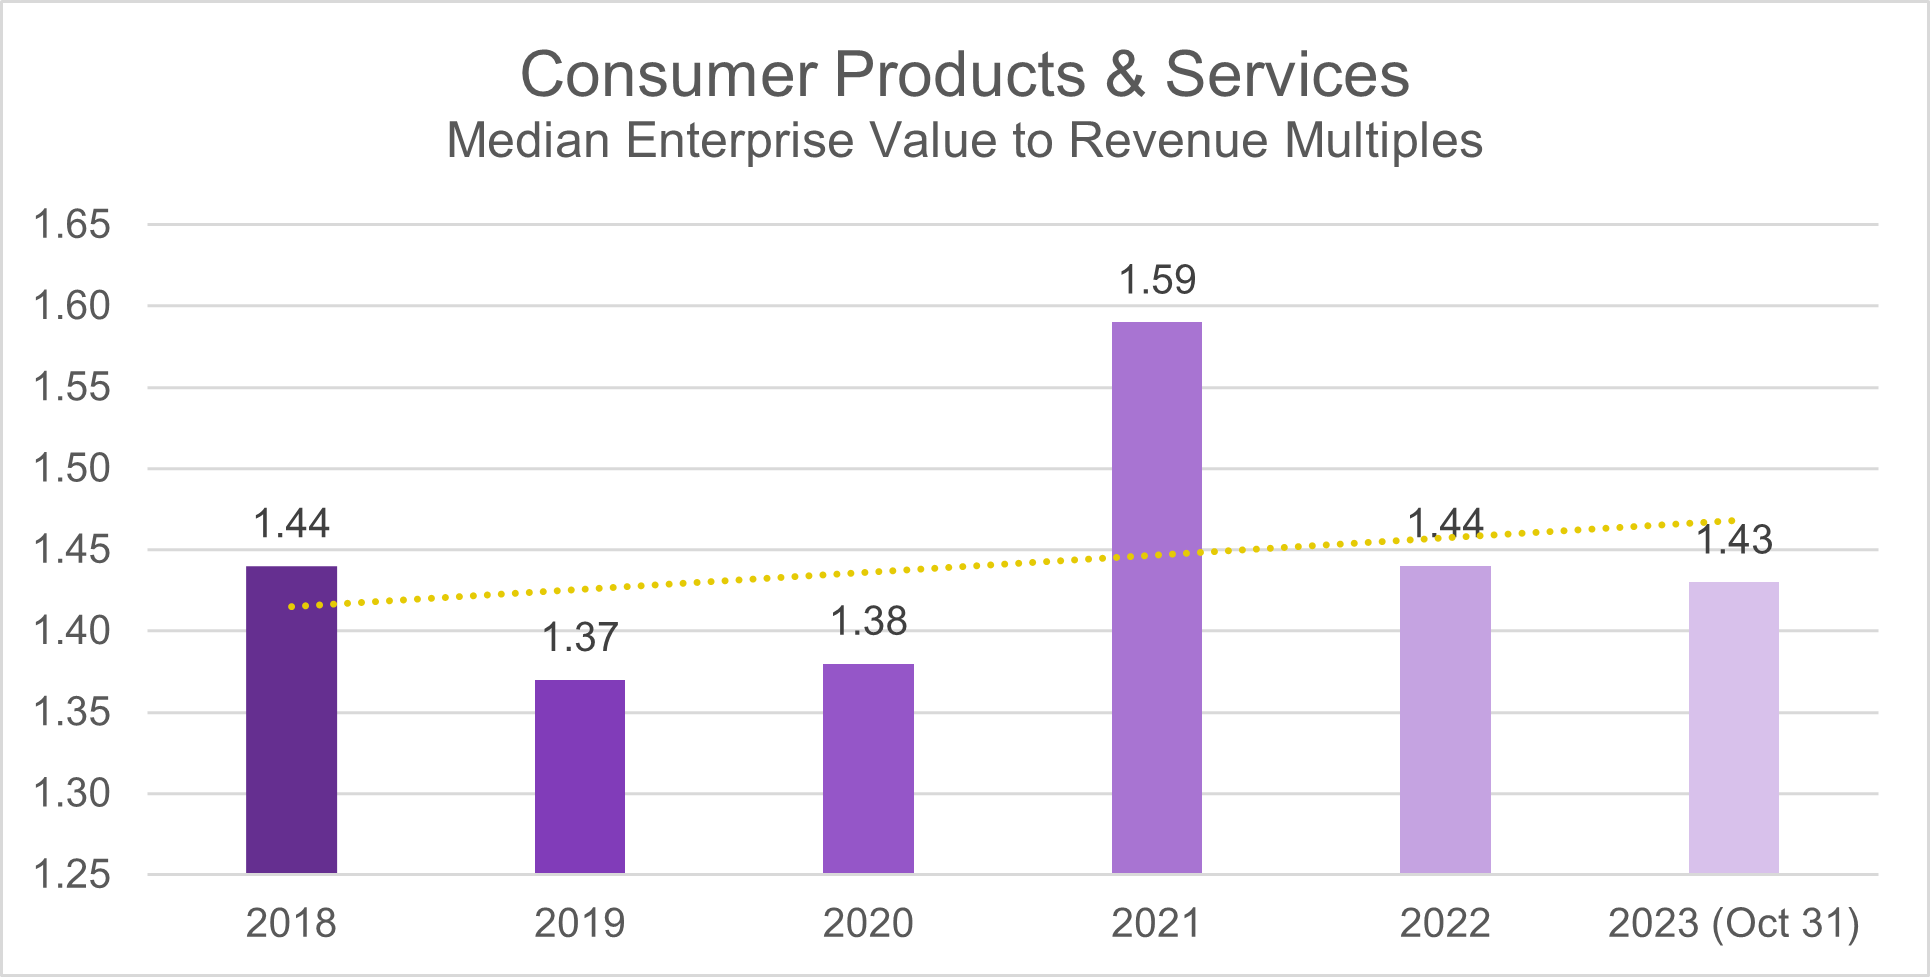
Analyzing the median deal multiples through the EV/Revenue metric reveals interesting trends. In the period before the pandemic (2018-2019), the Consumer Products & Services industry consistently maintained a median deal multiple of 1.4. However, during the pandemic years (2020-2021), there was a subtle shift, and the deal multiple experienced a slight uptick to 1.6. Notably, in the post-pandemic period from 2022 to October 2023, the median deal multiple returned to its pre-pandemic ratio of 1.4.
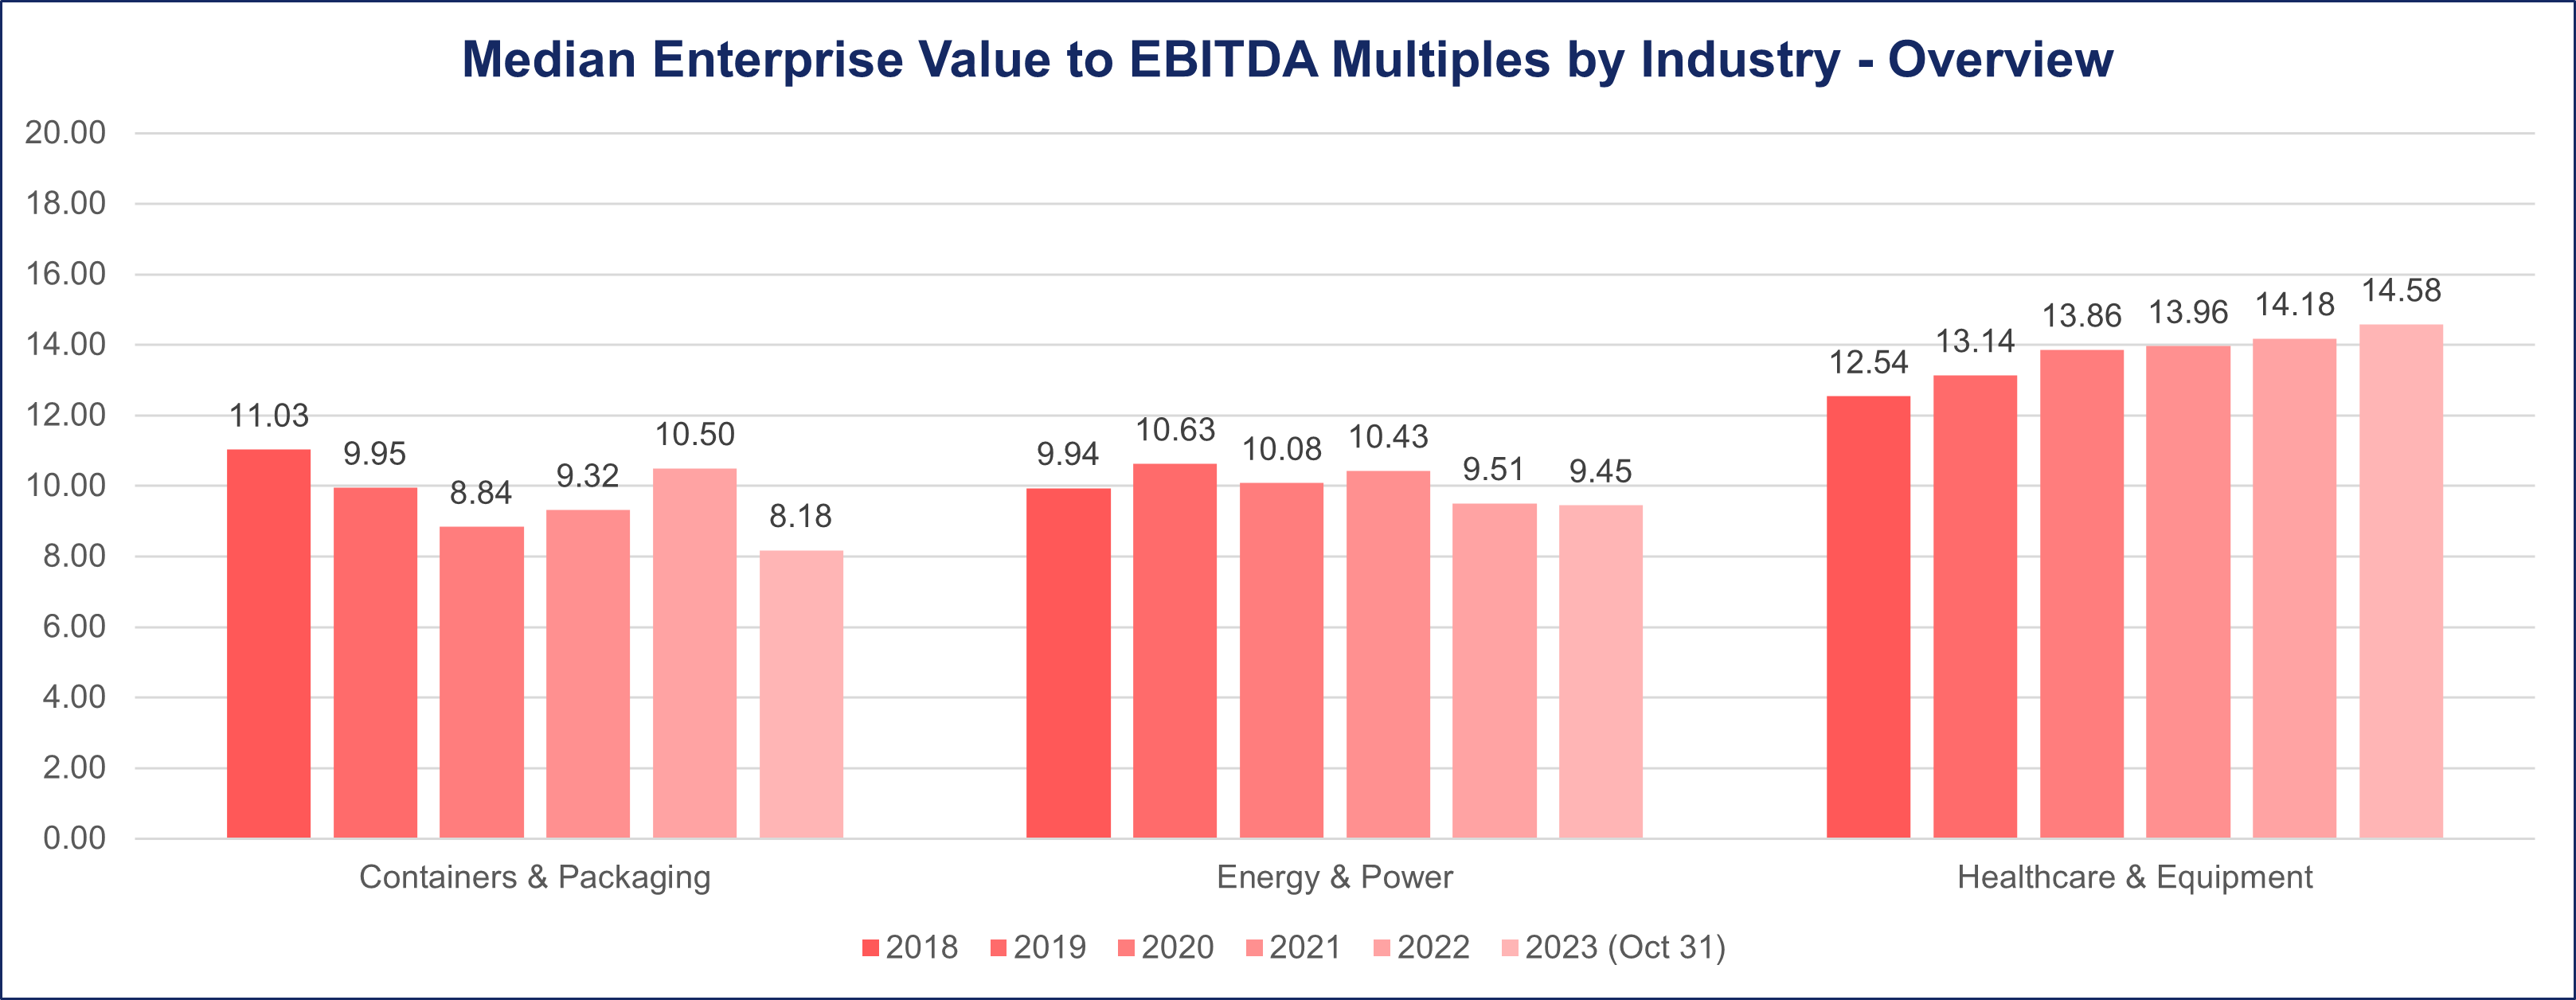
Containers & Packaging
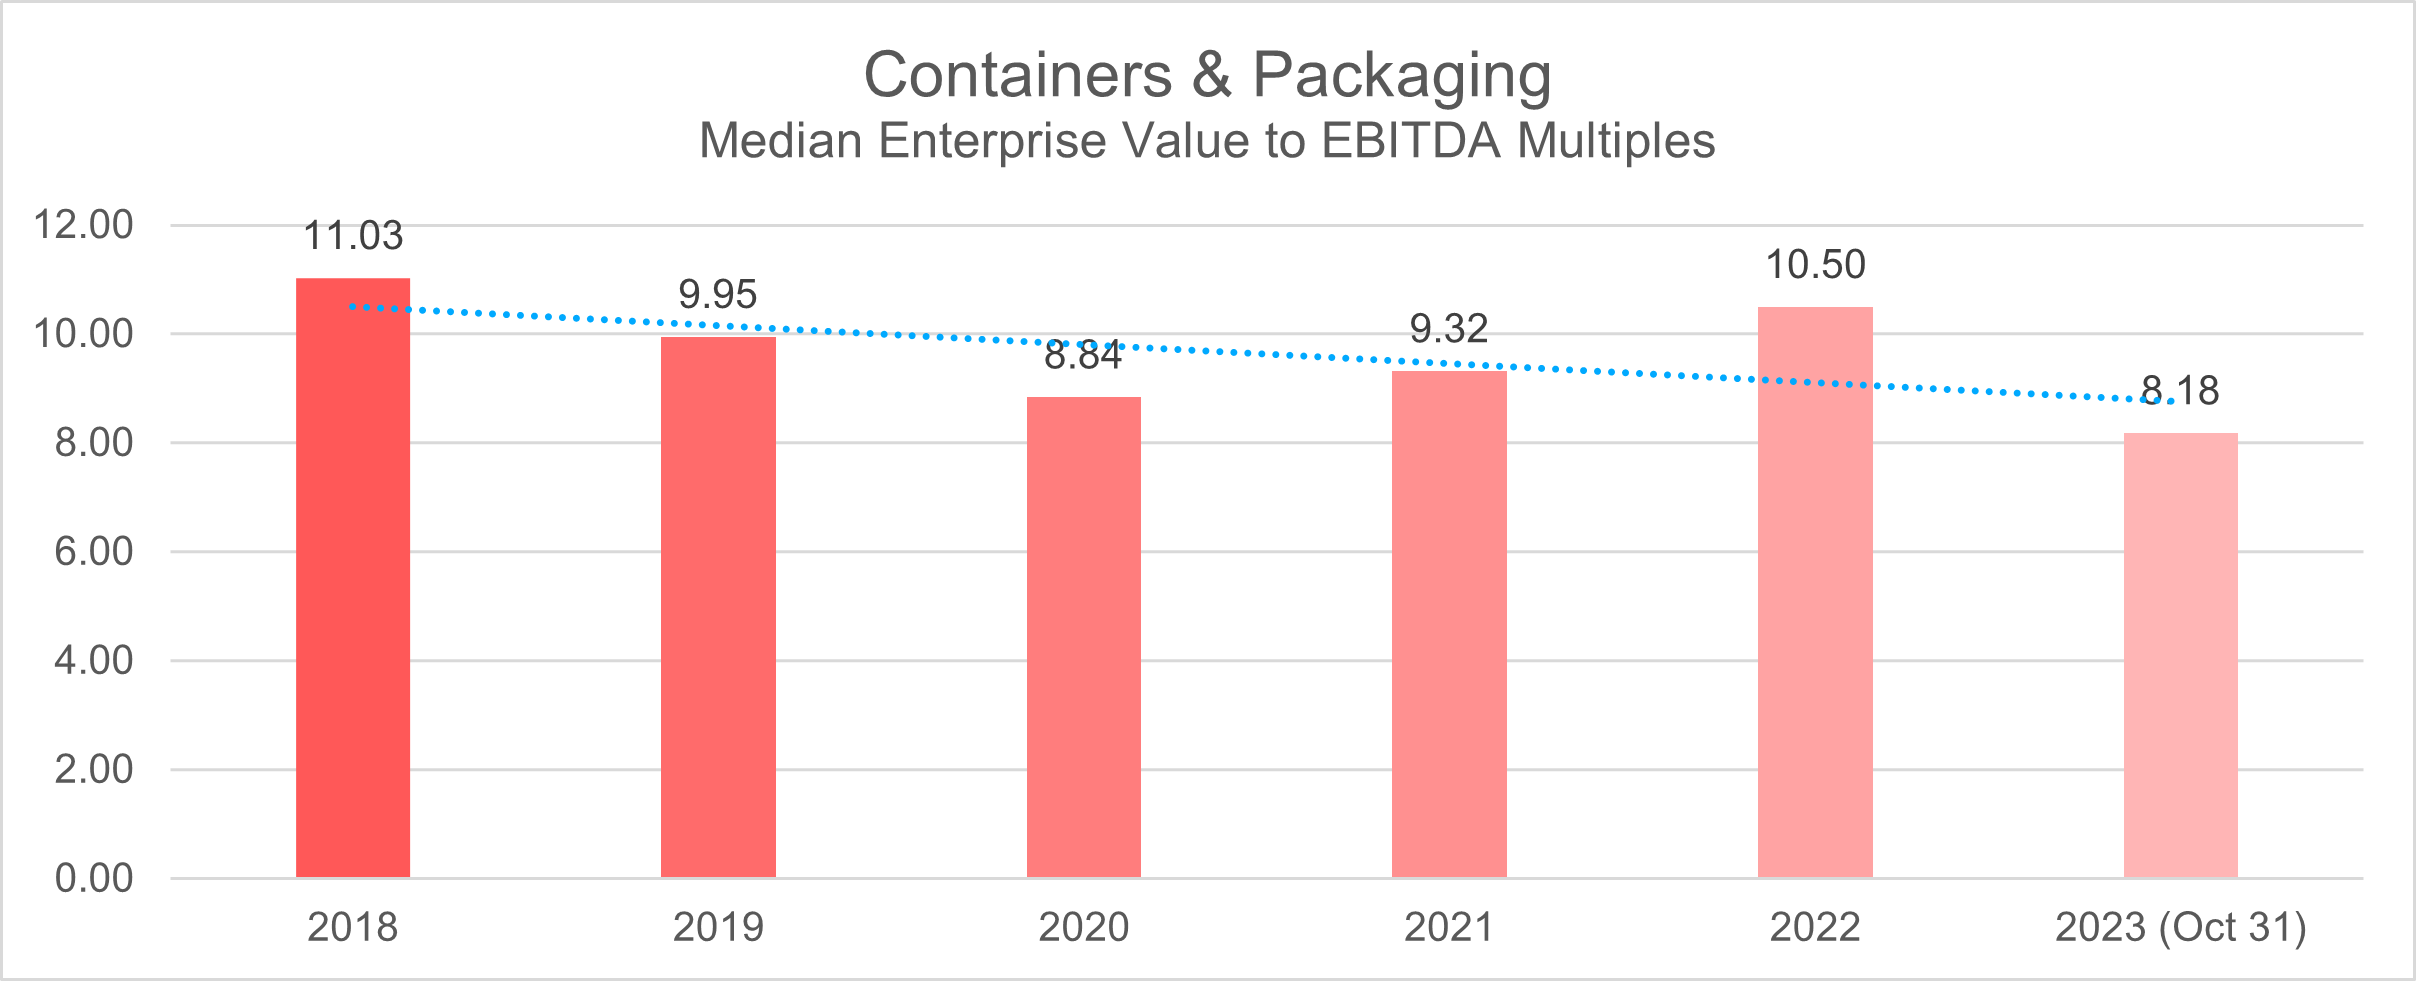
During the pre-pandemic years of 2018 and 2019, the Containers and Packaging sector demonstrated a median deal multiple of 11 and 10, respectively, based on the (EV/EBITDA) metric.
The onset of the pandemic triggered a notable downturn in deal multiples for the industry, dropping to 8.8 in 2020 and slightly recovering to 9.3 in 2021.
The post-pandemic landscape in 2022 witnessed a rebound, marked by an increase in the median deal multiple to 10.5 However, the period from January to October 2023 showcased a reversal in this positive trajectory, with the median deal multiple dropping to 8.
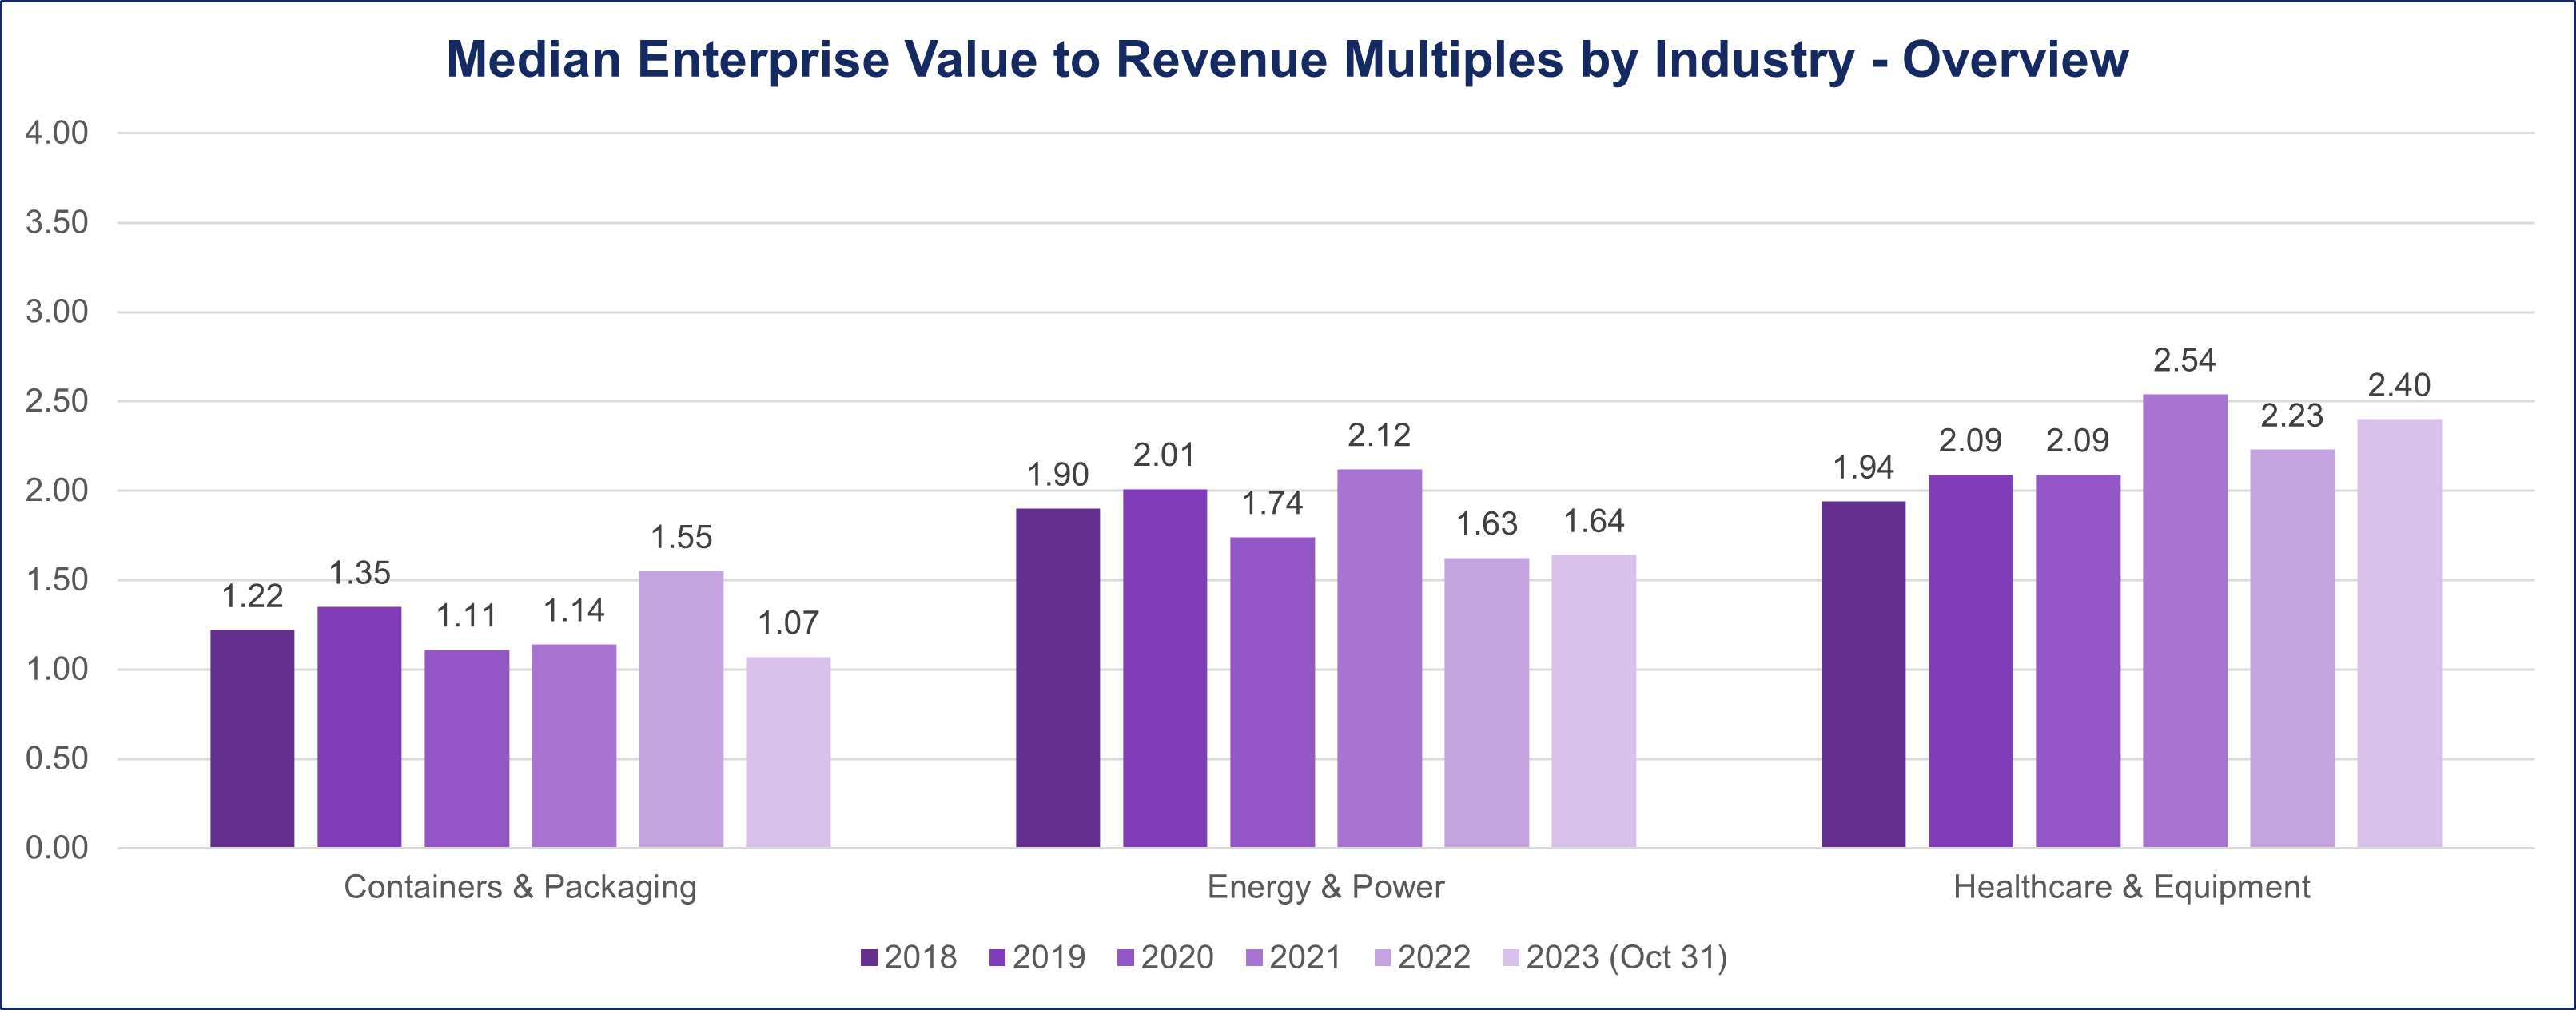
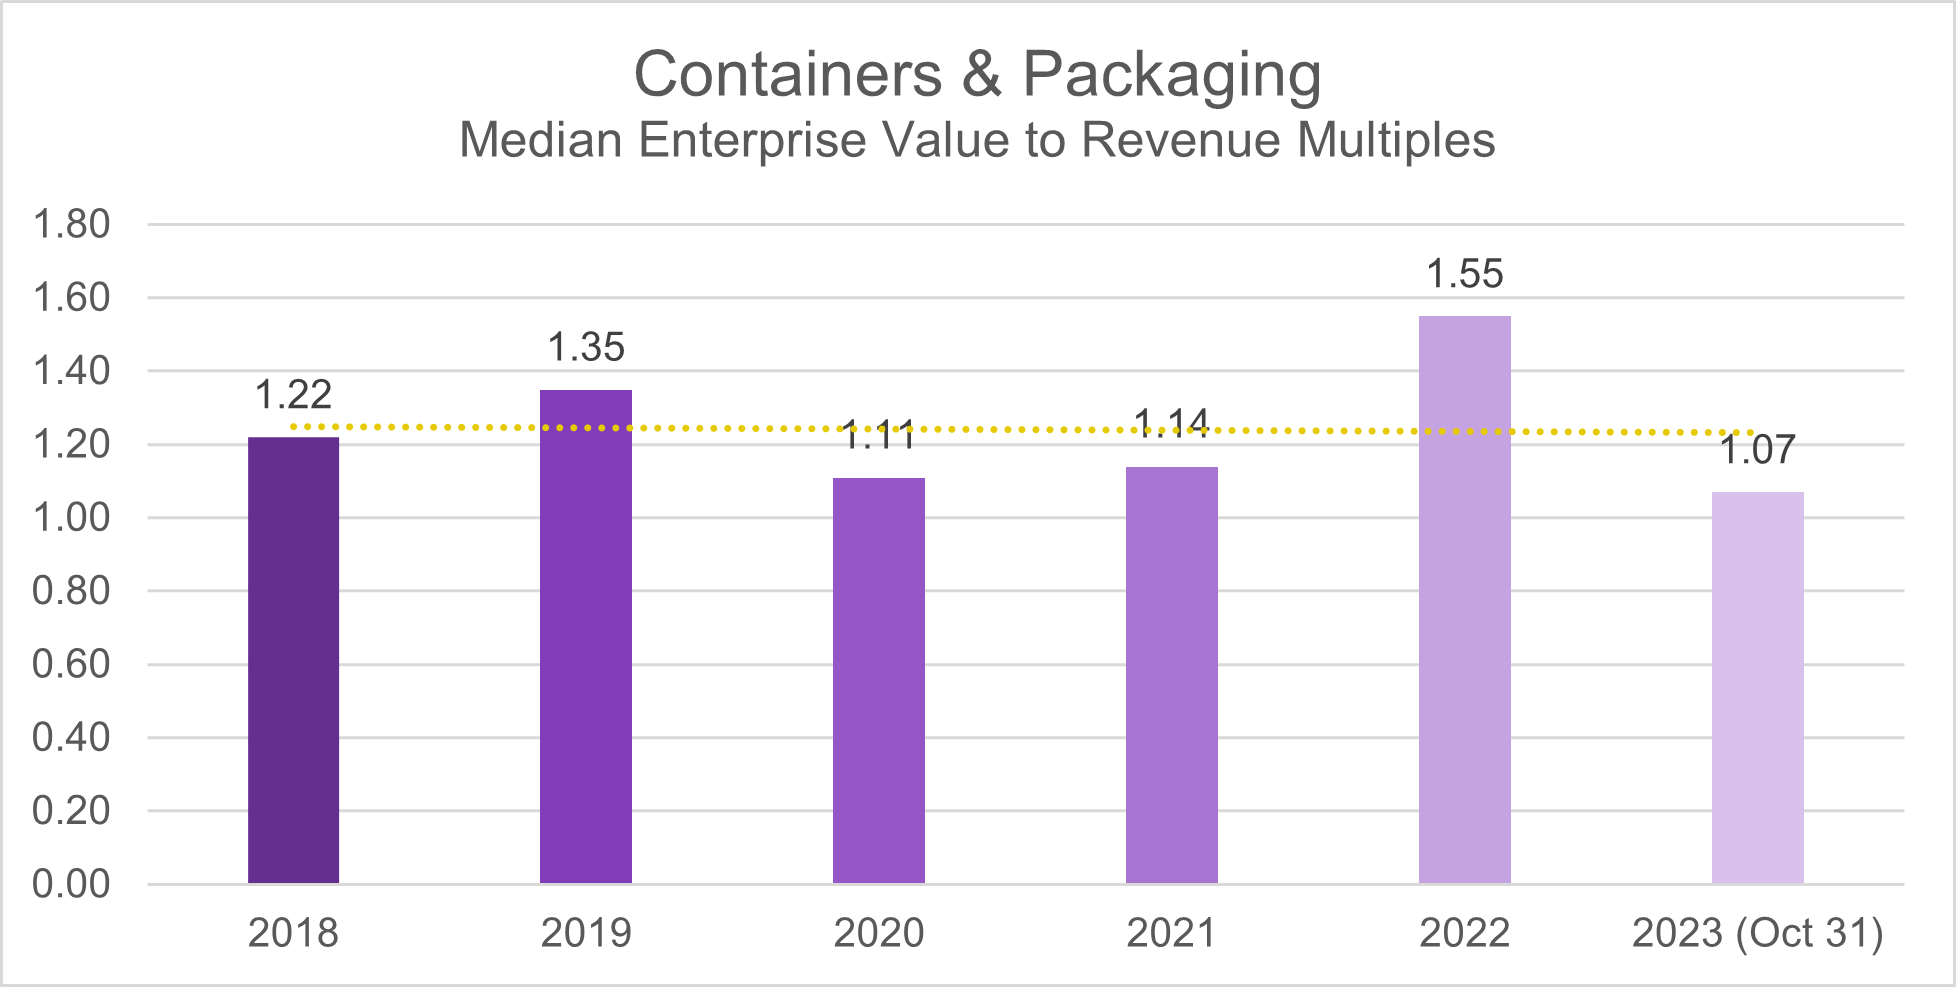
The median deal multiples for the 2018-2019 period, as determined by the EV/Revenue ratio, were 1.2 and 1.4, respectively. The deal multiple remained steady during the pandemic, registering at 1.1 throughout 2020-2021. The industry experienced a modest increase to 1.6 in 2022 before settling back to a median deal multiple of 1 as of October 2023.
Energy & Power
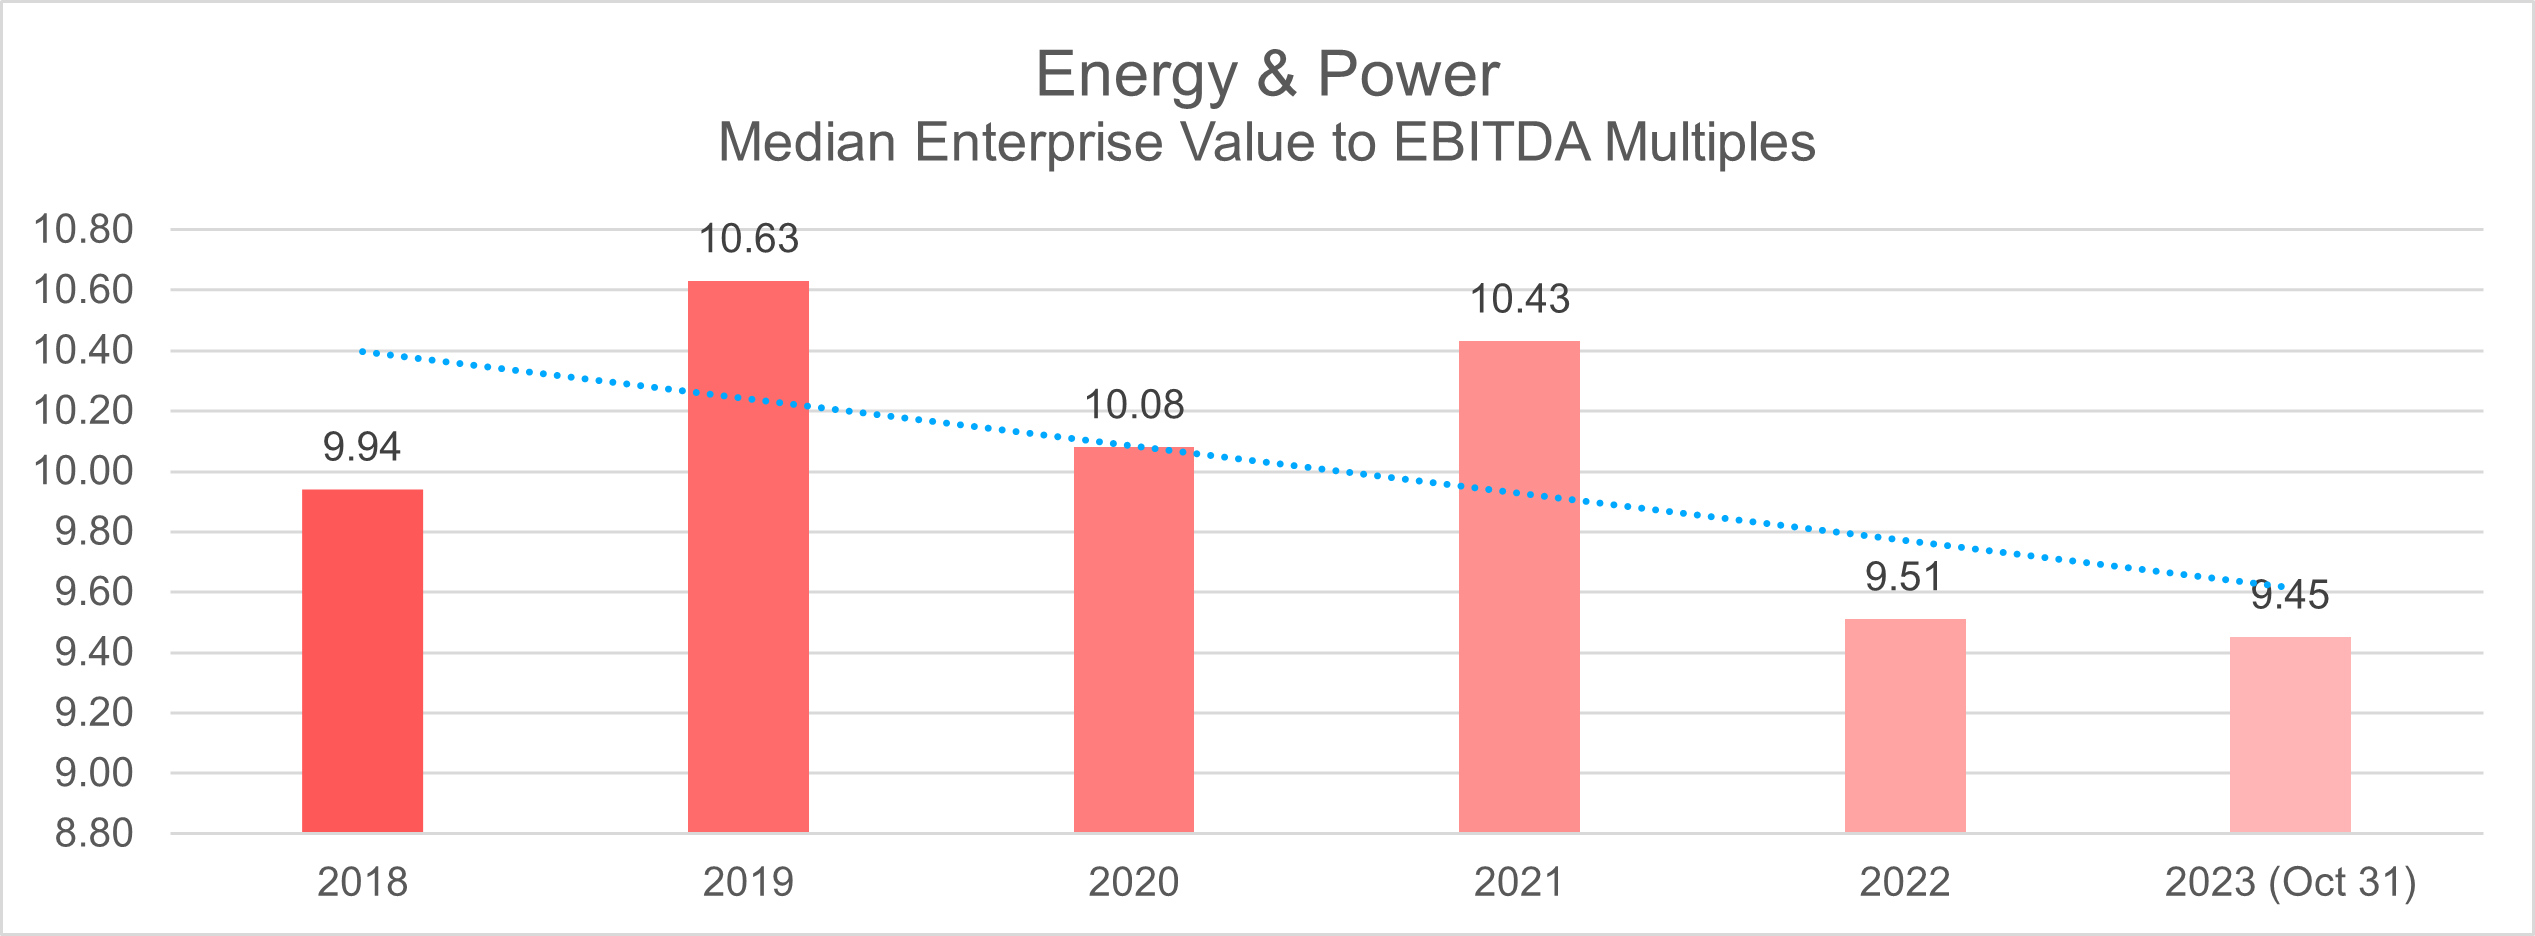
During the period spanning 2018 to 2019, the Energy & Power Industry maintained a relatively stable median deal multiple, ranging between 9.9 and 10.6, based on the (EV/EBITDA) ratio.
The advent of the pandemic from 2020 to 2021 led to a modest reduction in deal multiples, settling at 10 and 10.4, respectively. This decline aligns with the broader economic challenges faced globally during the unprecedented circumstances of the pandemic.
The post-pandemic recovery in 2022 brought about a distinct shift in the industry’s deal landscape, marked by a noticeable decrease in deal multiples to 9.5. Notably, this downward trend continued through October 2023, with the industry maintaining a consistent deal multiple of 9.5.
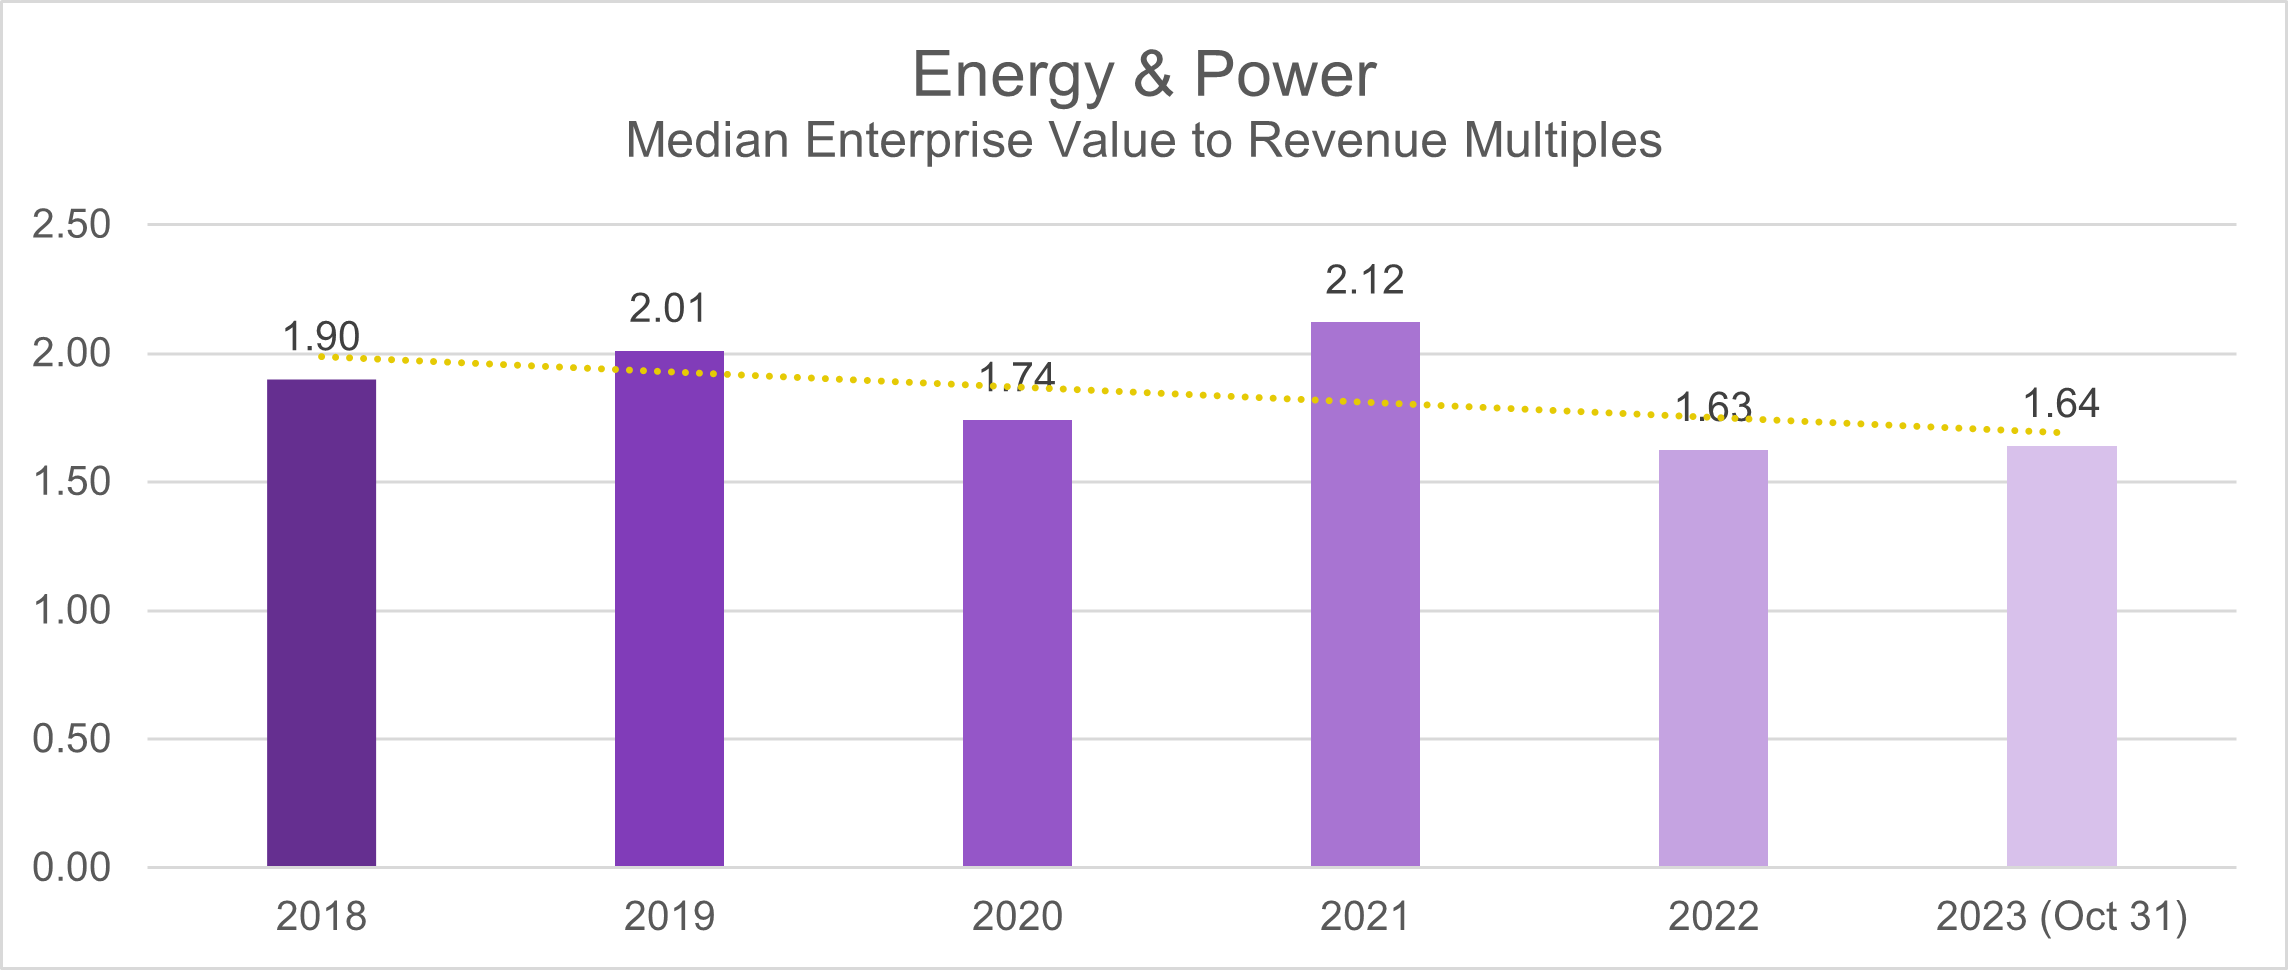
A similar trend was observed using the (EV/Revenue) ratio. Throughout the pre-pandemic years of 2018 and 2019, the median multiple stood at a steady 2. The onset of the pandemic in 2020 marked a modest decline, with deal multiples temporarily falling to 1.7 before rebounding in subsequent years to reclaim the 2 mark. Nevertheless, a discernible dip occurred in the post-pandemic period from 2022 to October 2023, with the ratio settling at 1.6.
Healthcare & Equipment
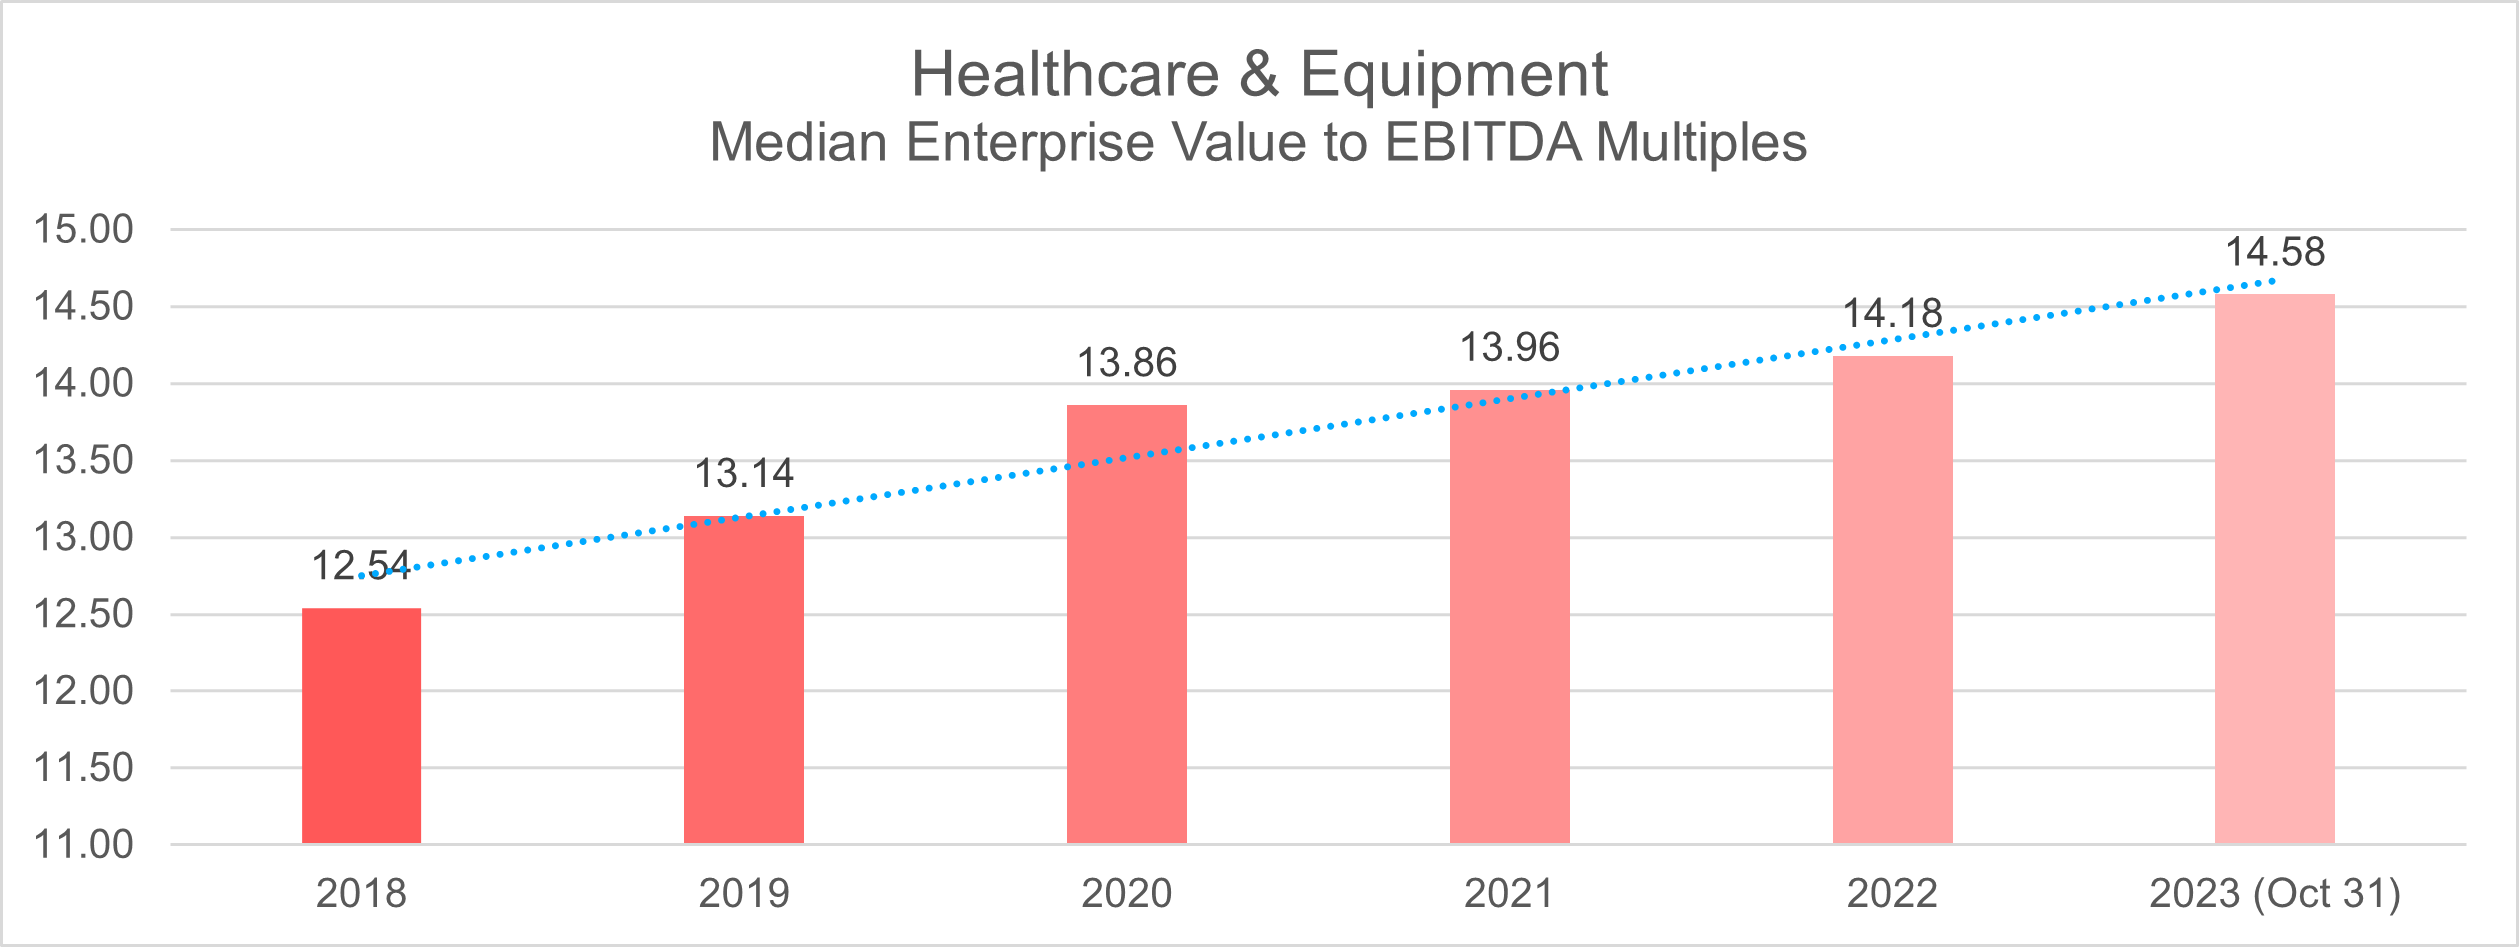
Between 2018 and 2019, the Healthcare Equipment & Supplies sector demonstrated a median deal multiple of 13, as measured by the Enterprise Value to EBITDA (EV/EBITDA) metric.
Amidst the challenges posed by the pandemic from 2020 to 2021, the industry experienced a modest uptick in the median deal multiple, ranging between 13.8 and 13.9, respectively.
The trend of increasing deal multiples persisted into the post-pandemic years, notably in 2022 when the metric climbed to 14. As of October 2023, the Healthcare Equipment & Supplies sector’s deal multiple further advanced to 14.6. This continued uptrend indicates sustained investor interest and the perceived value of companies within the sector.
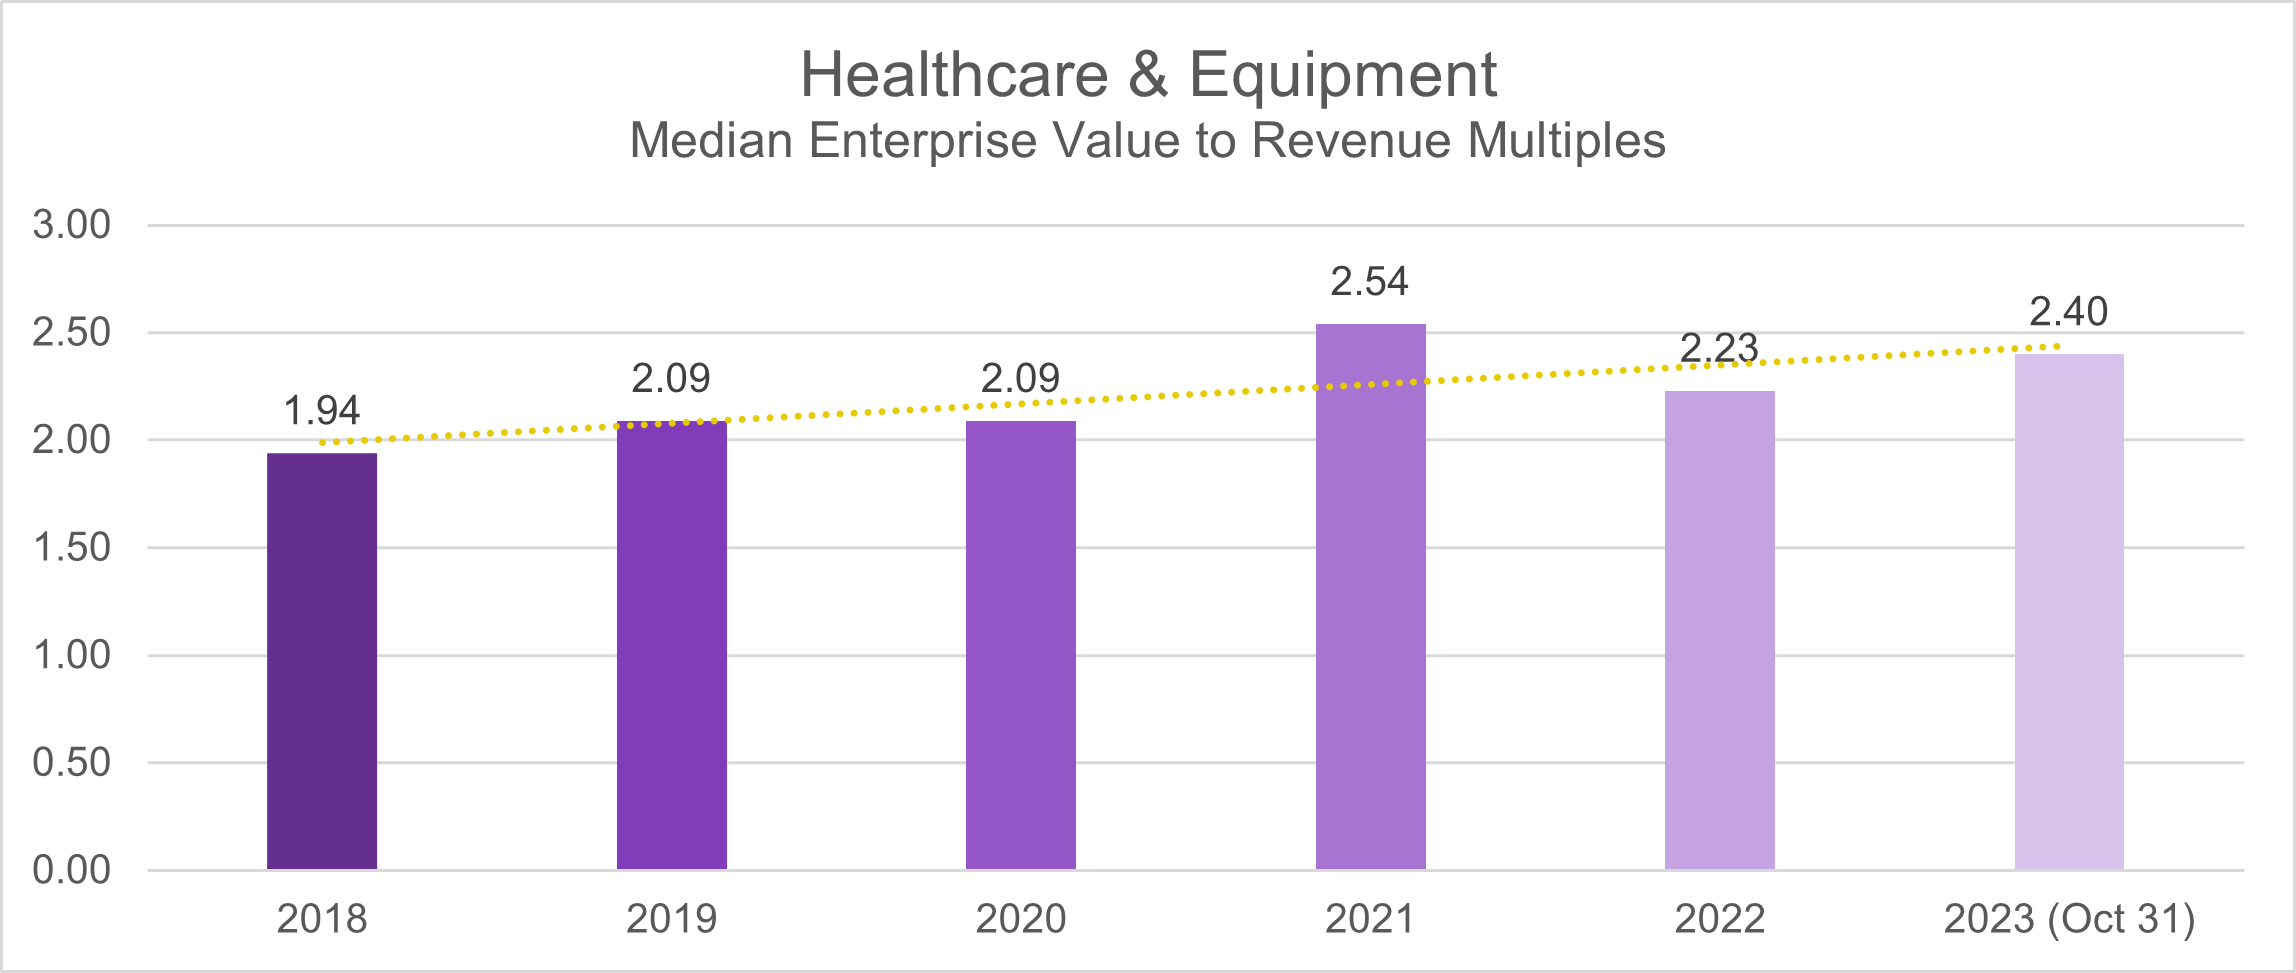
During the period spanning from 2018 to the onset of the pandemic in 2020, the Healthcare Equipment & Supplies sector consistently maintained median deal multiples within the range of 1.9 to 2.1. However, a notable shift occurred in 2021, witnessing a surge in deal multiples to 2.54.
Remarkably, even amid the post-pandemic recovery, the sector demonstrated resilience by sustaining median deal multiples around the 2 mark. As of October 2023, the median deal multiple has further evolved, reaching 2.4.
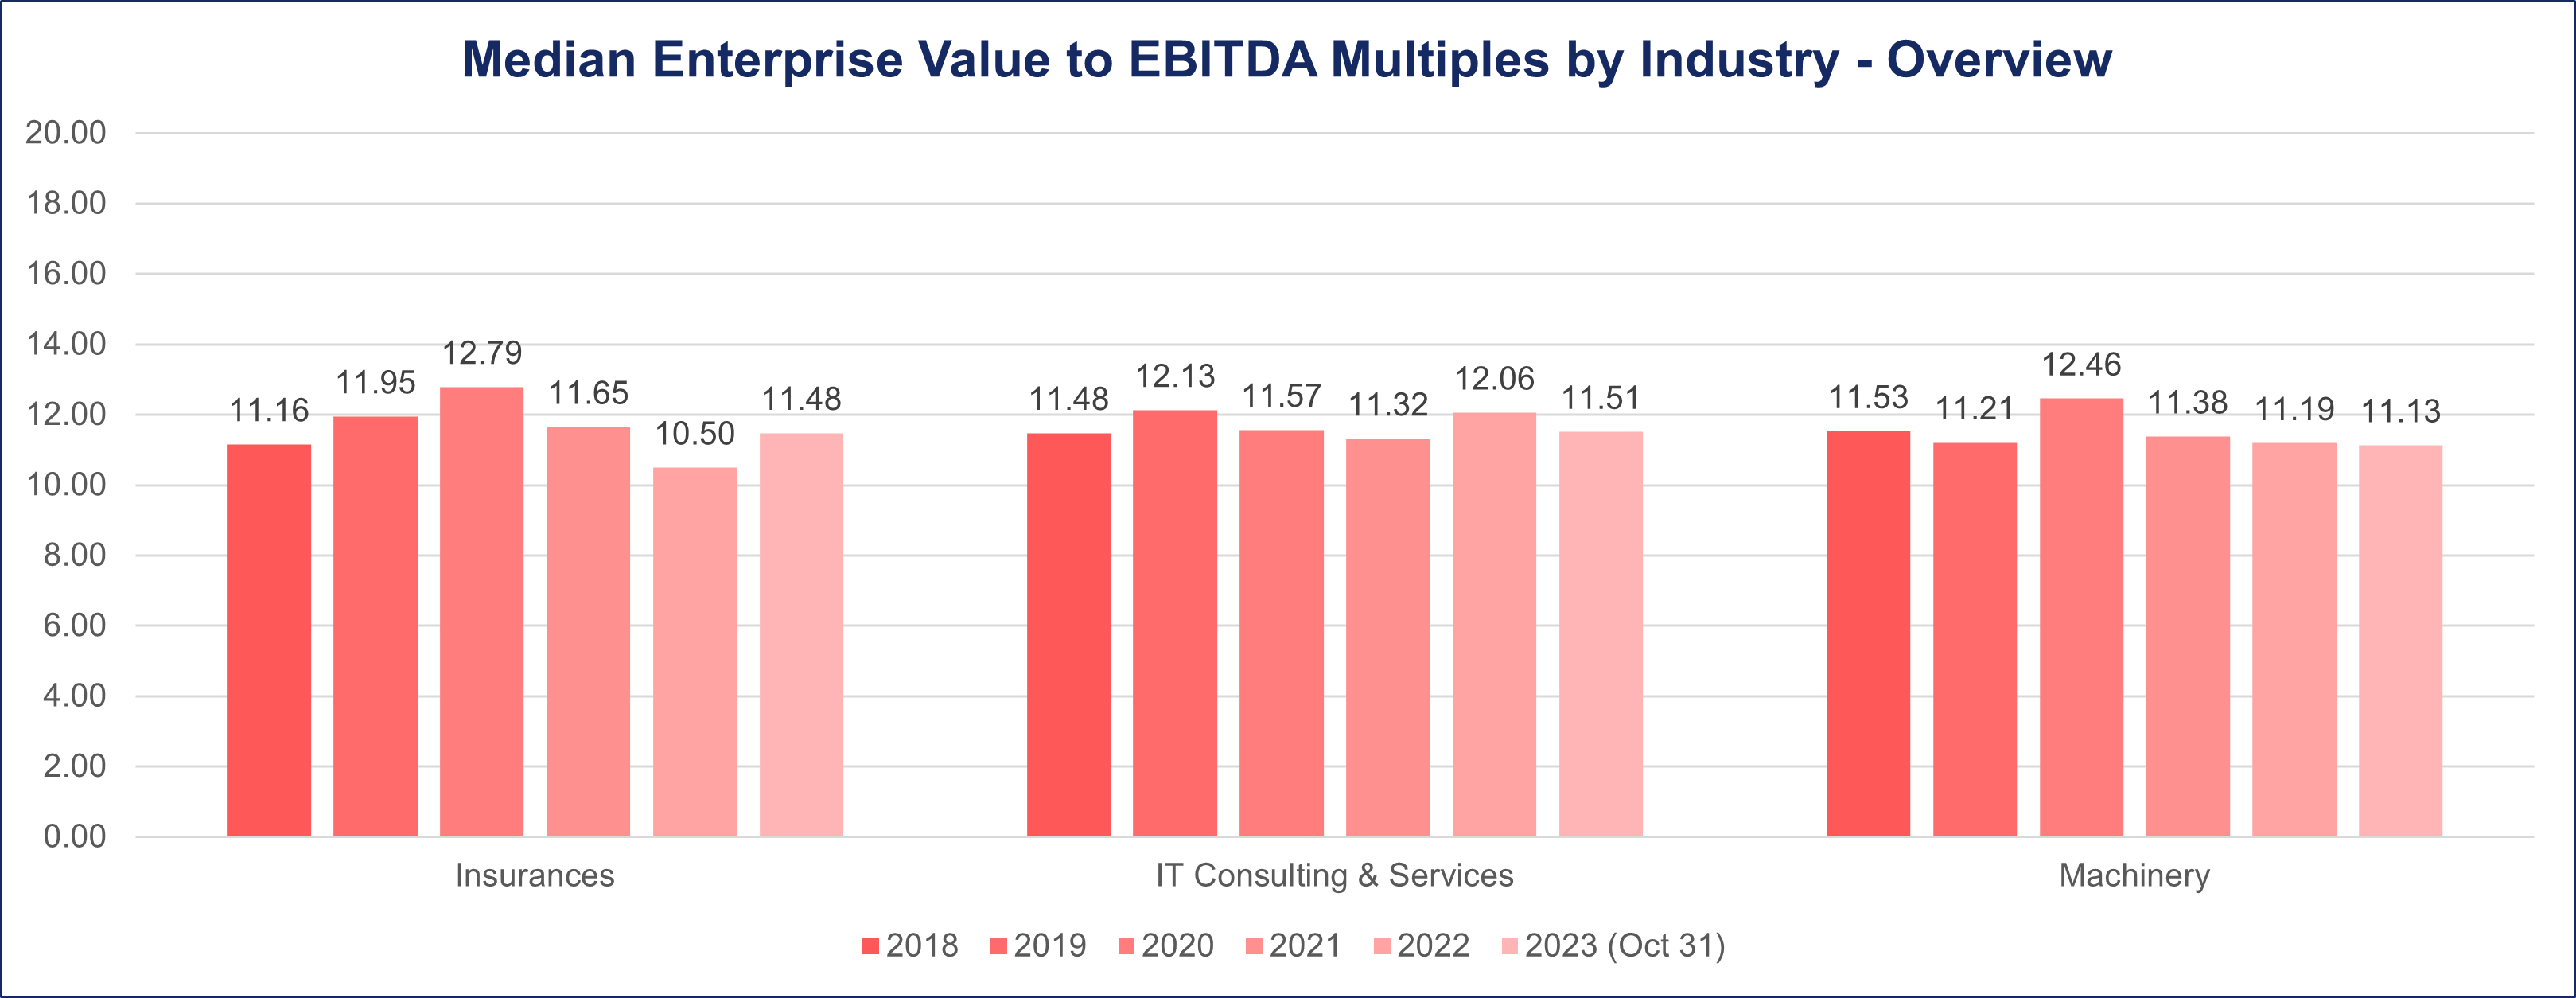
Insurances
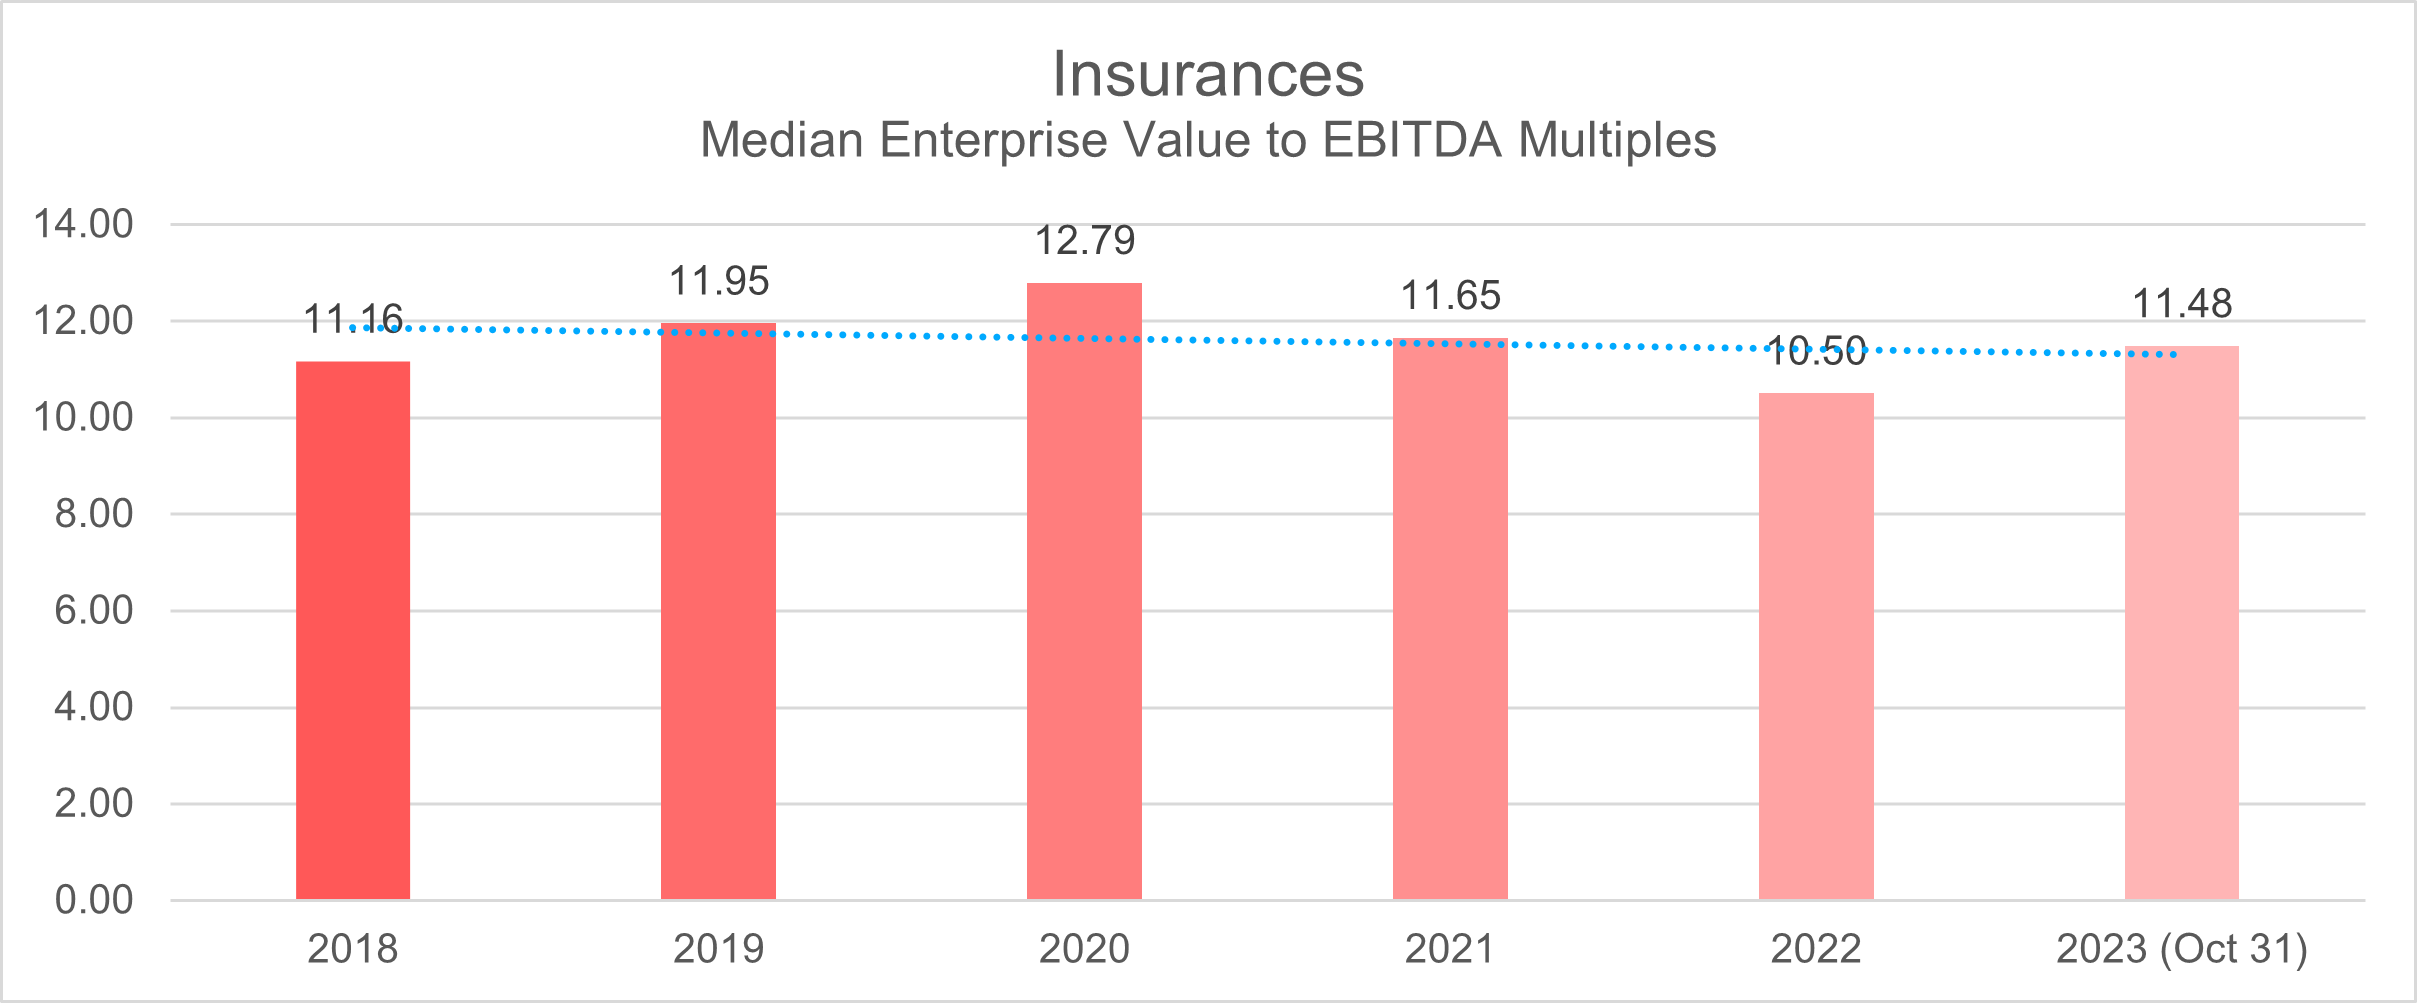
Between 2018 and 2019, the Insurance Industry consistently maintained a stable median deal multiple, ranging from 11 to 11.95, as evaluated through the Enterprise Value to EBITDA (EV to EBITDA) metric.
The onset of the pandemic brought about a notable shift in this trend. In 2020, the industry witnessed an uptick in the median deal multiple, reaching 12.8, only to subsequently decrease to 11.6 in 2021.
However, the post-pandemic years, specifically 2022, witnessed a significant decrease as the median deal multiple for the Insurance sector dropped to 10.5. As of October 2023, the recorded deal multiple for the industry rebounded slightly to 11.5, indicating a potential stabilization or recovery.
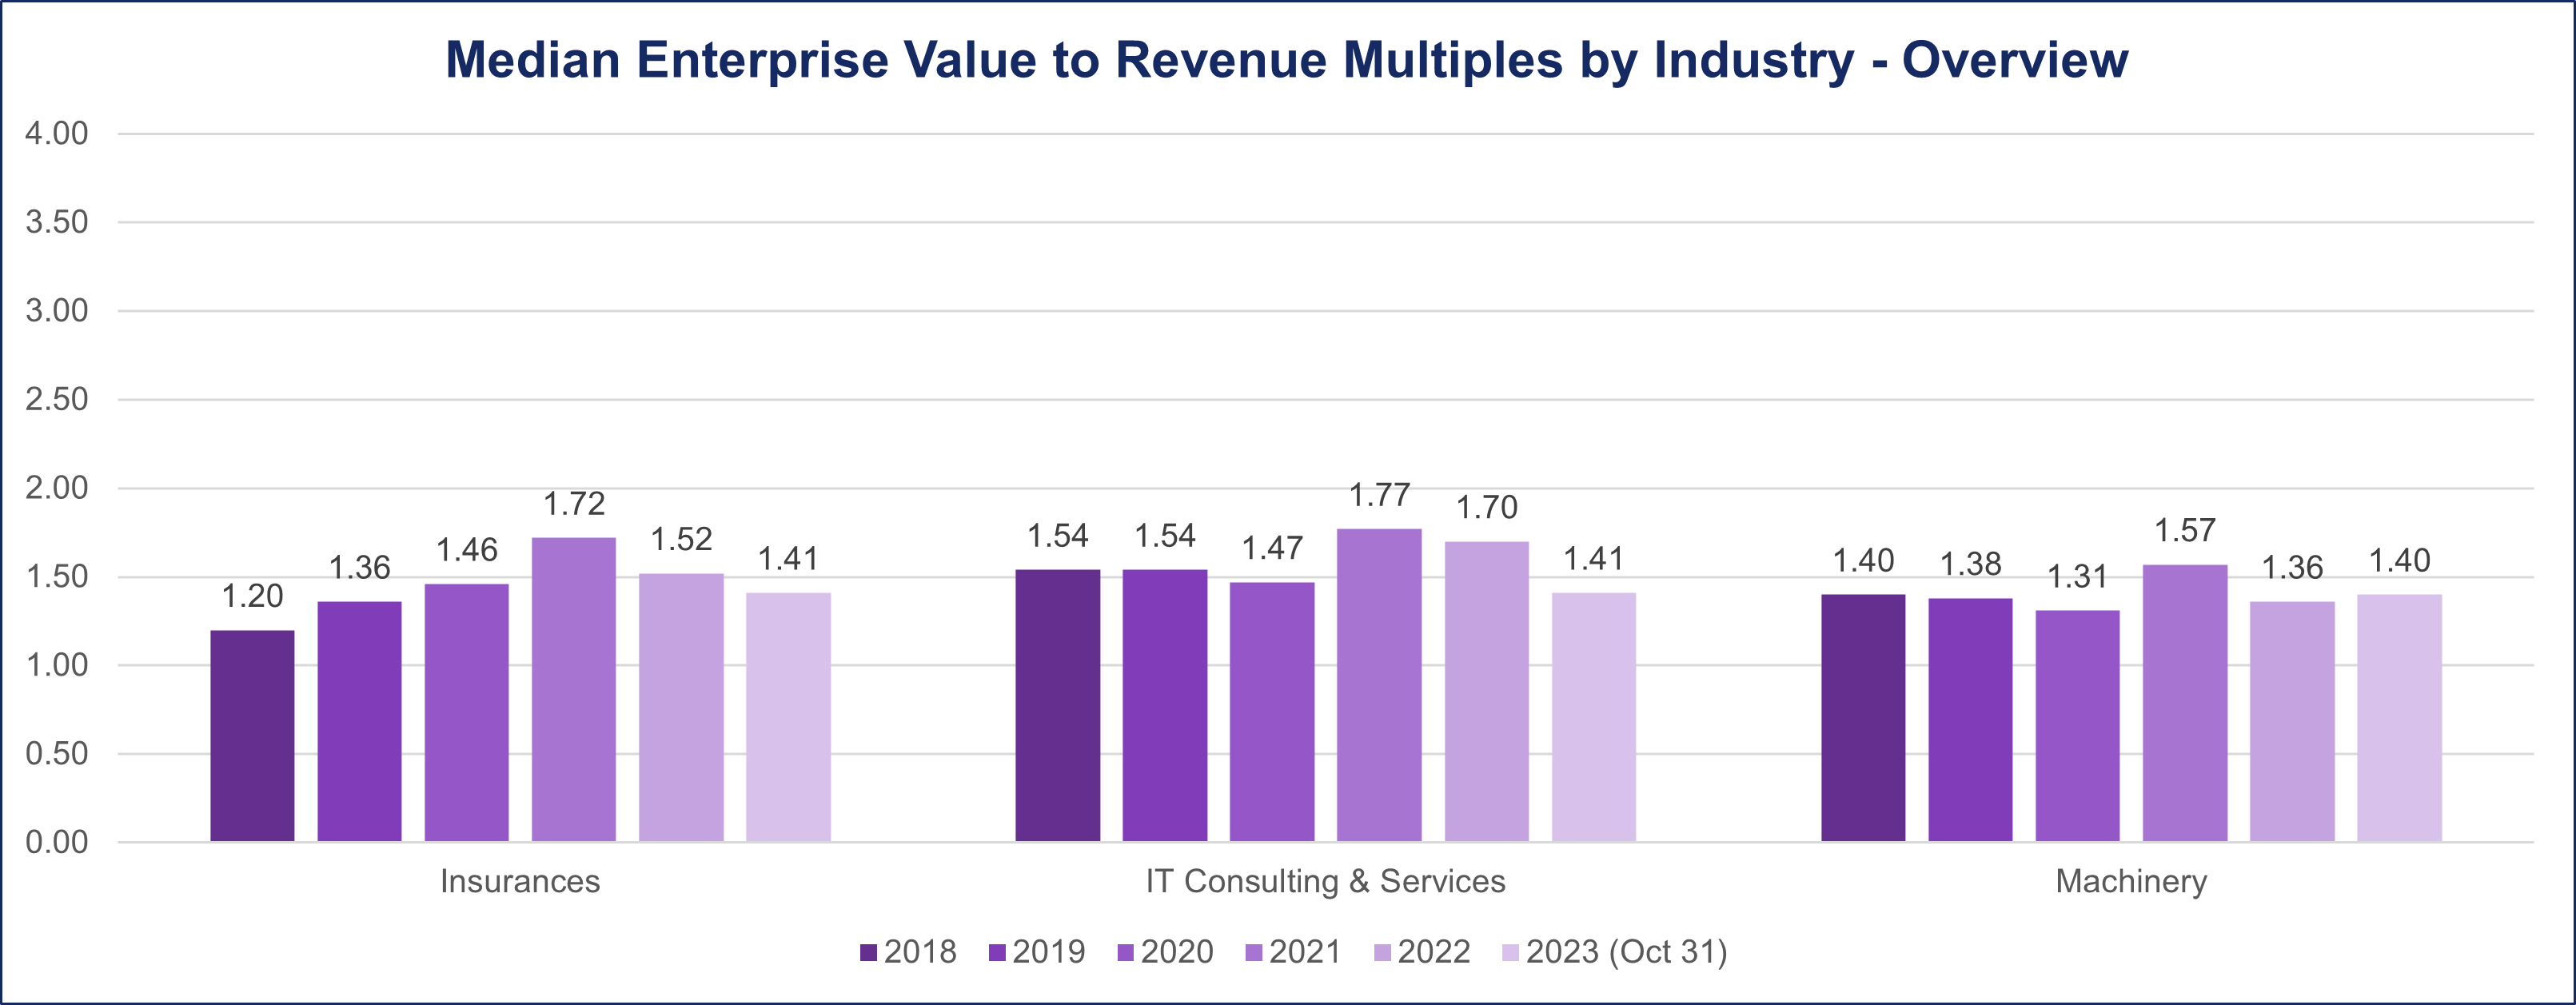
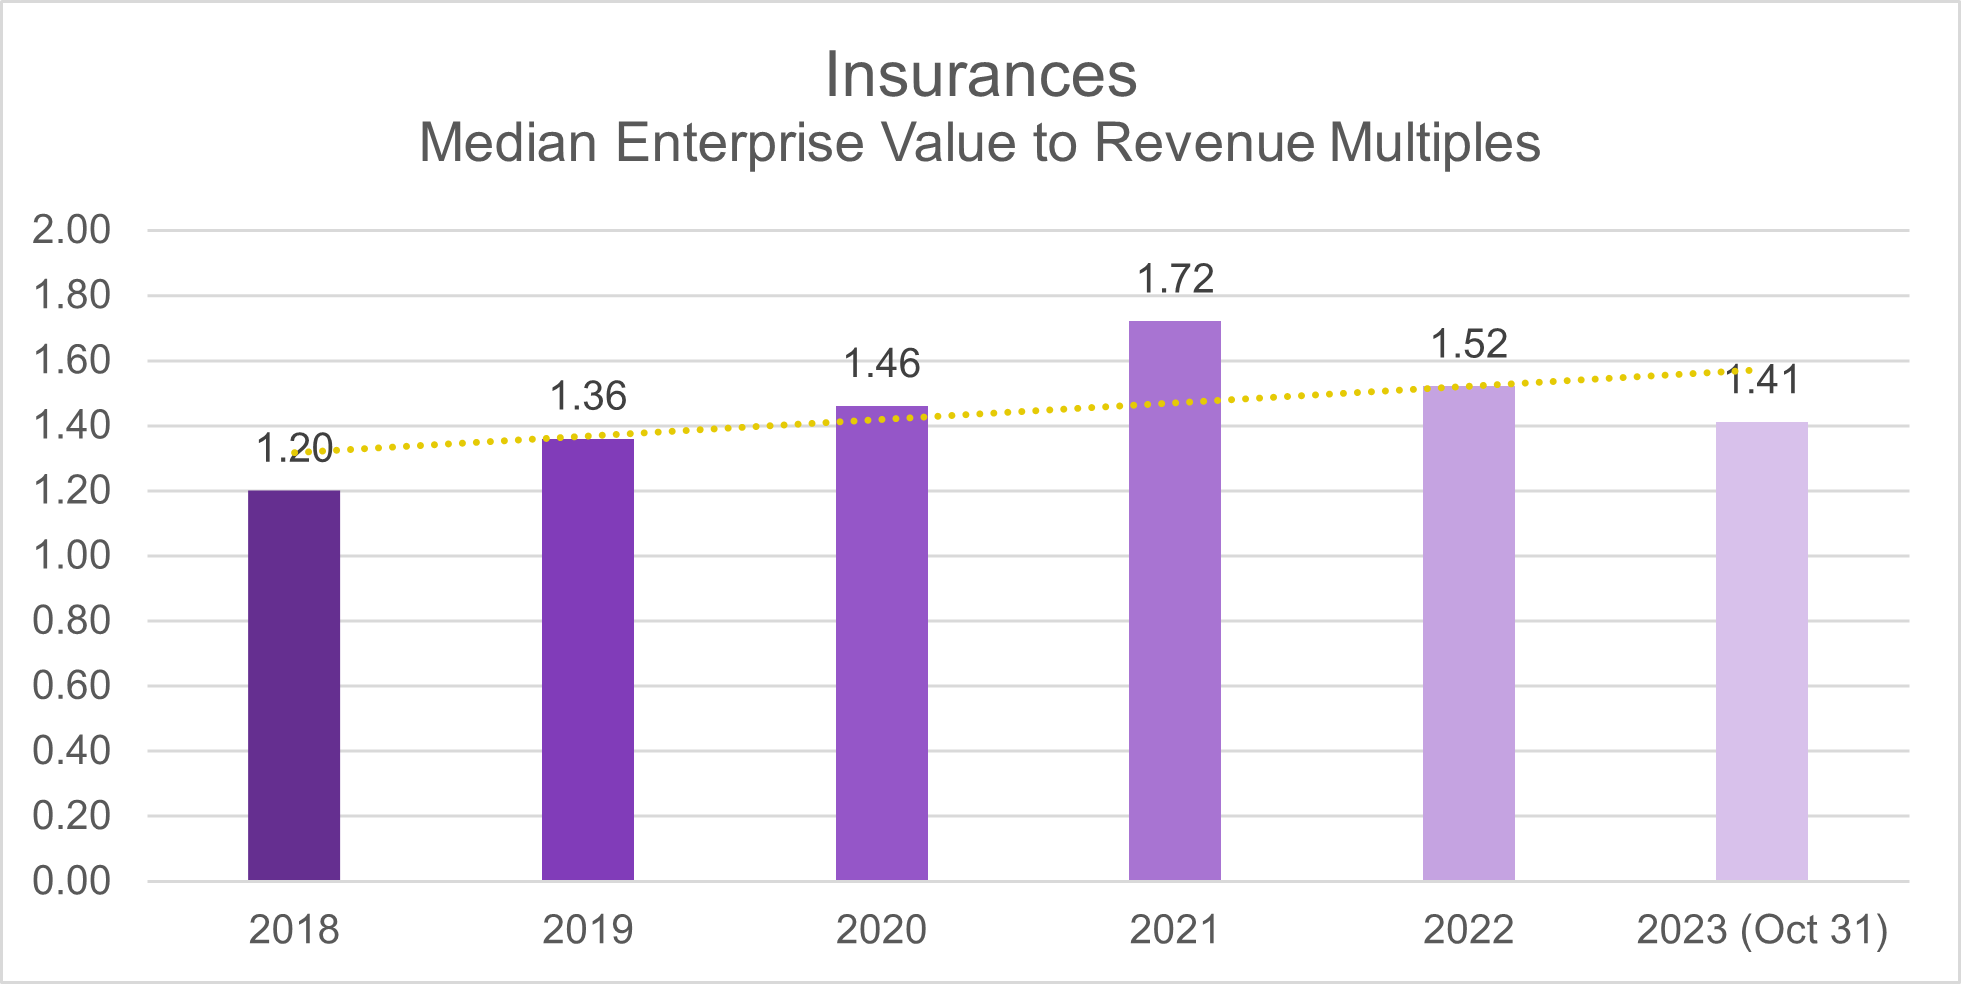
Over the past five years, the Insurance Sector has exhibited a noteworthy trend in its median deal multiple, showcasing a resilient ascent from 1.2 in 2018 to a peak of 1.7 in 2021, even amid the challenges posed by the pandemic (2020-2021). However, a subtle adjustment occurred in 2022, with the median deal multiple regressing to 1.5, and by October 2023, it further moderated to 1.4.
IT Consulting & Services
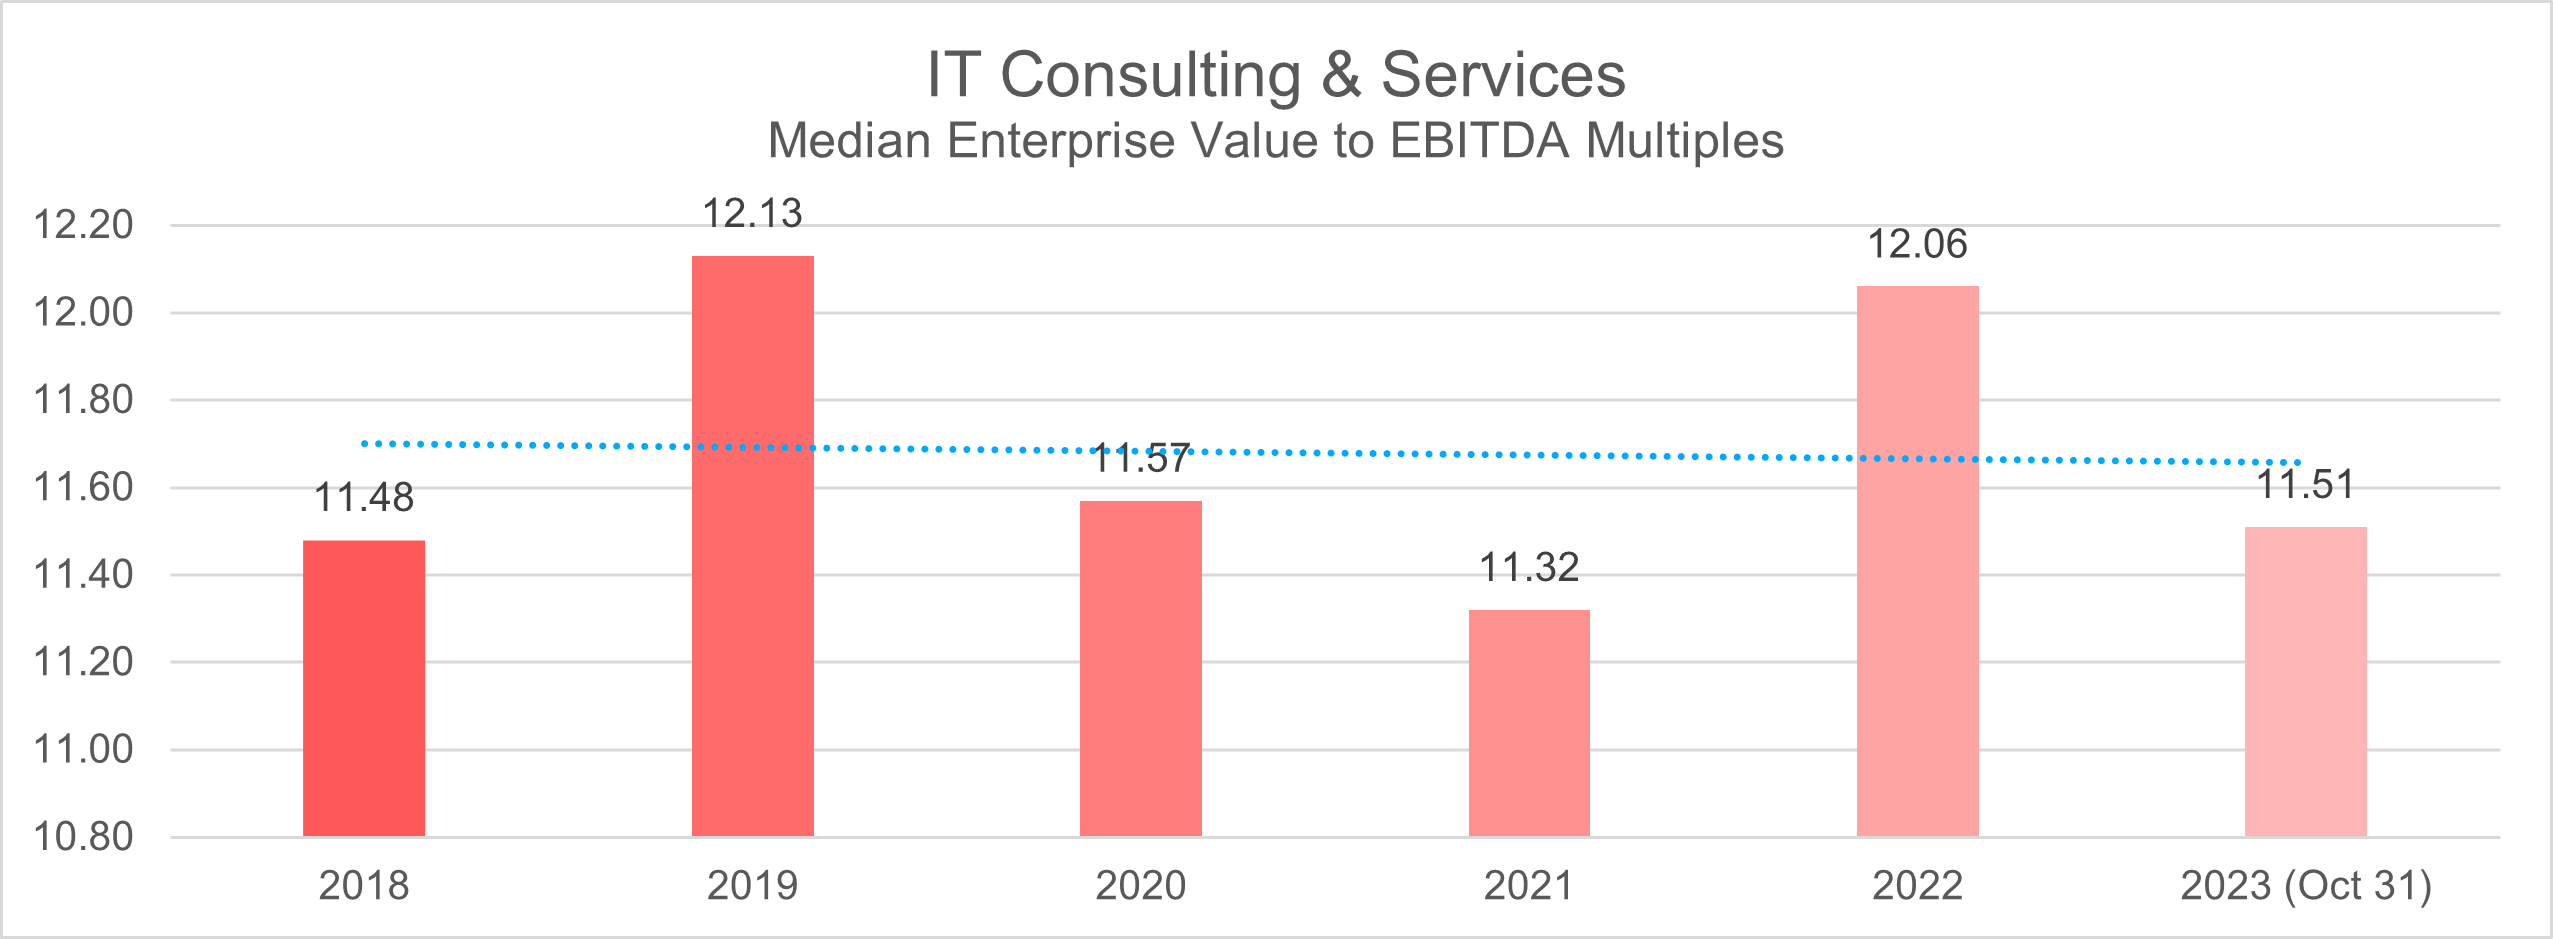
In the pre-pandemic years of 2018 and 2019, the IT Consulting & Services Industry had median deal multiples of 11.5 and 12.1, respectively, based on the (EV/EBITDA) ratio.
During the pandemic, spanning from 2020 to 2021, the industry experienced a slight contraction in deal multiples, with figures dipping to 11.6 and 11.3.
In a notable shift, 2022 witnessed a resurgence as the median deal multiples for the IT Consulting and Services sector increased to 12. However, as of October 2023, there was a slight moderation, with deal multiples settling at 11.5.
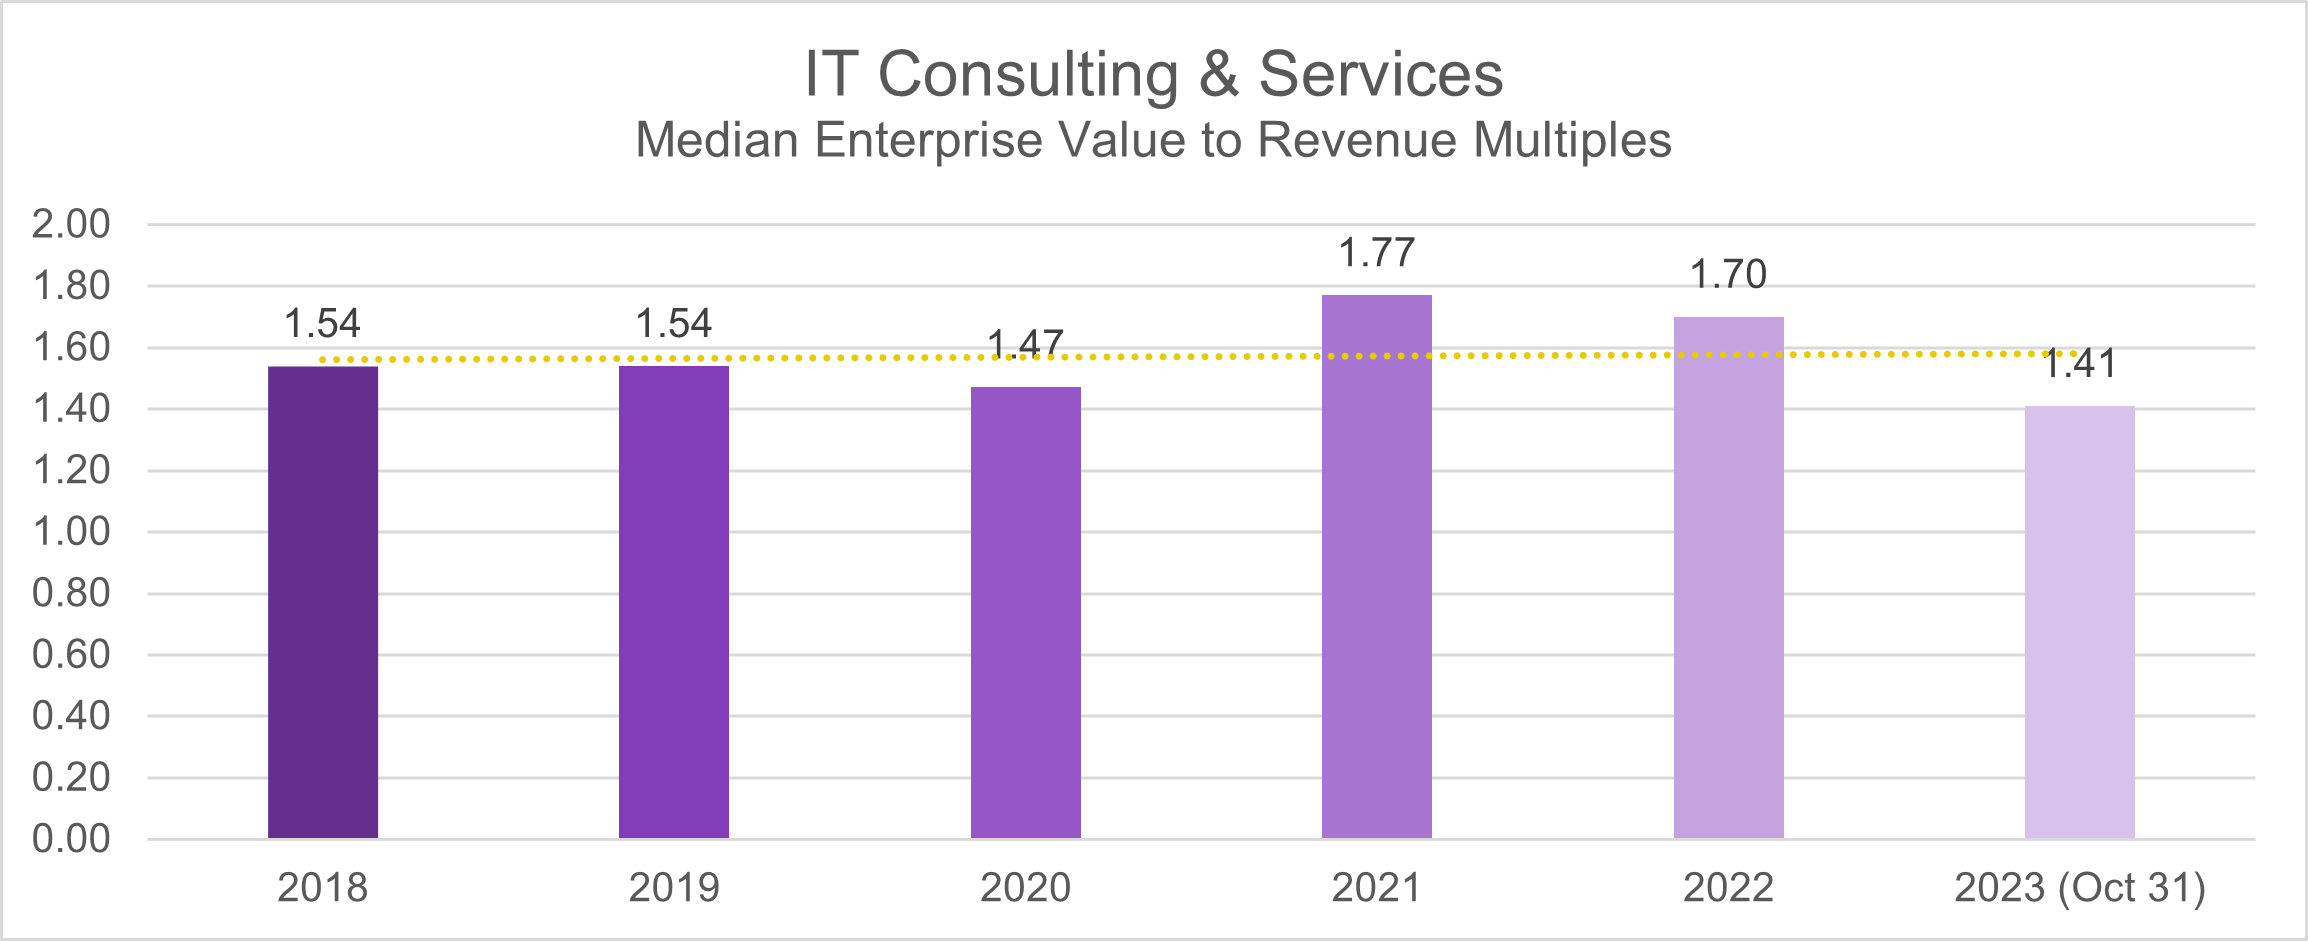
Examining the EV/Revenue metric within the IT Consulting & Services sector reveals notable trends in deal multiples. In the pre-pandemic phase of 2018-2019, the median deal multiple stood at 1.5. During the pandemic era (2020-2021), a modest increase was observed, reaching 1.8. Post-pandemic, the industry showcased stability, with deal multiples settling at 1.7 in 2022 and adjusting to 1.4 as of October 2023. This measured fluctuation indicates the sector’s adaptability and resilience in response to market conditions.
Machinery
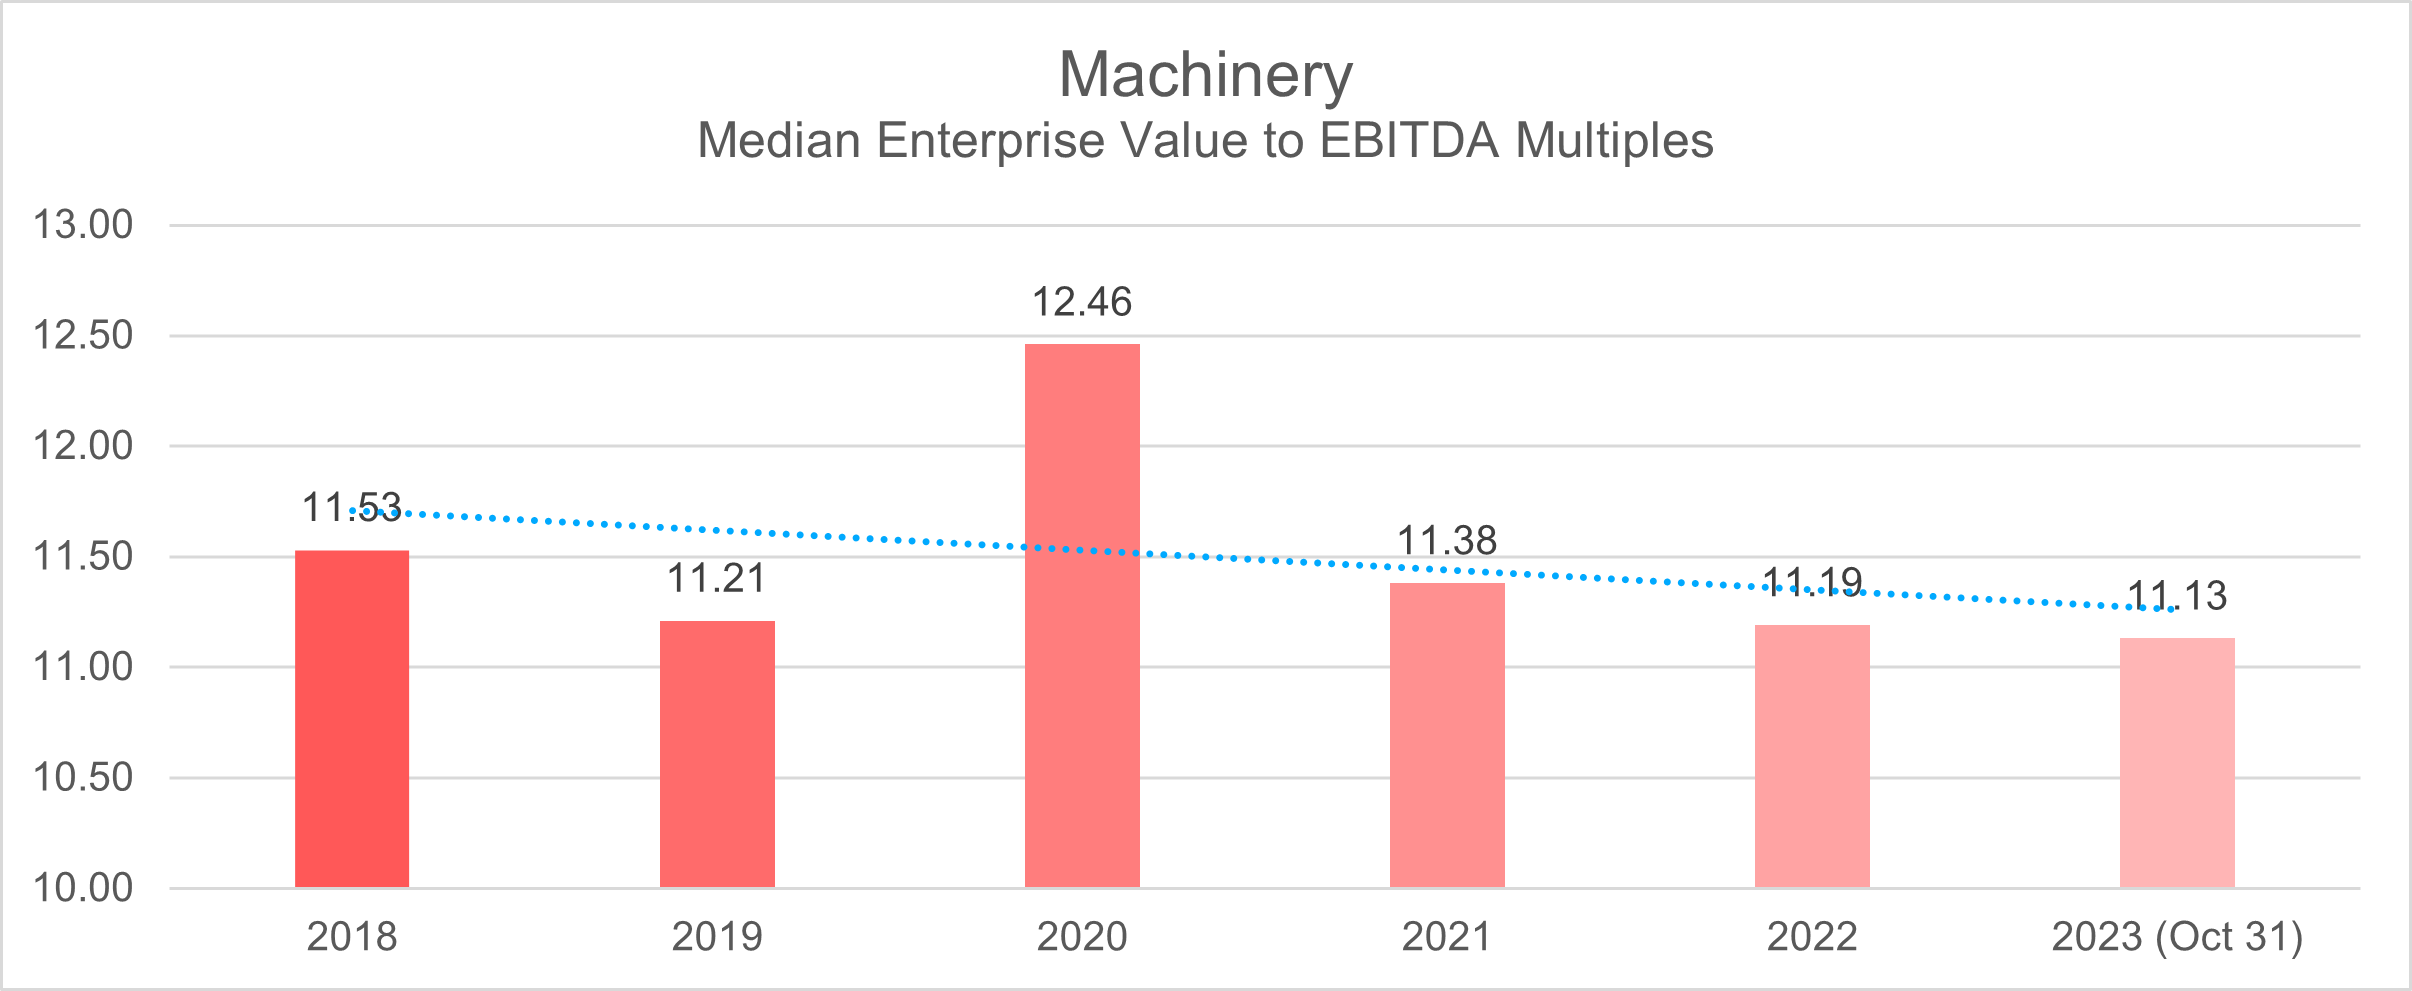
During the period spanning 2018 to 2019, the Machinery Industry demonstrated a relatively stable median deal multiple, fluctuating within the range of 11.2 to 11.5, as measured by the enterprise value to EBITDA (EV/EBITDA) metric.
Amidst the pandemic in 2020, there was a noticeable increase in median deal multiples, rising to 12.5. However, a correction ensued in 2021, with the median deal multiple dropping to 11.4.
This trend persisted into the post-pandemic landscape of 2022, marked by a continued reduction in median deal multiples, settling at 11.2. The same downward trajectory carried over into October 2023, reflecting an enduring period of adjustment within the industry’s deal landscape, underscored by a median deal multiple of 11.1.
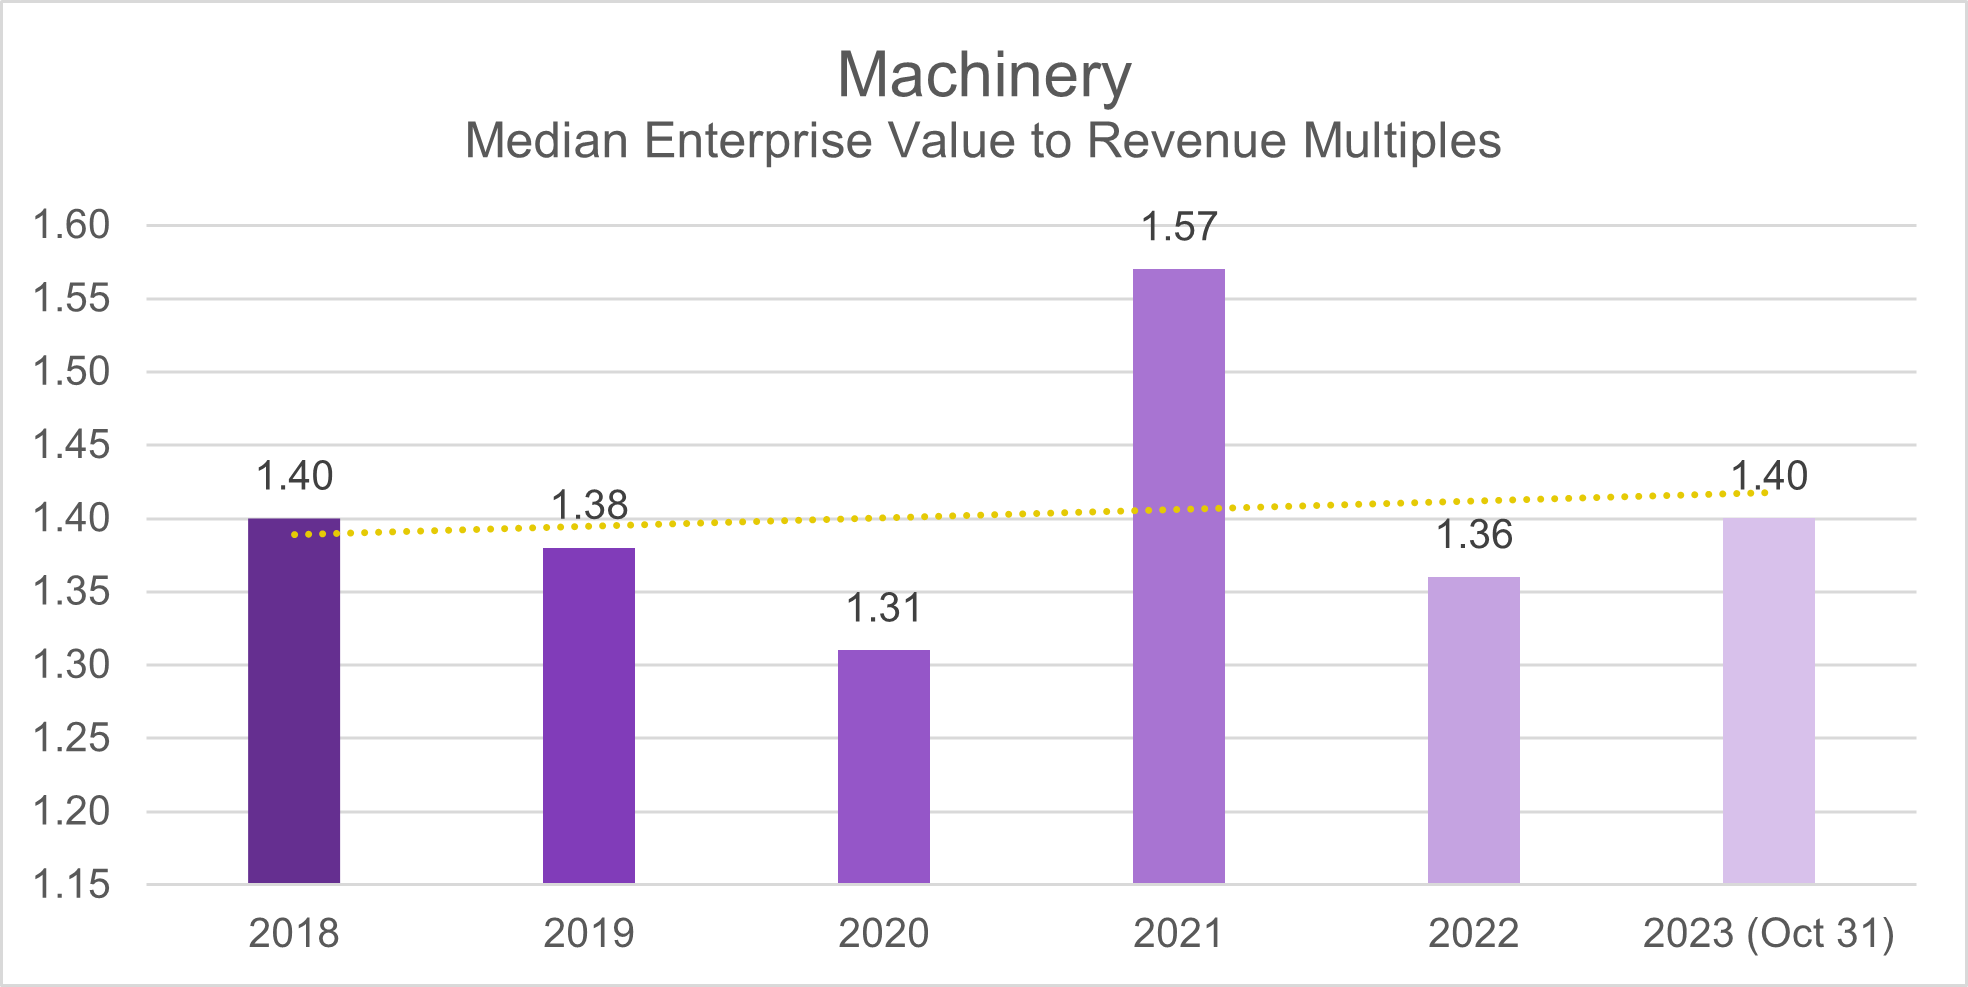
From 2018 through October 2023, the Machinery Sector has demonstrated notable consistency in its EV/Revenue multiple ratios. Throughout this period, the deal multiples have consistently hovered within the range of 1.3 to 1.6. Notably, the lowest recorded multiple occurred at the onset of the pandemic, reflecting the sector’s resilience during challenging times. Conversely, the highest multiple was registered in 2021, indicating a robust performance even in the midst of the pandemic. Interestingly, despite the fluctuations, the median deal multiple median has remained constant 1.4, both in the pre-pandemic and post-pandemic periods.
Media & Entertainment
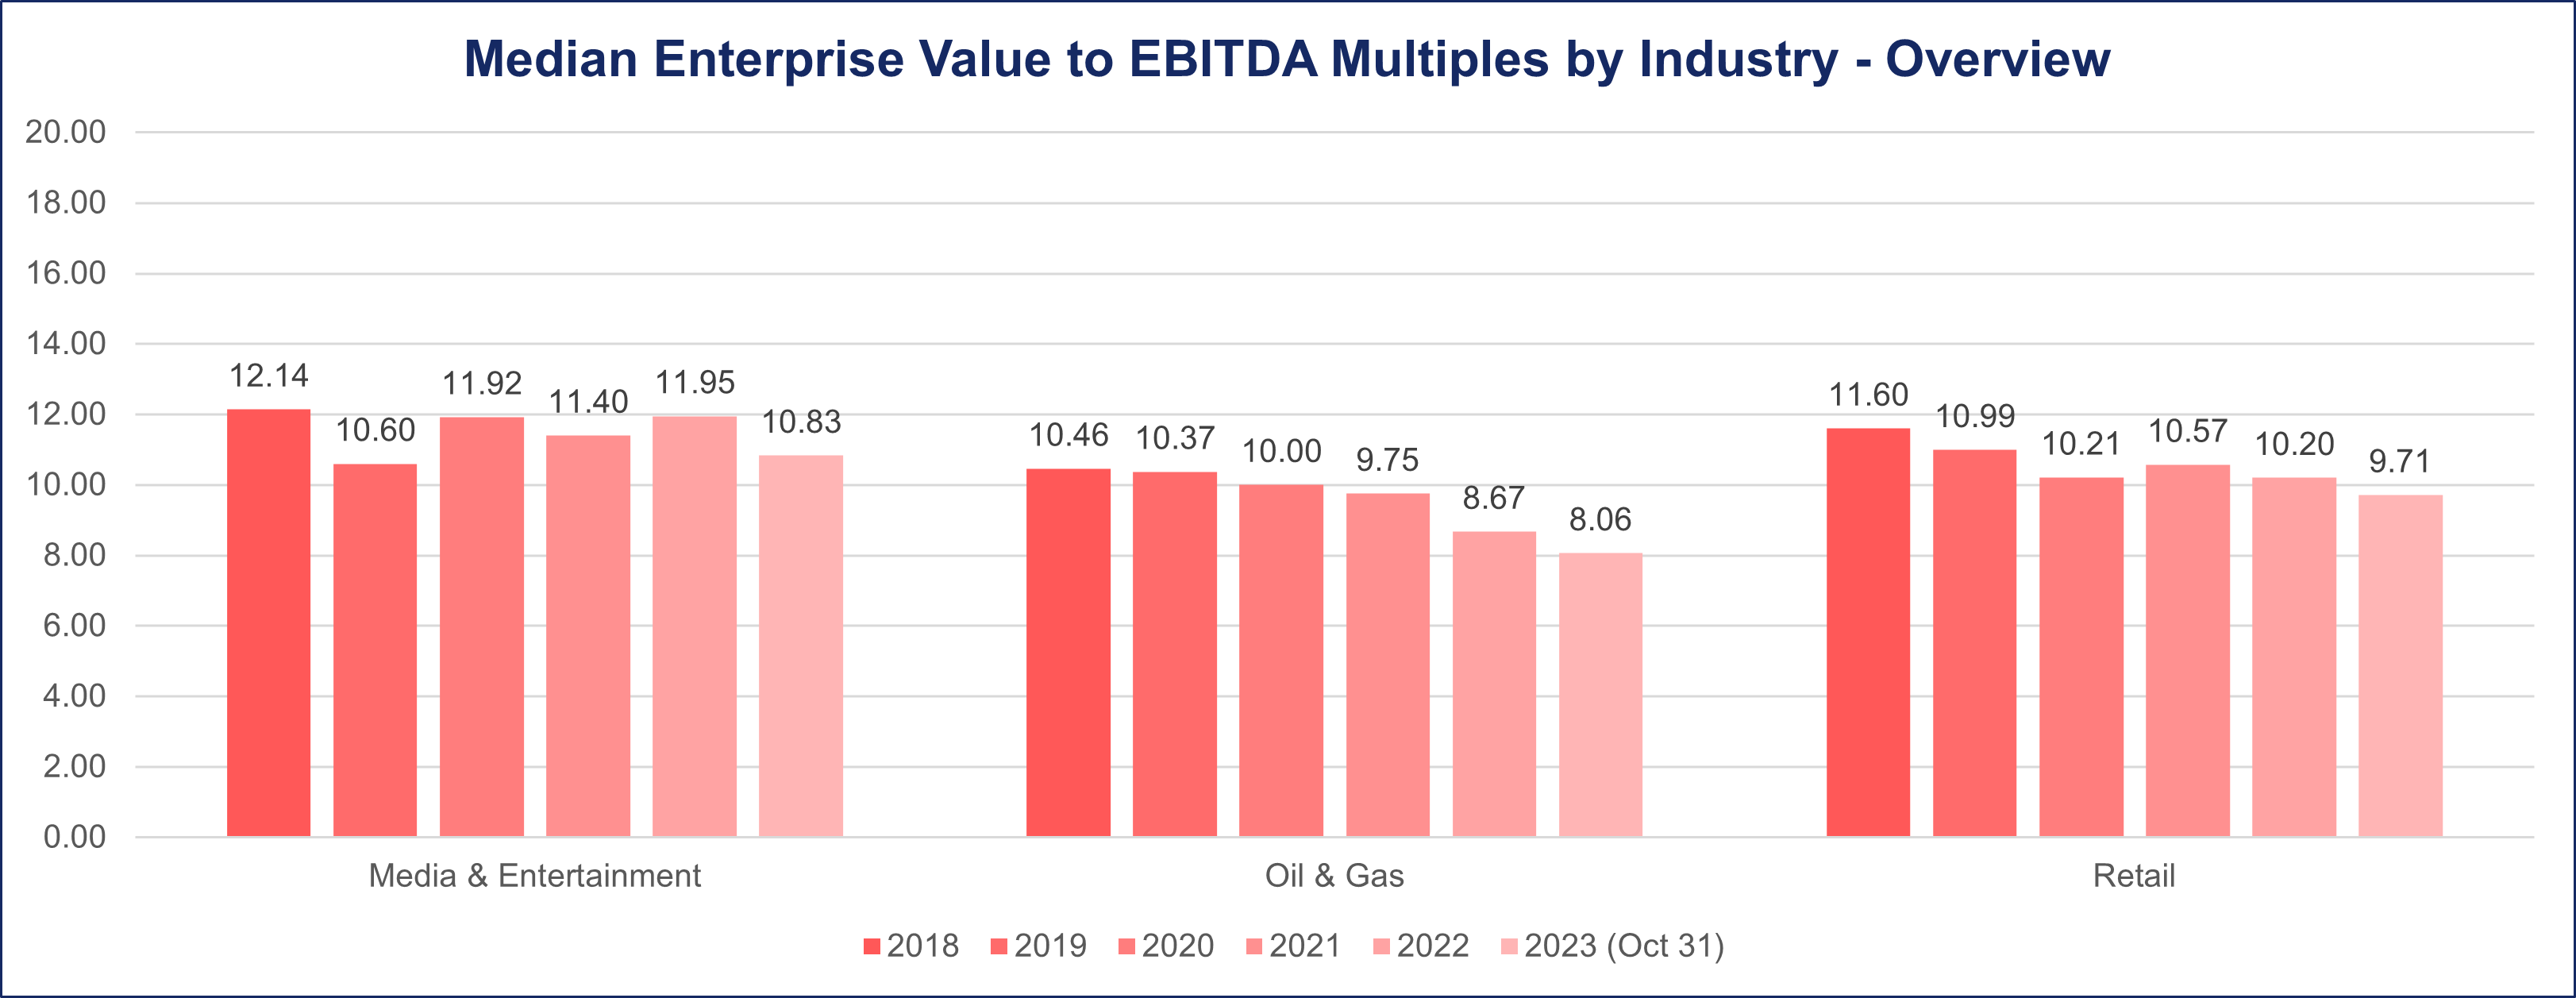
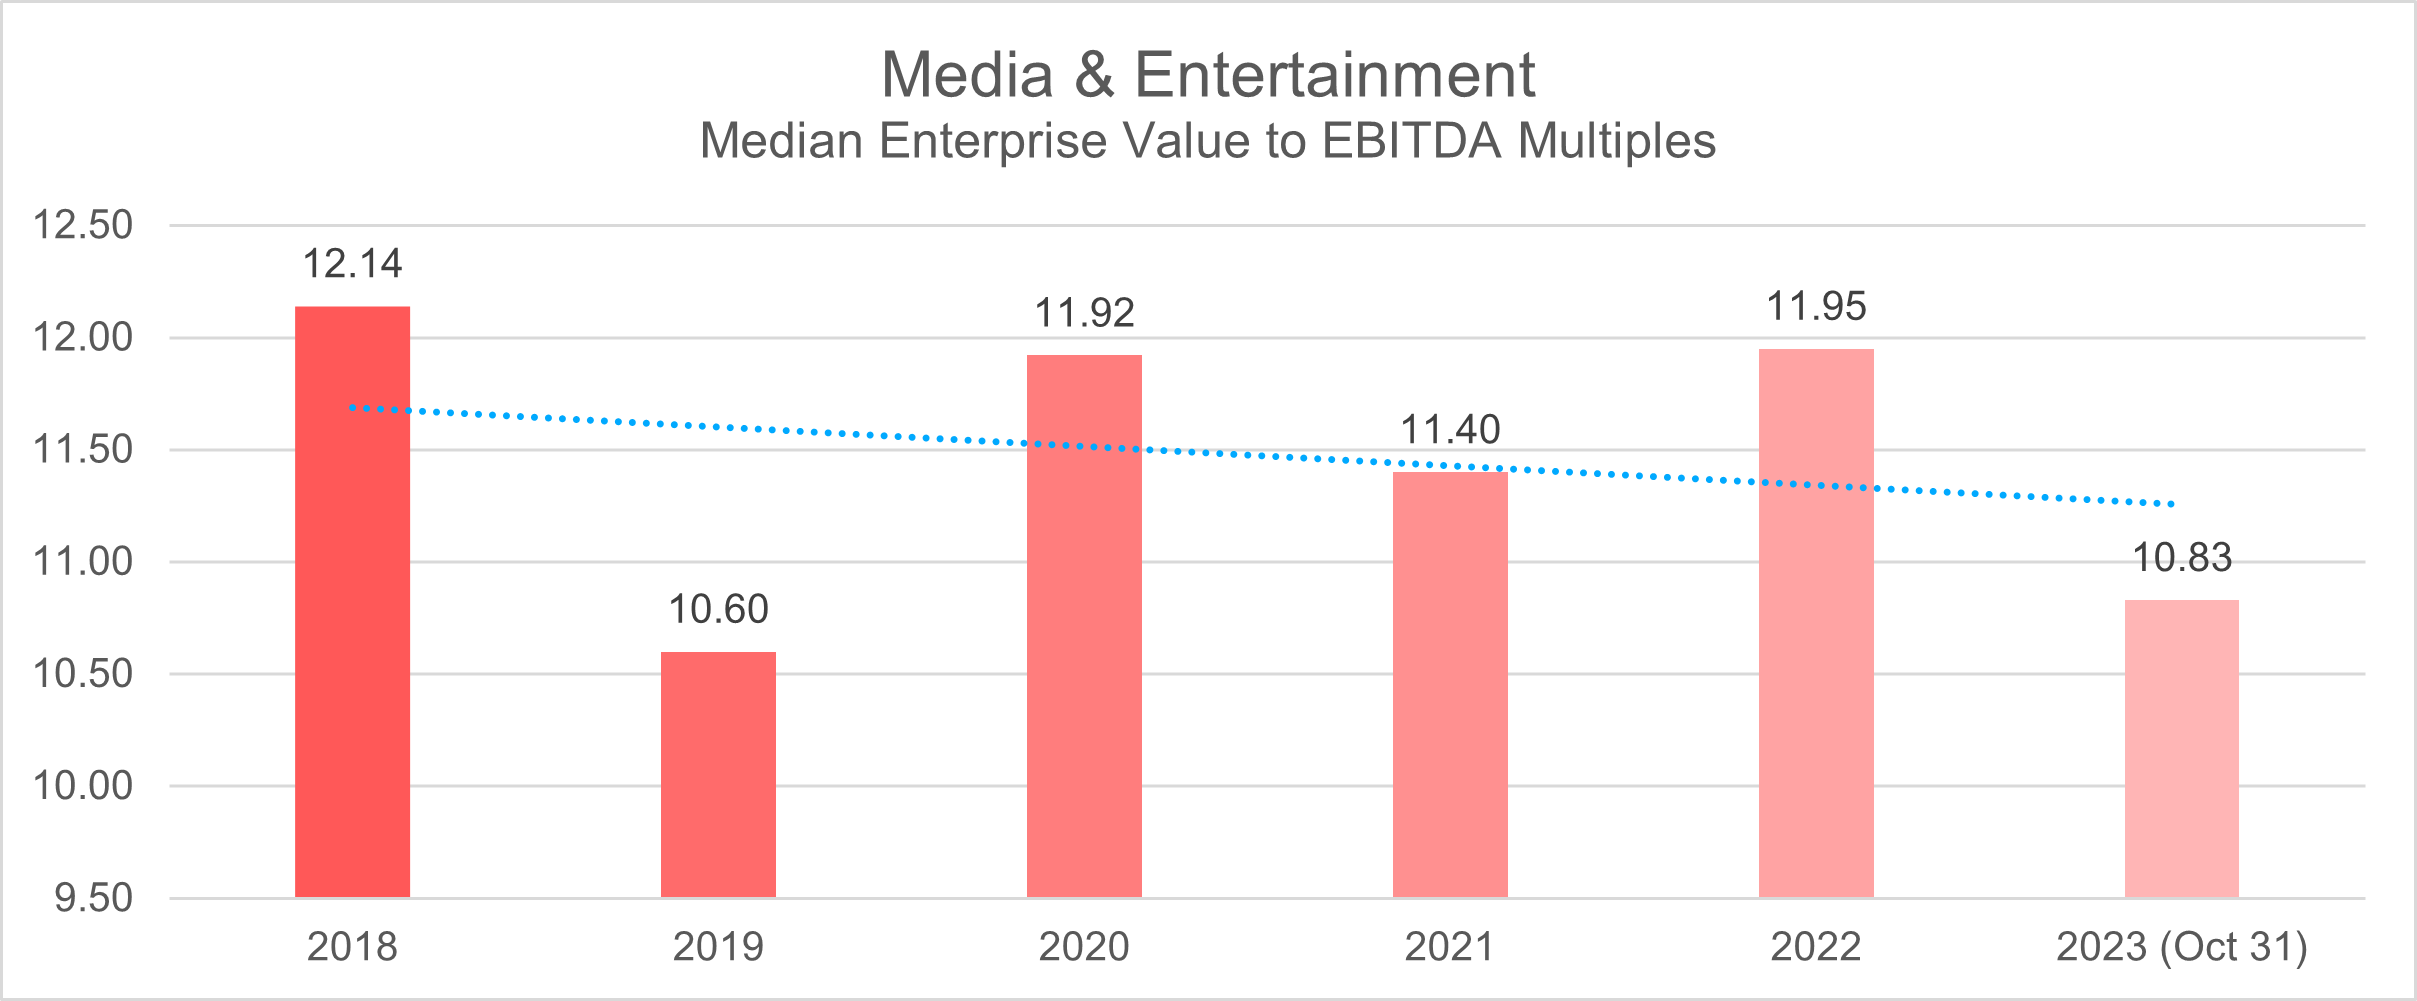
In 2018, the Media & Entertainment sector recorded a median deal multiple of 12.1, measured by the enterprise value to EBITDA (EV/EBITDA) metric. However, this figure experienced a slight decline to 10.6 in 2019.
Amid the challenges posed by the pandemic in 2020-2021, the sector saw an increase in deal multiples, reaching 11.9.
This trend persisted during the post-pandemic recovery in 2022, maintaining the deal multiple at 11.9. However, as of October 2023, there was a noticeable downturn, with the industry’s deal multiples dropping to 10.8.
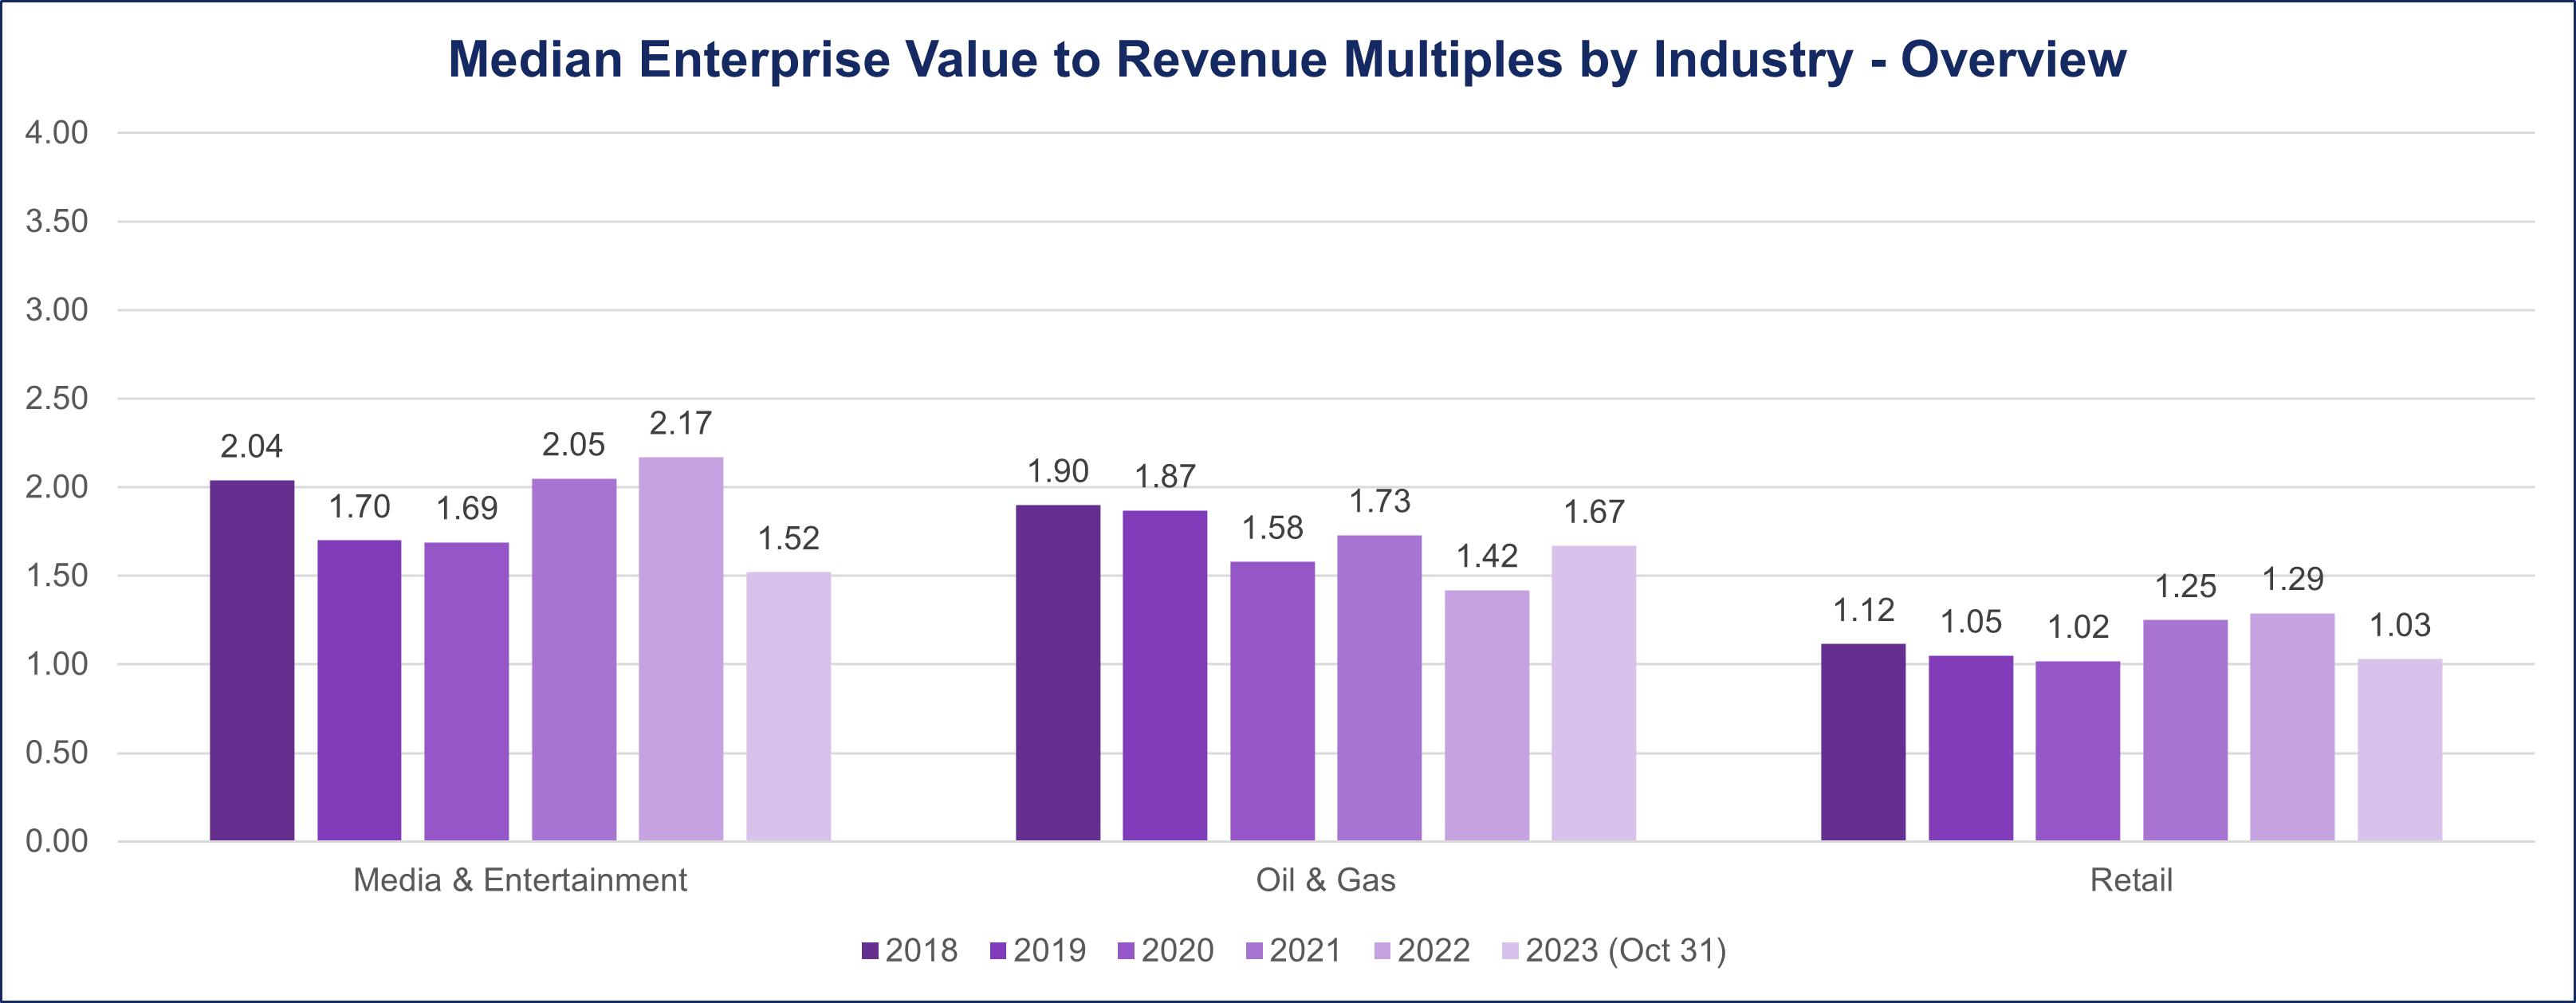
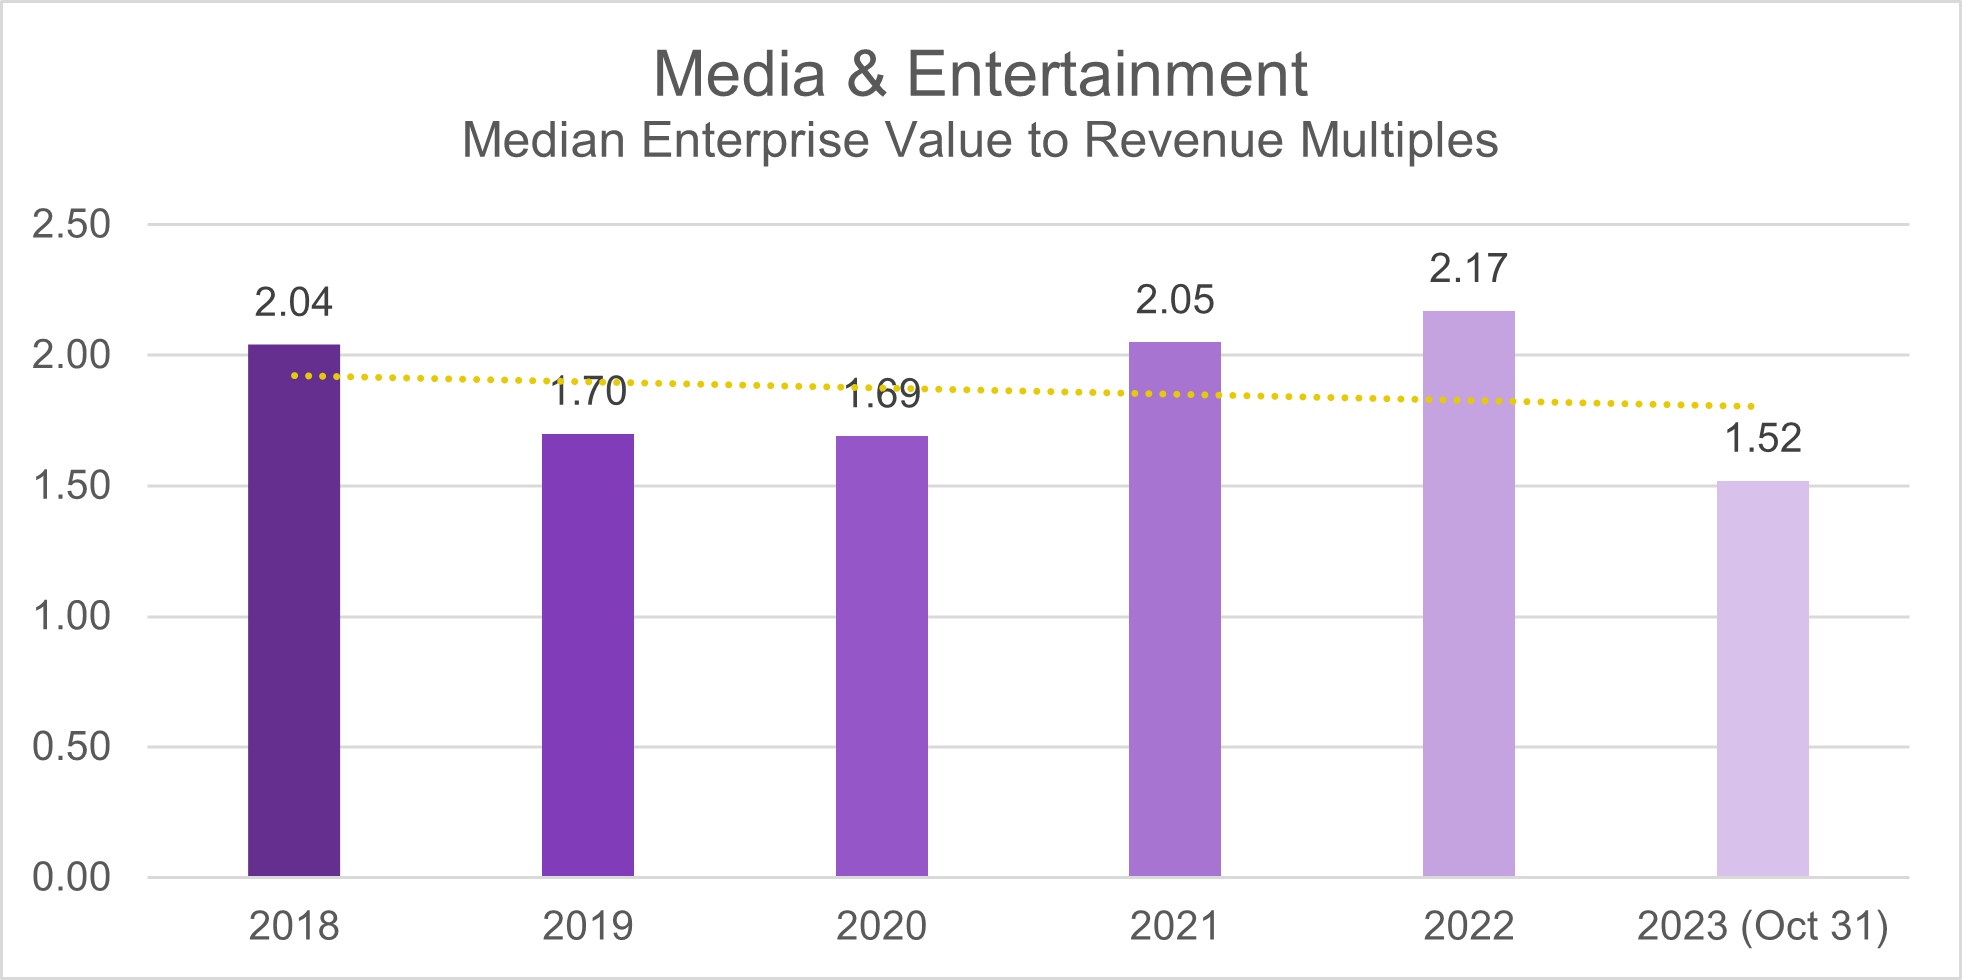
A similar trend is observed using EV/Revenue ratio. In 2018, the median deal multiple stood at 2, experiencing a marginal decline to 1.7 in 2019. Notably, as the pandemic unfolded in 2020, the ratio held steady before rebounding to pre-pandemic levels of 2 in 2021. The post-pandemic landscape of 2022 witnessed a further uptick, reaching 2.1, only to taper off to 1.5 by October 2023.
Oil & Gas
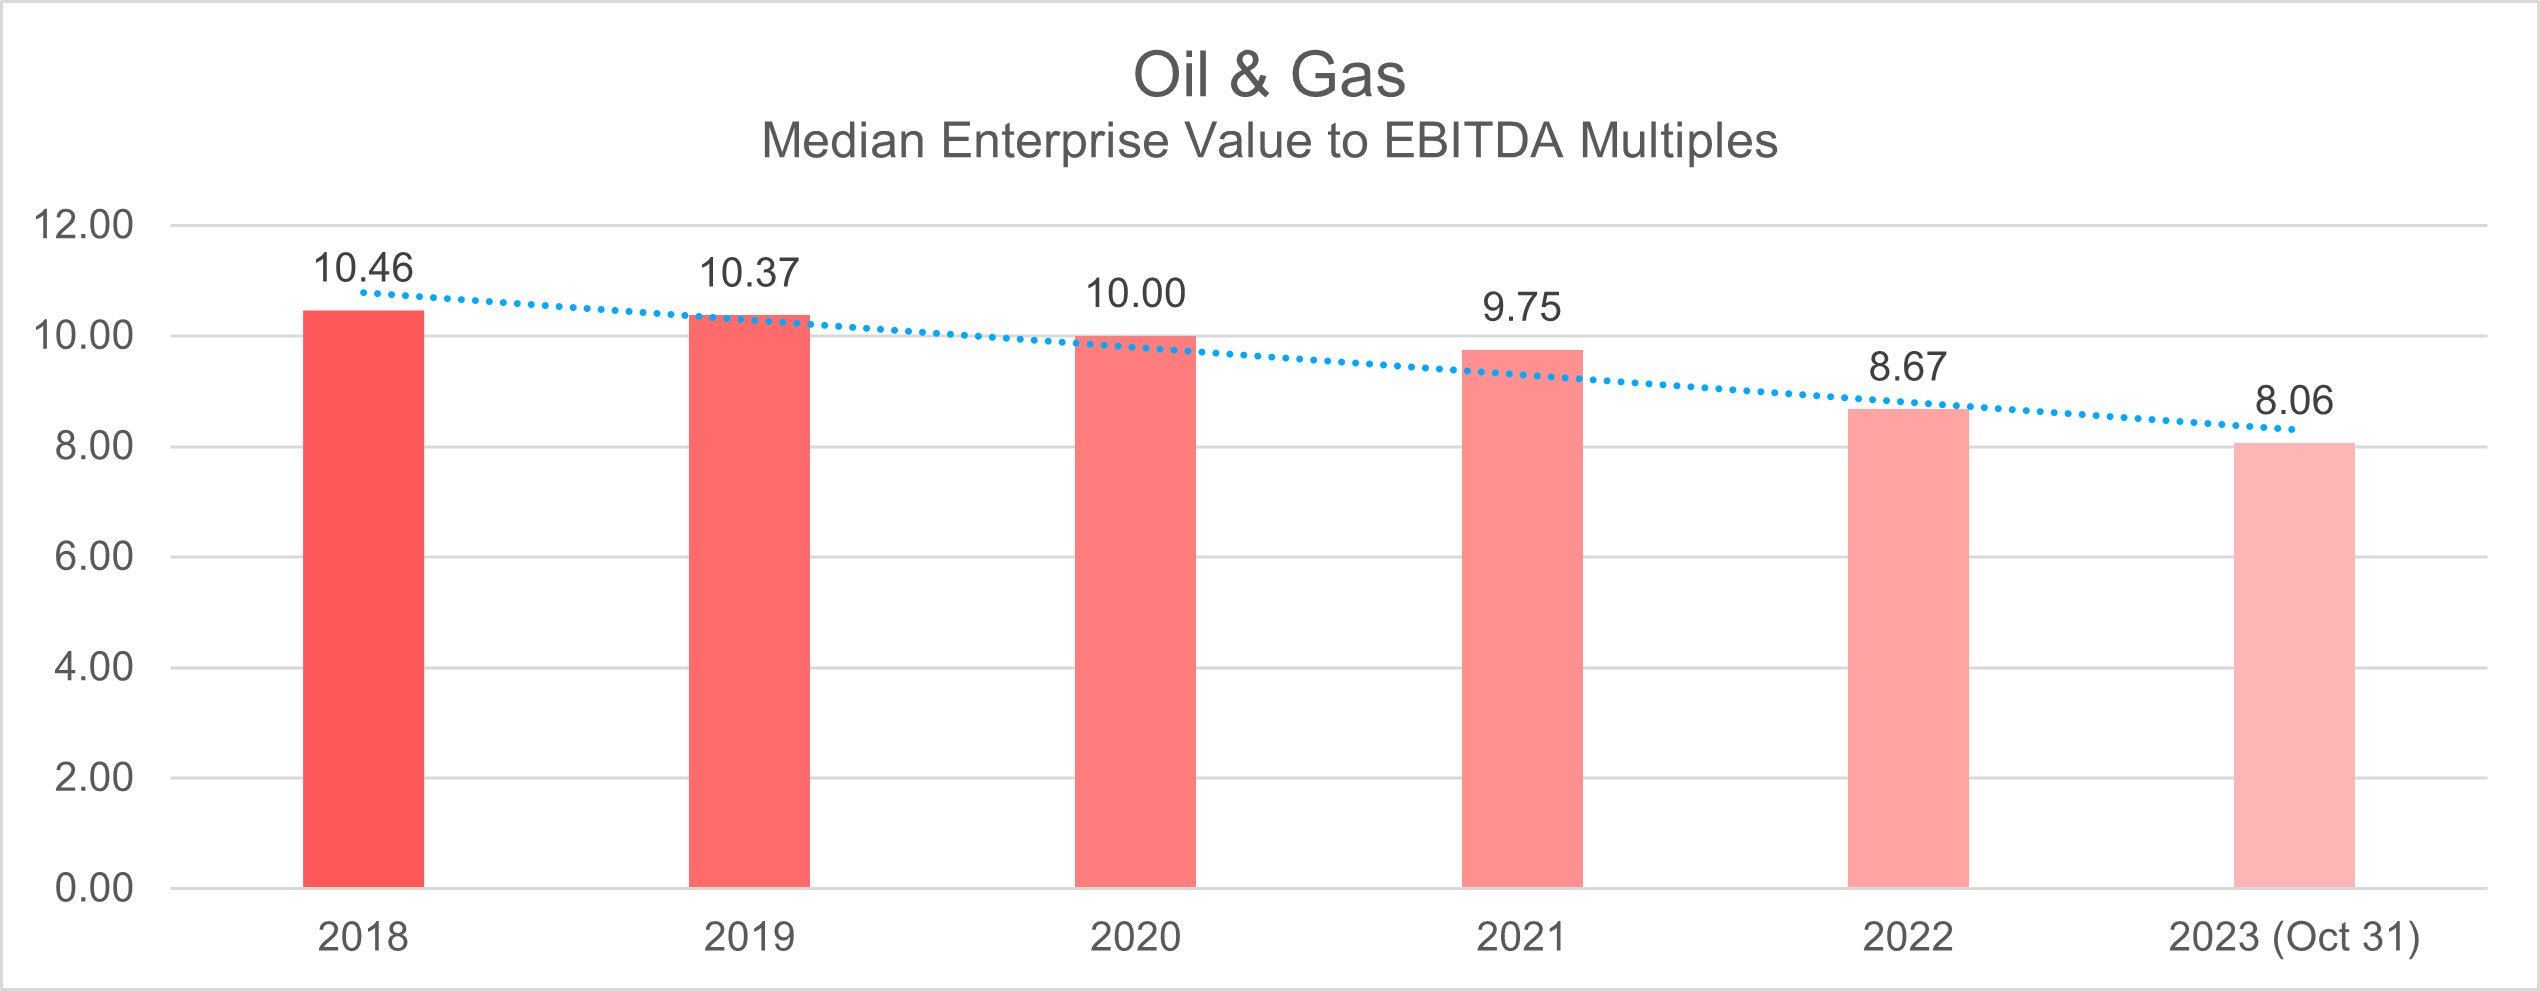
In the pre-pandemic era spanning 2018-2019, the Oil & Gas industry maintained a consistent median deal multiple of 10.4 when assessed through the Enterprise Value to EBITDA (EV/EBITDA) metric.
However, the onset of the pandemic in 2020 brought about a notable shift in this valuation landscape. The median deal multiple for the industry experienced a decline to 10 in 2020 and further decreased to 9.7 in 2021, reflecting the unprecedented challenges faced by the sector during those tumultuous years.
Post-pandemic recovery witnessed a continued downward trajectory in deal multiples for Oil & Gas sector, with a noticeable drop to 8.7 in 2022. As of October 2023, the trend persists, and the median deal multiples for Oil & Gas have settled at 8.
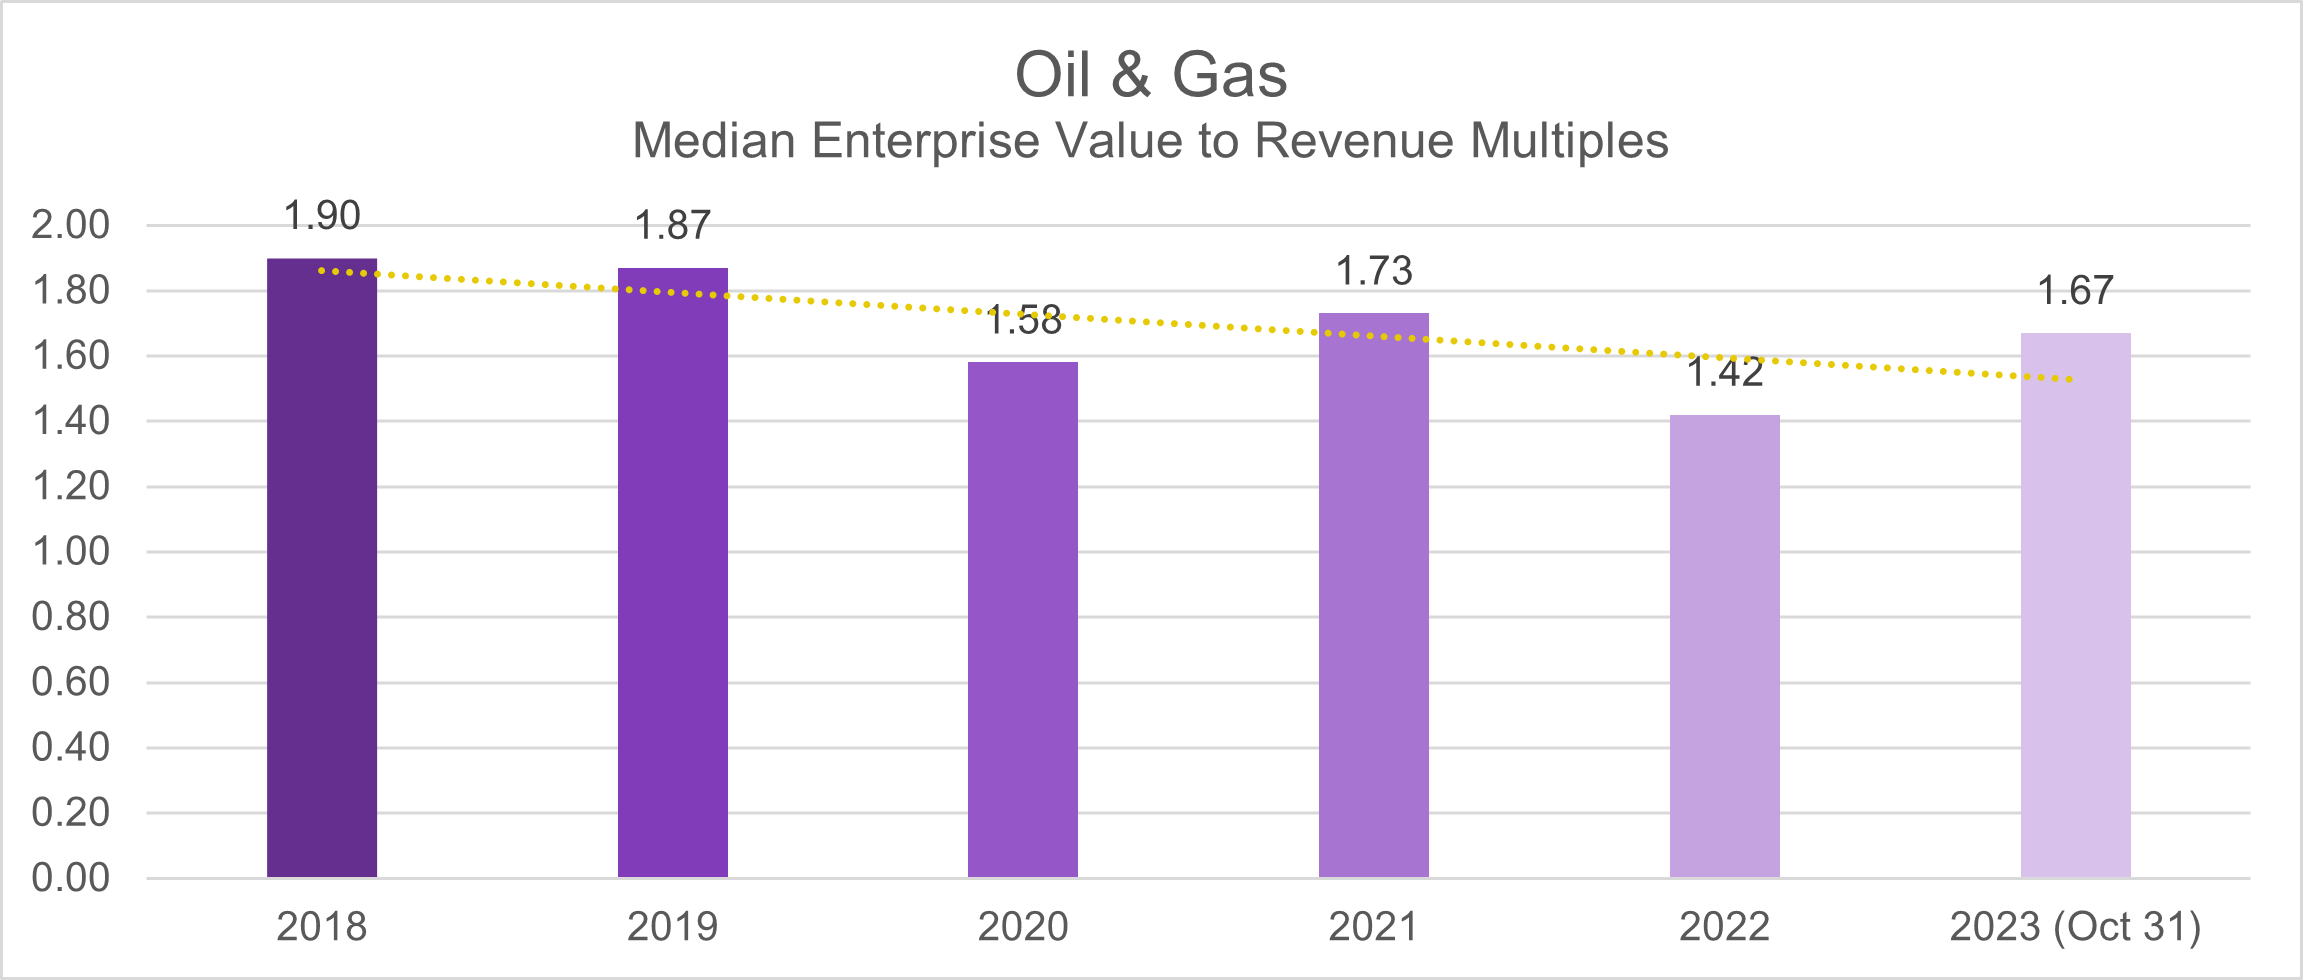
Examining the (EV/Revenue) metric sheds light on the deal multiples within the Oil & Gas sector. In the pre-pandemic period of 2018-2019, the median was a steady 1.9, indicating a relatively stable valuation environment. The impact of the pandemic in 2020 resulted in a modest decrease to 1.6, but a recovery to 1.7 was observed the following year.
The post-pandemic period, specifically in 2022, marked the lowest point in the years analyzed, with the median dropping to 1.4. However, signs of recovery are evident as of October 2023, with the median deal multiple climbing back to 1.7.
Retail
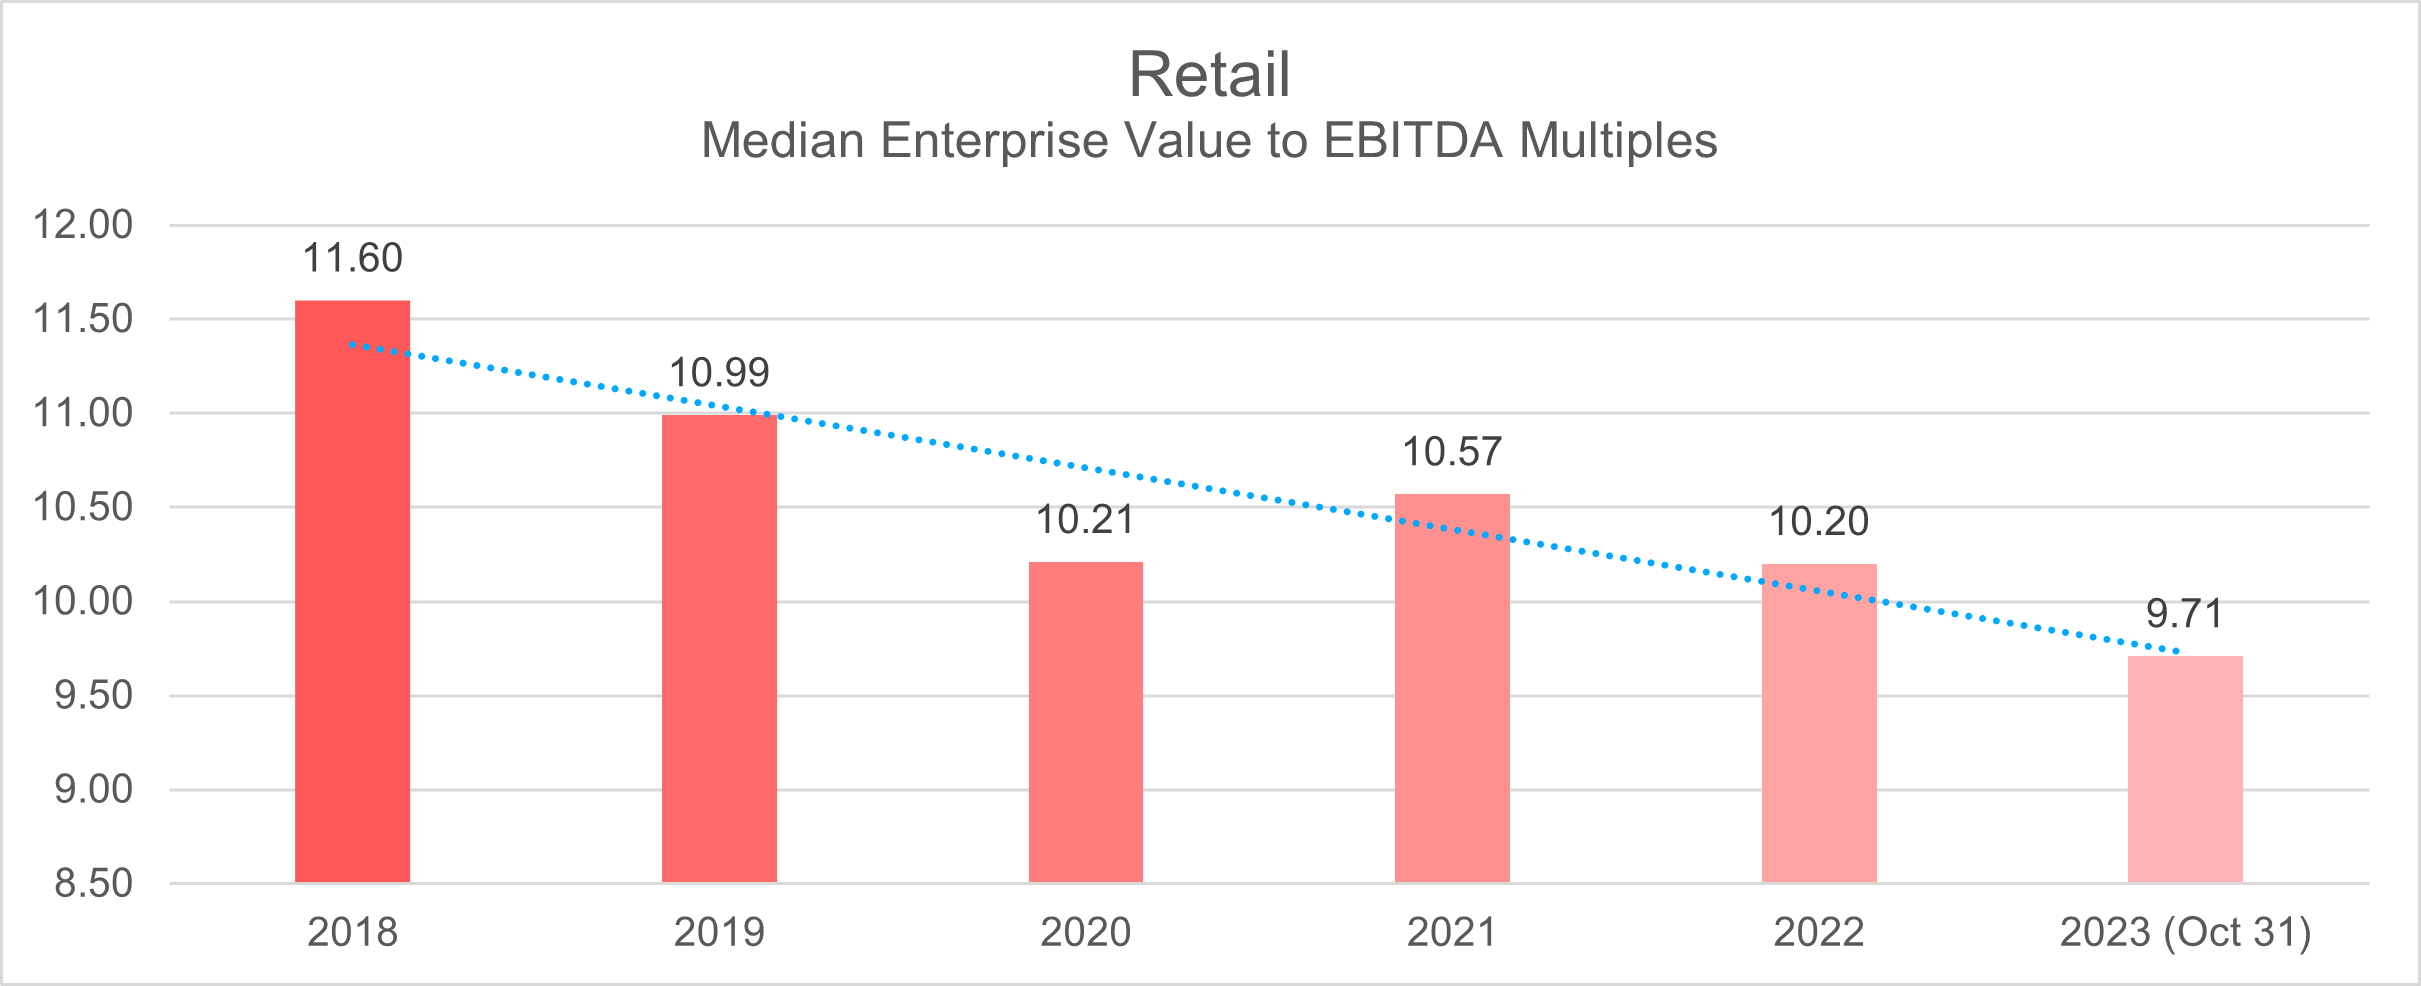
In the pre-pandemic period from 2018 to 2019, the Retail sector exhibited a median deal multiple of 11.6 and 11, as determined by the Enterprise Value to EBITDA (EV/EBITDA) metric. This key valuation indicator reflected the industry’s financial health and performance during those stable years.
However, the landscape changed significantly during the pandemic (2020-2021), witnessing a decline in deal multiples to a level of 10.
The post-pandemic years of 2022-2023 continued to witness a downward trajectory in deal multiples. As the median deal multiples settled at 9.7 as of October 2023.
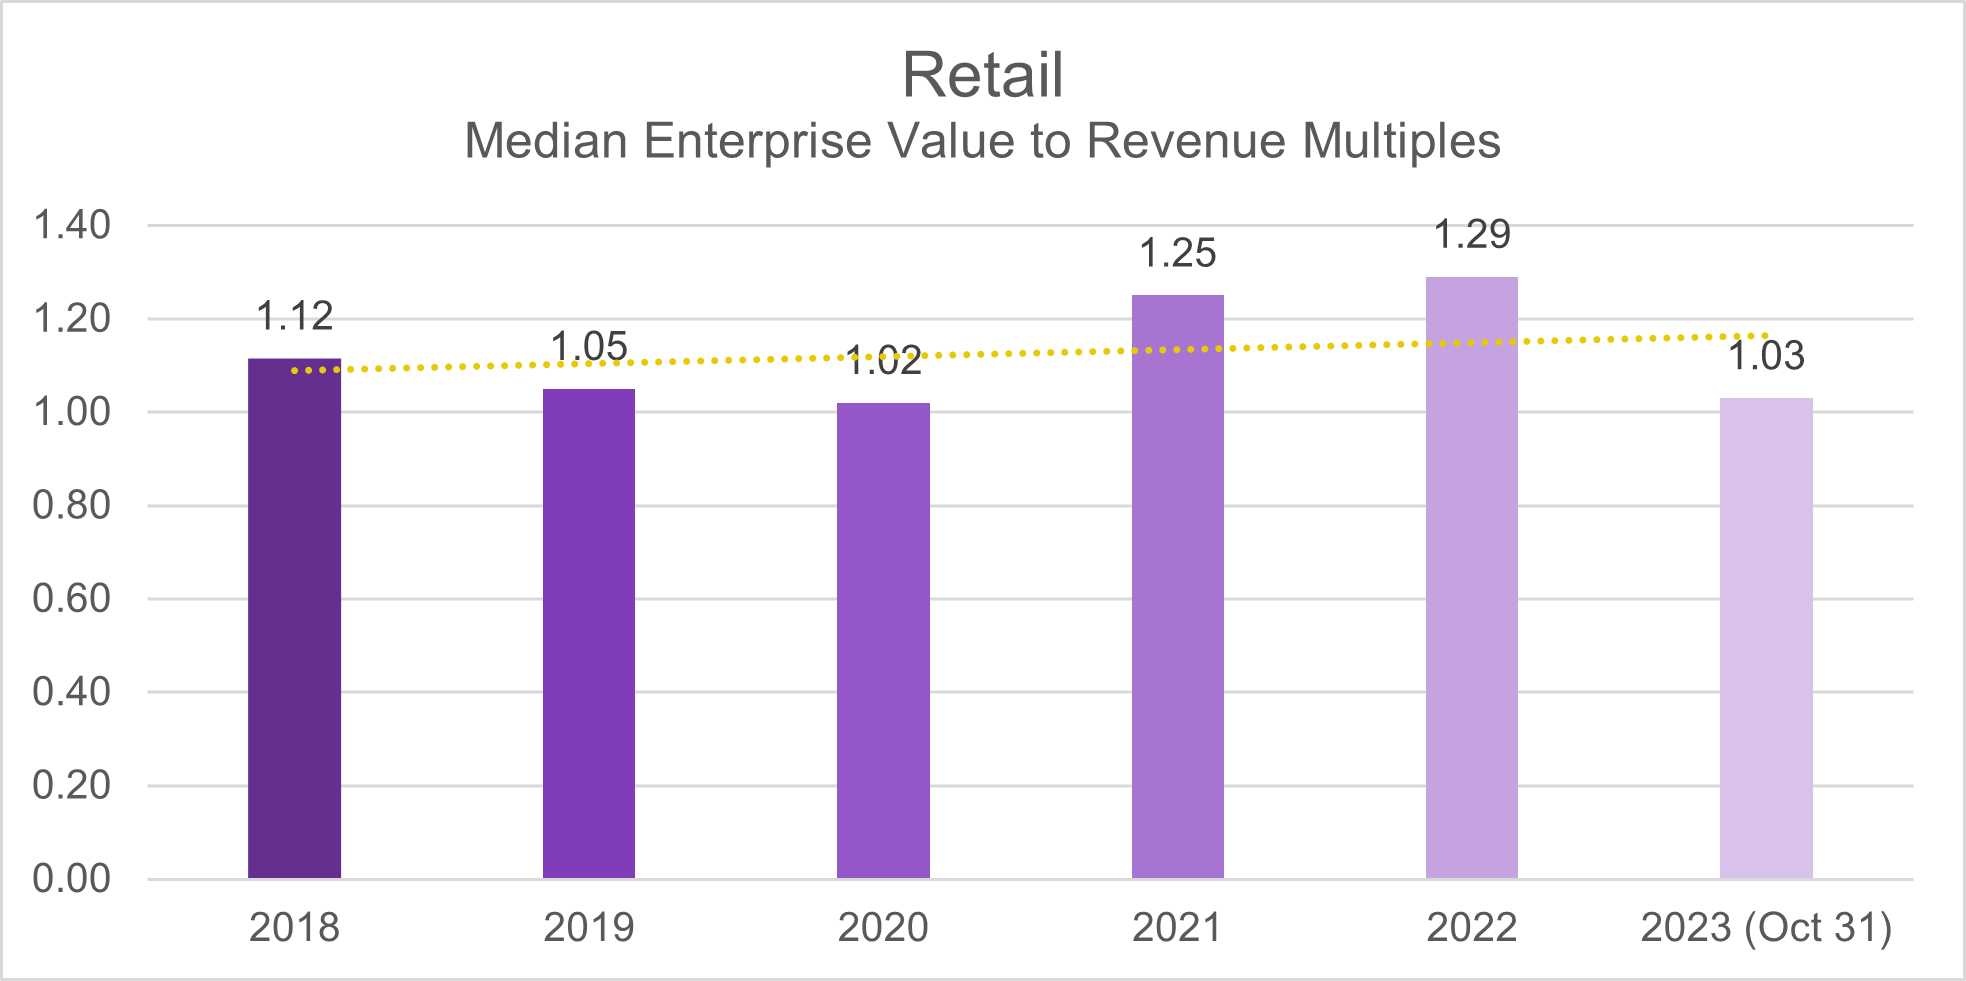
Reviewing deal multiples trend through the EV/Revenue ratio shows a notable consistency from the pre-pandemic years of 2018-2019 to October 2023.The median deal multiple for the Retail sector has consistently hovered within a narrow range of 1 to 1.29. Notably, the lowest point was recorded in 2020 at the onset of the pandemic, underscoring the impact of economic uncertainty during that period. Conversely, the highest point was observed in 2022, indicative of a robust post-pandemic recovery.
Software
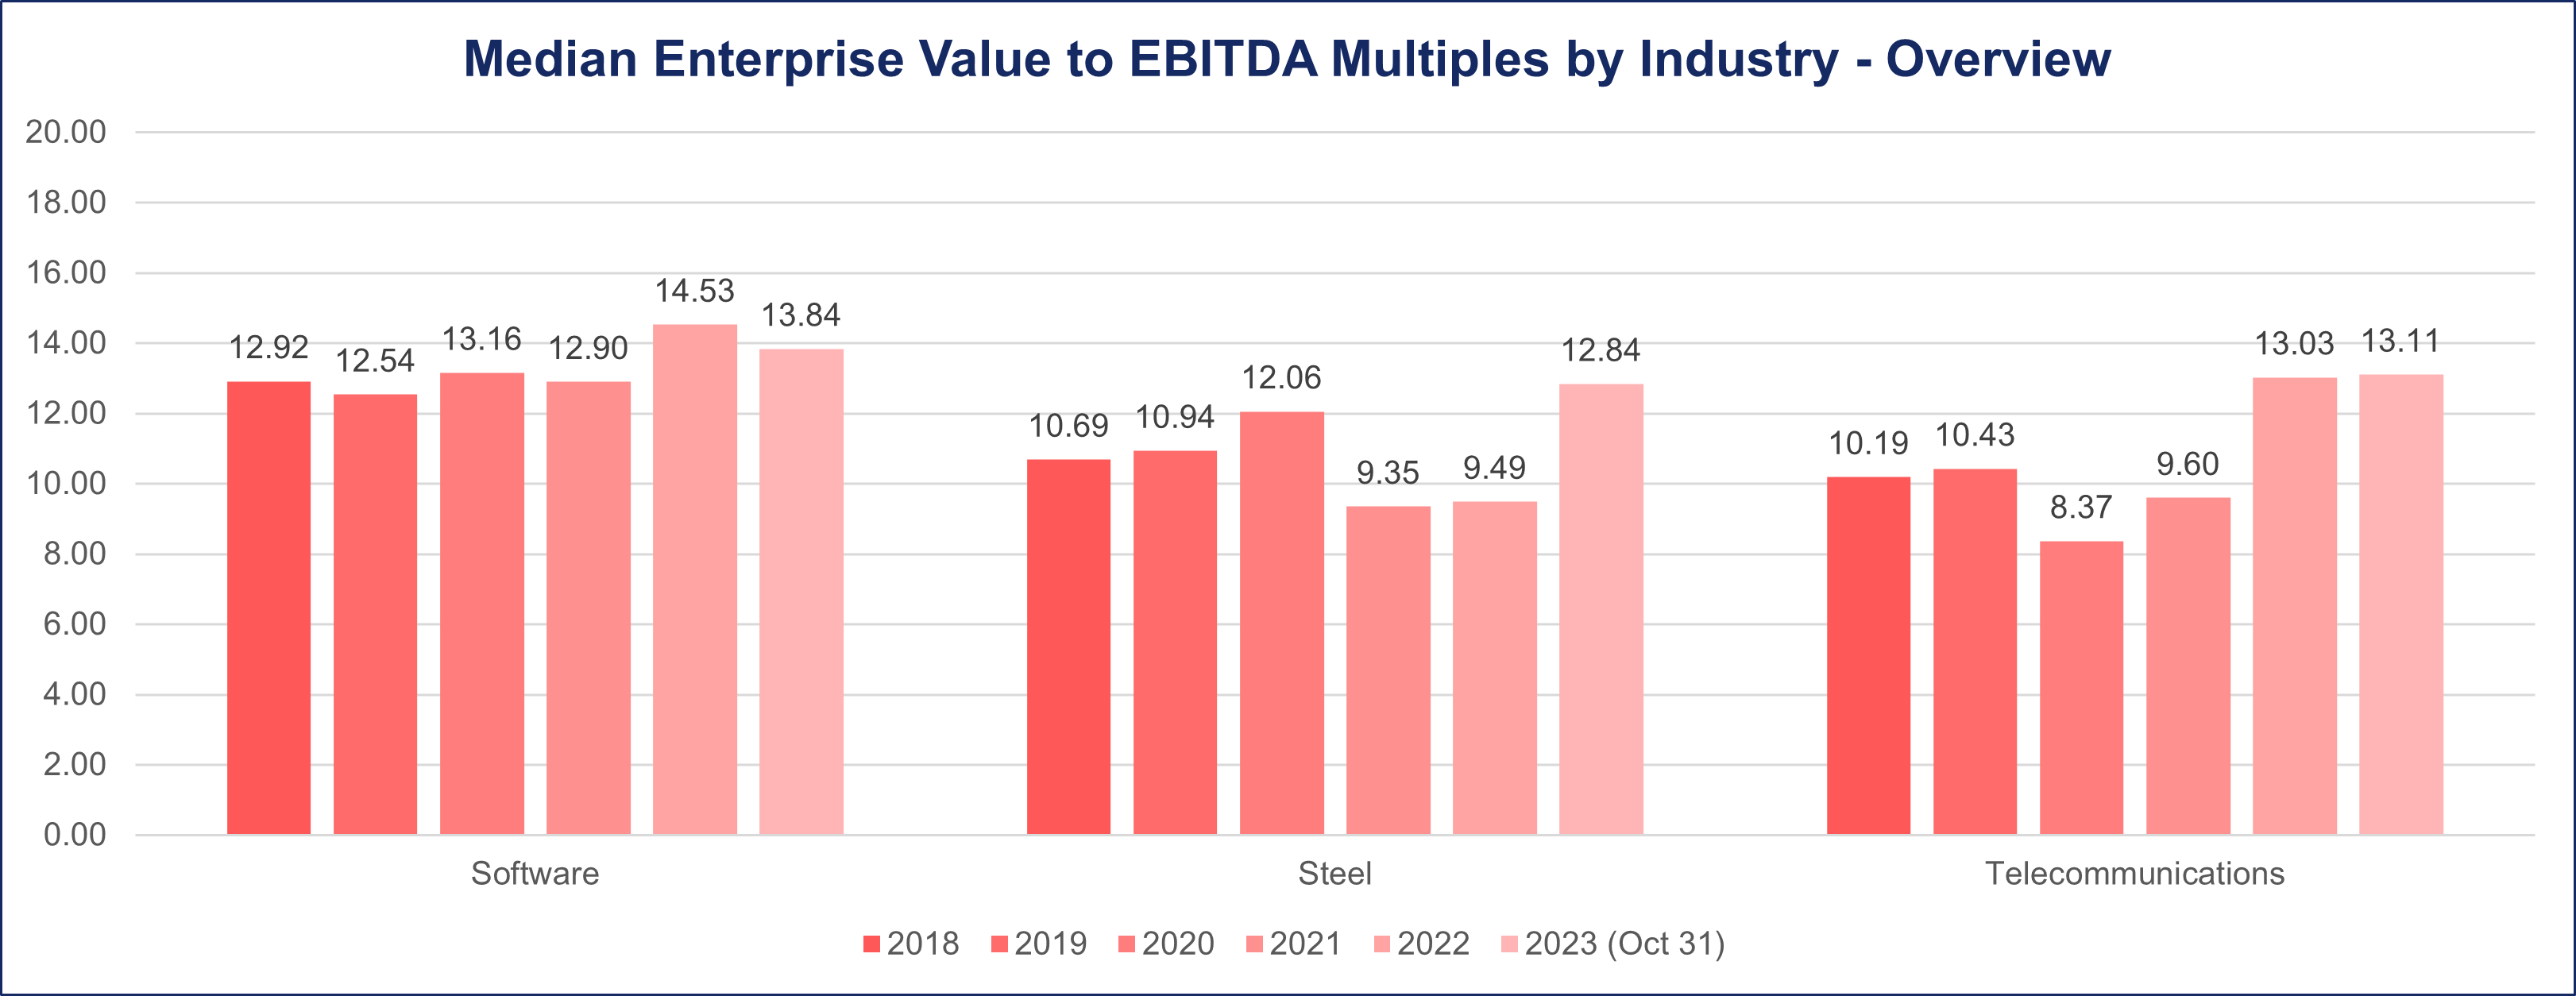
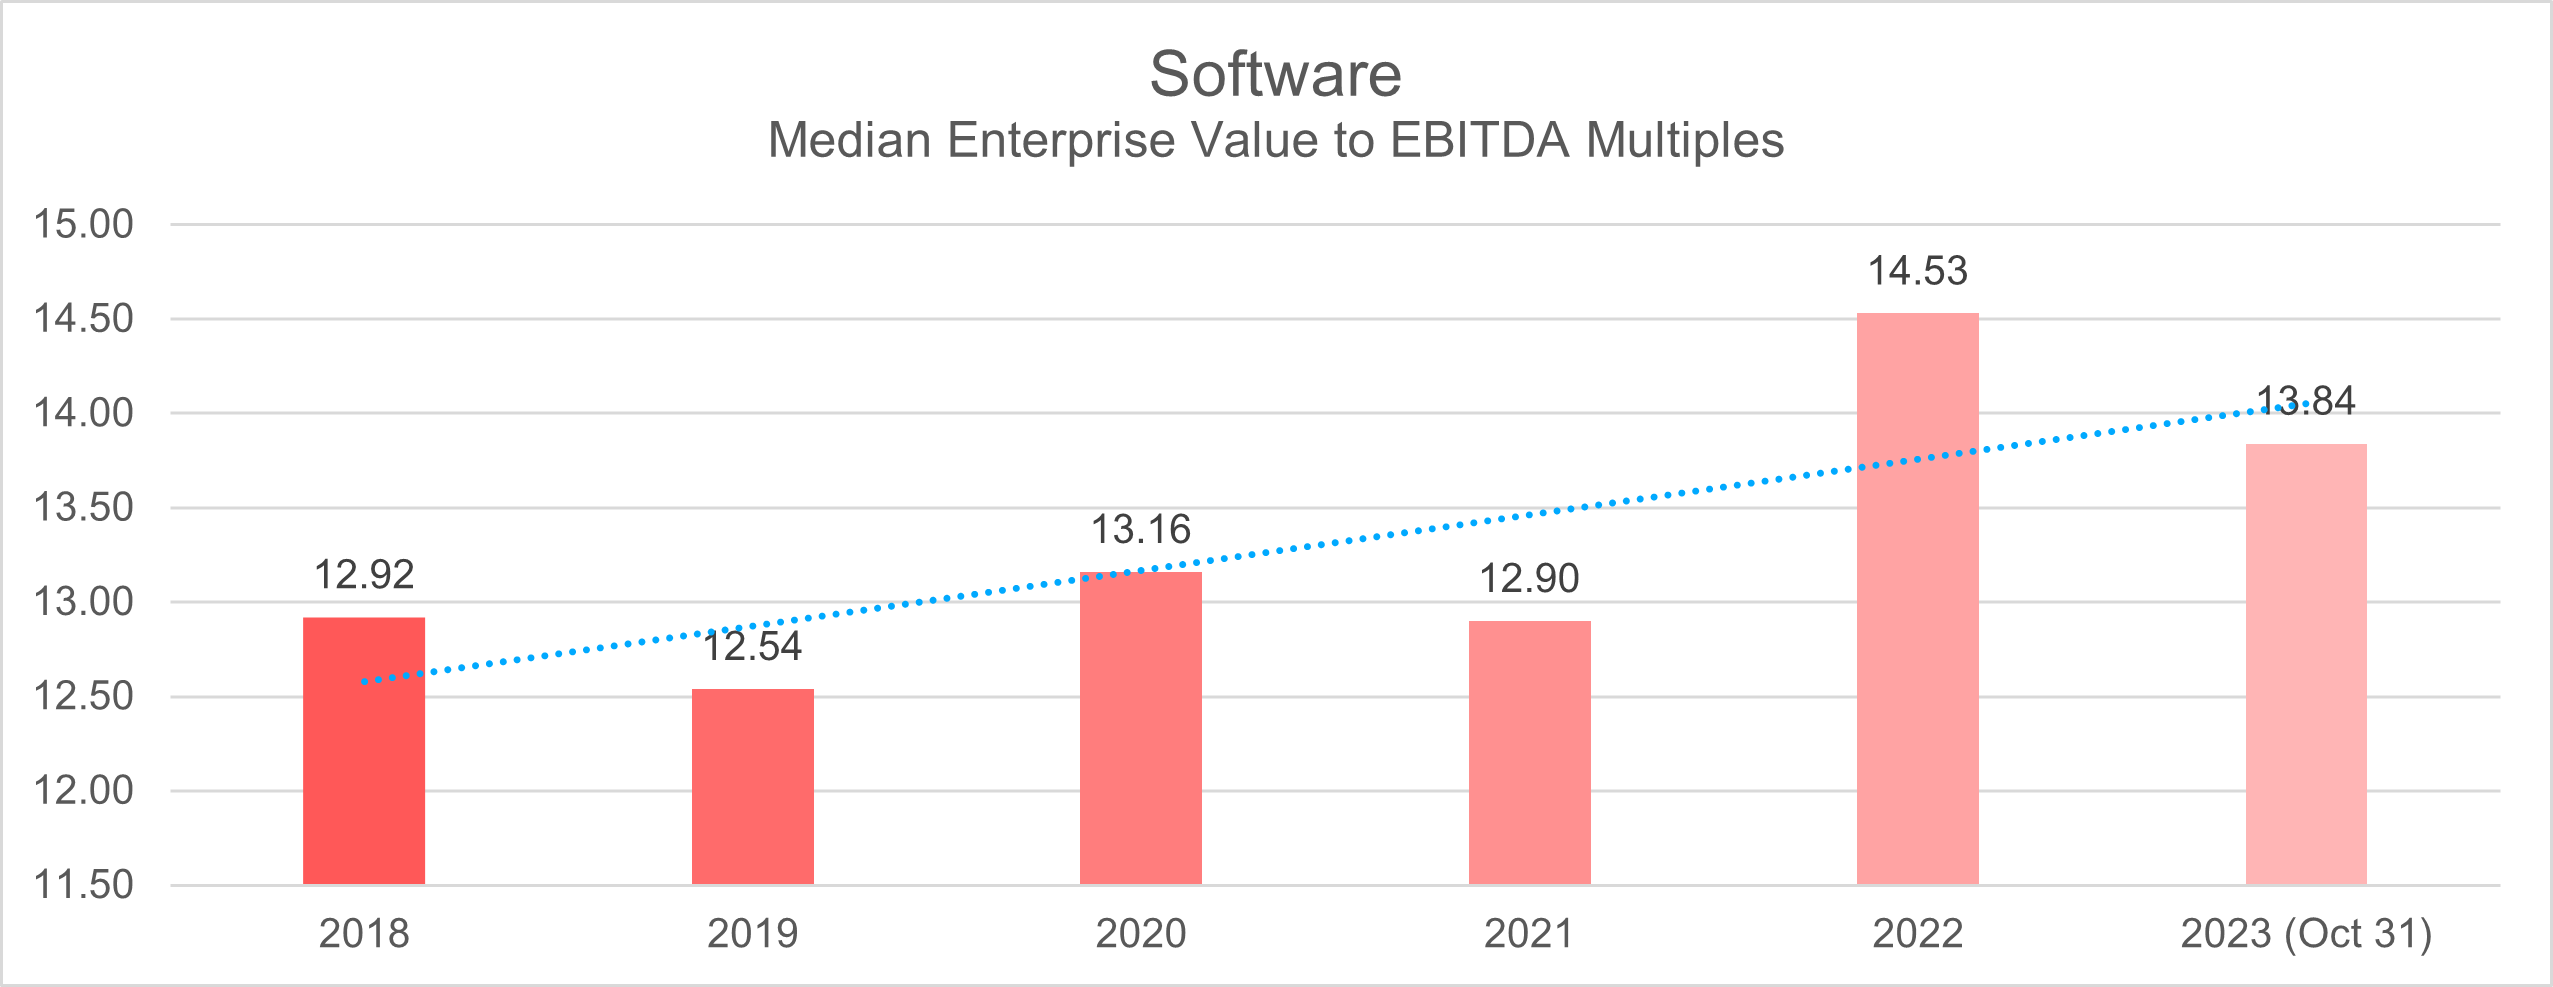
Between 2018 and 2019, the Software Industry exhibited commendable stability in its median deal multiples, maintaining a narrow range from 12.5 to 12.9, as gauged by the Enterprise Value to EBITDA (EV to EBITDA) ratio.
The onset of the pandemic brought about a notable shift in this trend. In 2020, the industry witnessed an uptick in the median deal multiple, reaching 13.2, only to decrease to 12.9 in 2021.
However, the post-pandemic landscape, particularly in 2022, witnessed a noteworthy resurgence as the median deal multiple for the Software sector surged to 14.5. As of October 2023, the recorded deal multiple for the industry stands at 13.8.
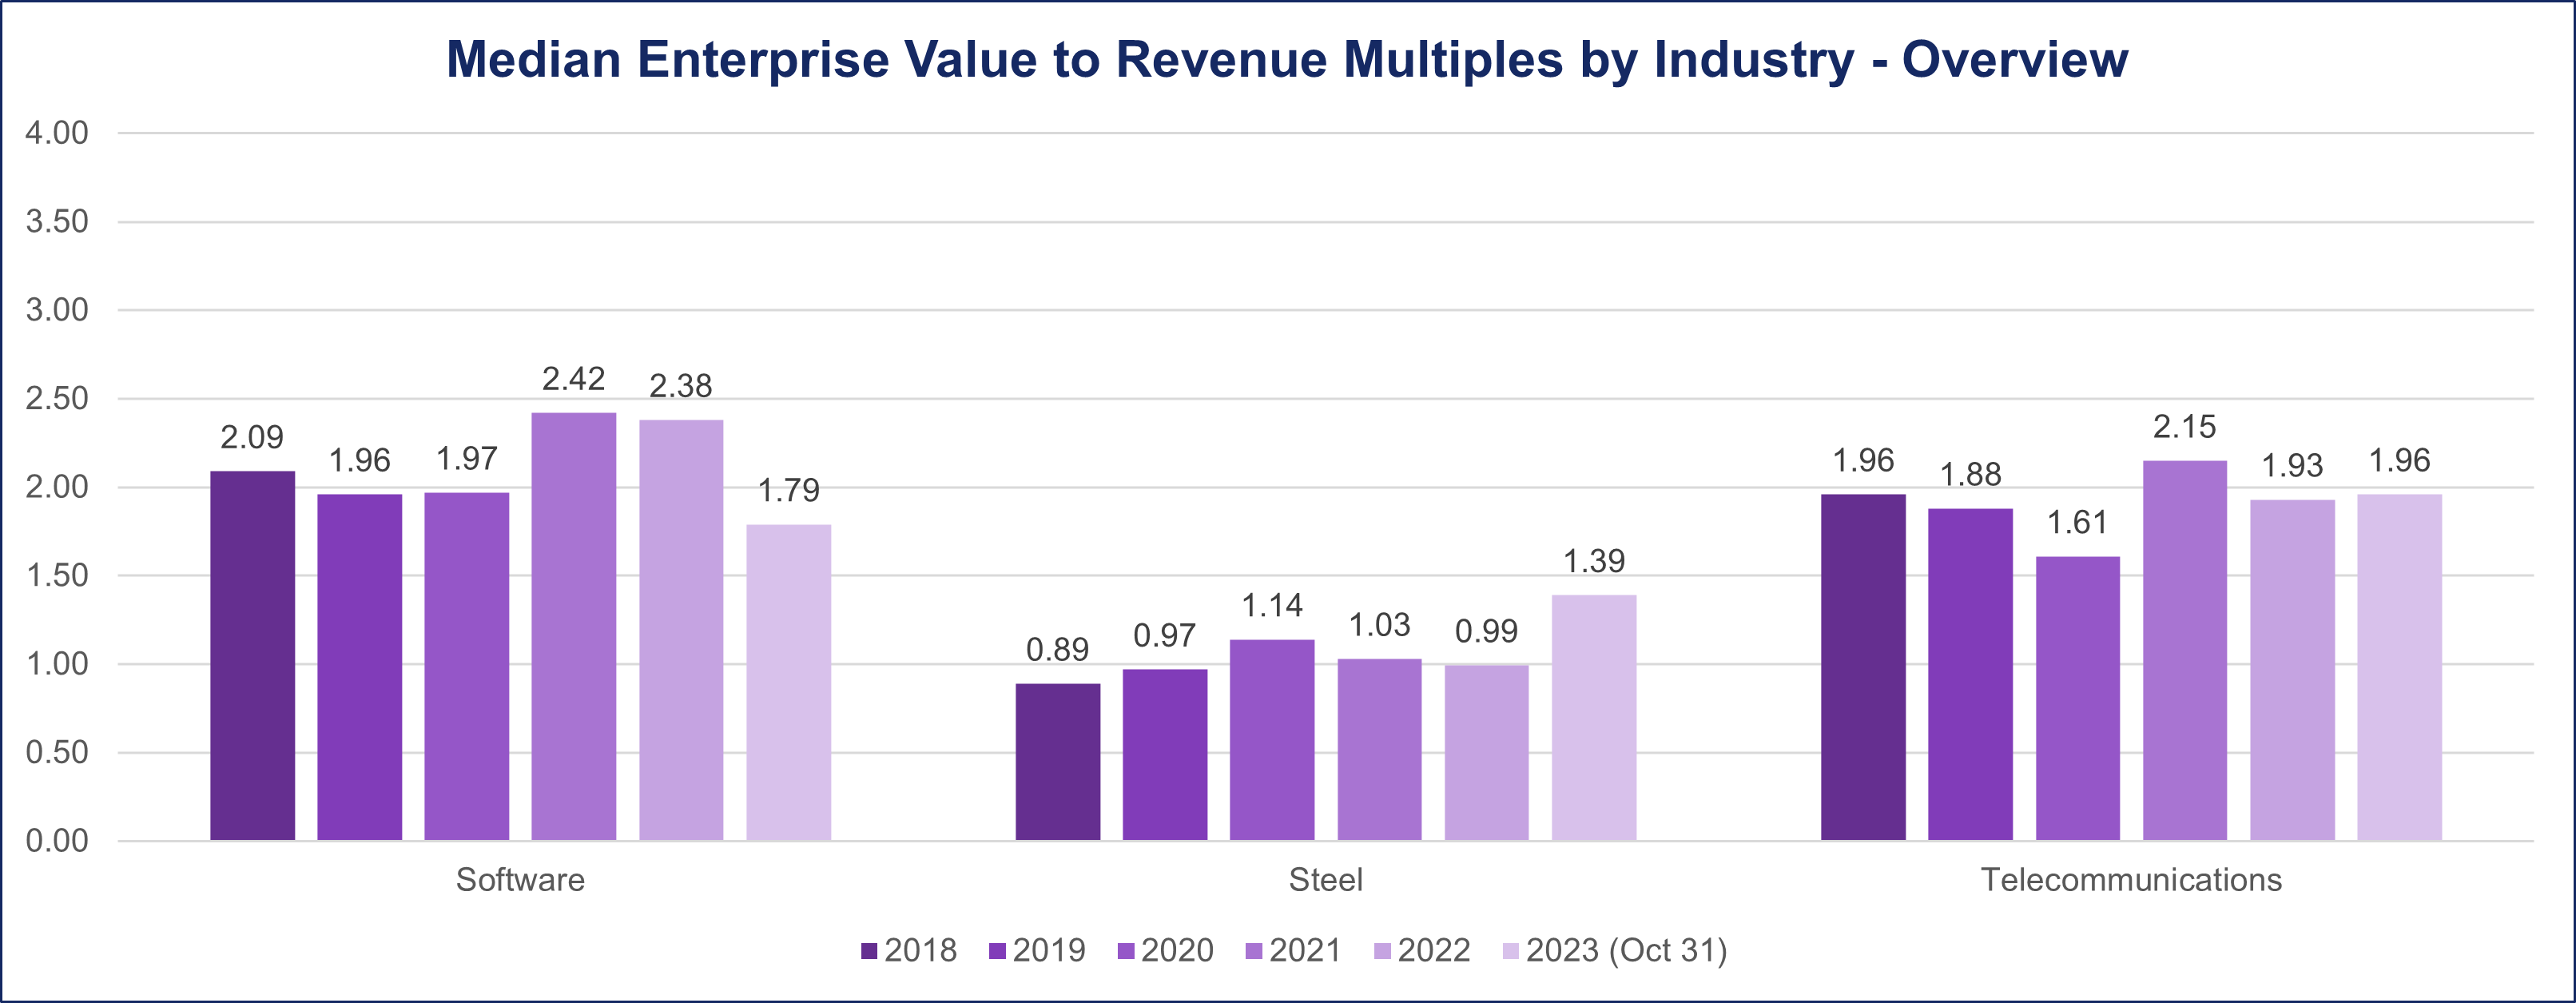
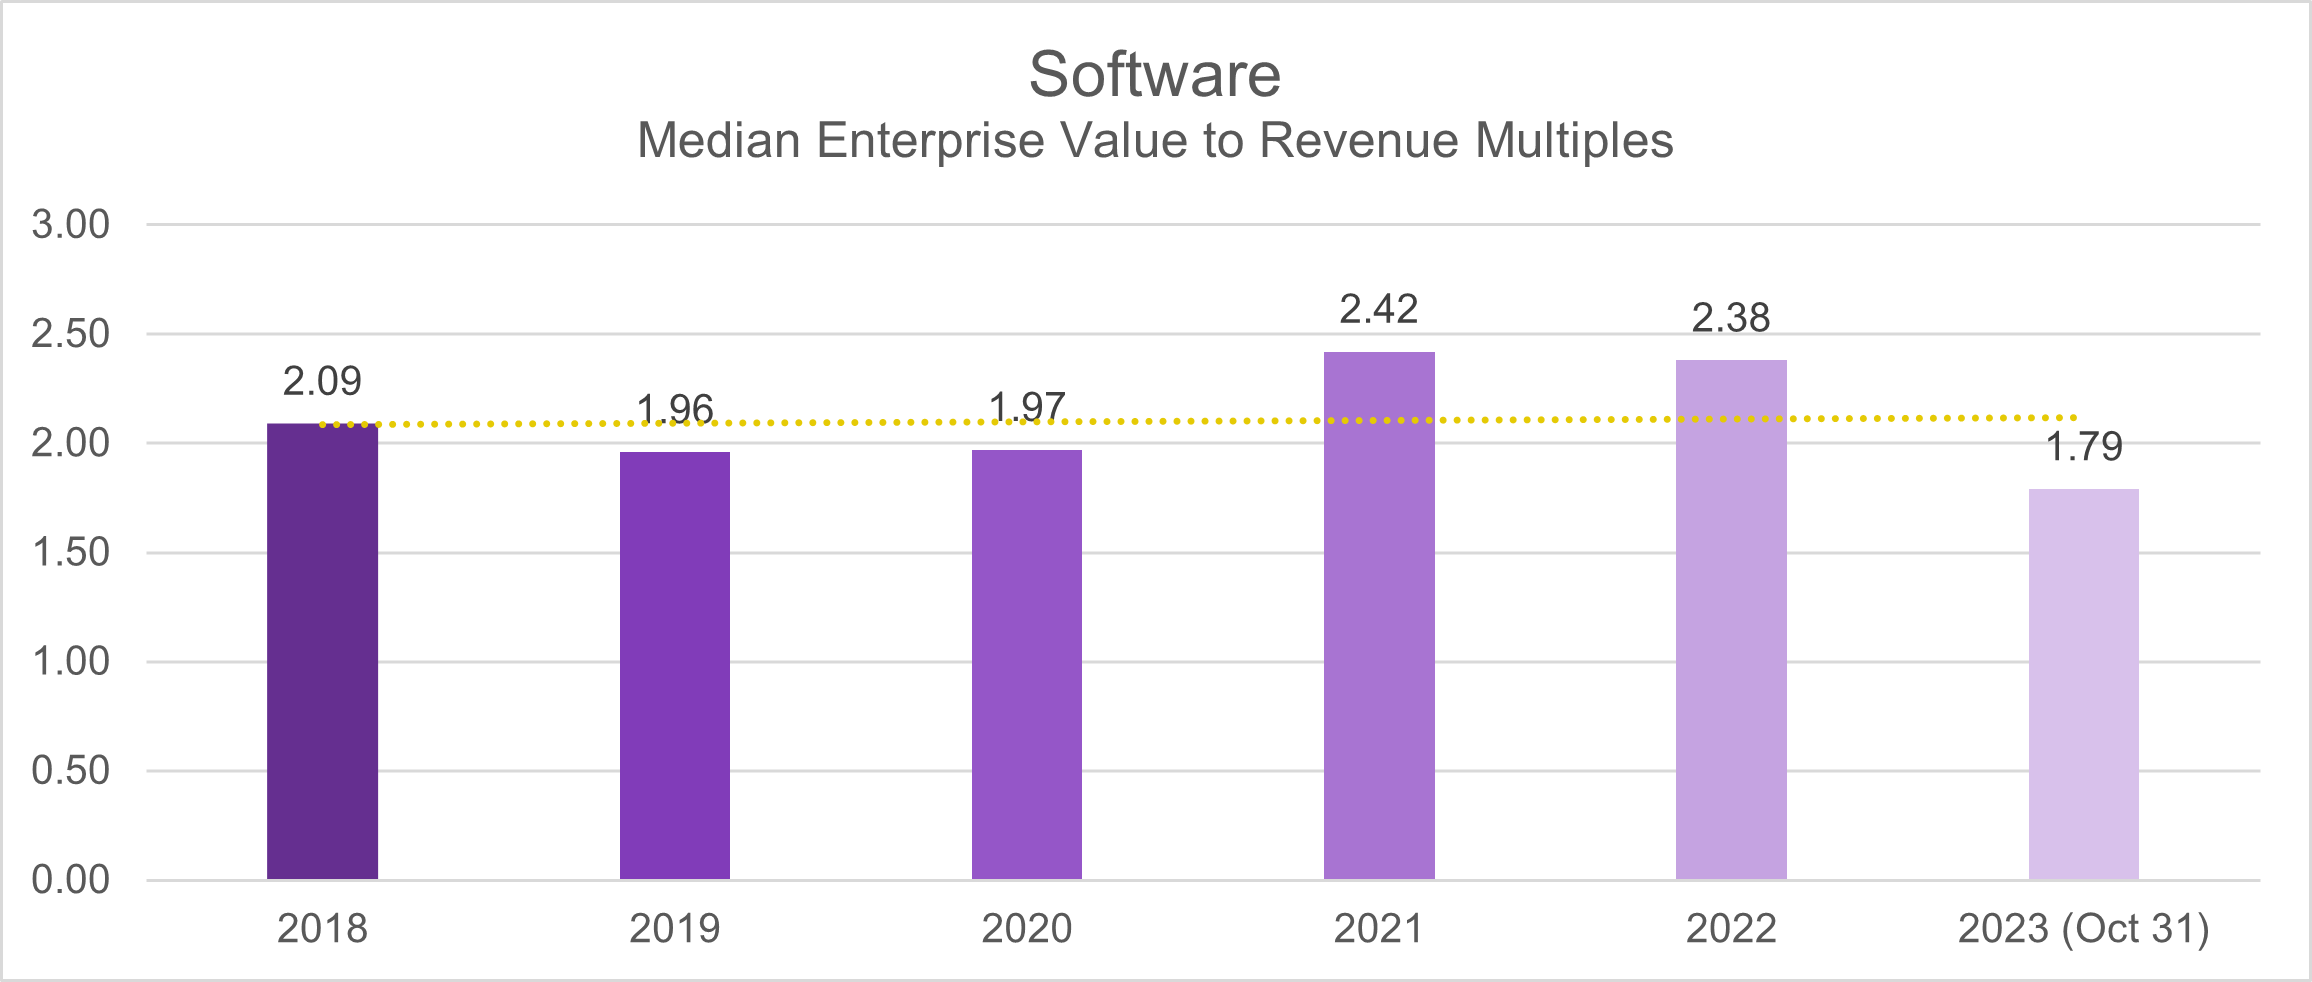
The Software industry stands out for its remarkable consistency in deal multiples, particularly through the lens of the EV/Revenue ratio. Examining the 2018-2019 period reveals a steady median deal multiple of 2.1 and 1.9, respectively. Interestingly, this stability persisted during the initial stages of the pandemic in 2020, maintaining the ratio at 1.9. However, a noteworthy shift occurred in 2021, witnessing an increase in the median deal multiple to 2.4. Even as the industry navigated the post-pandemic landscape in 2022, the ratio held firm at 2.4, as of October 2023, the median deal multiple is 1.8.
Steel
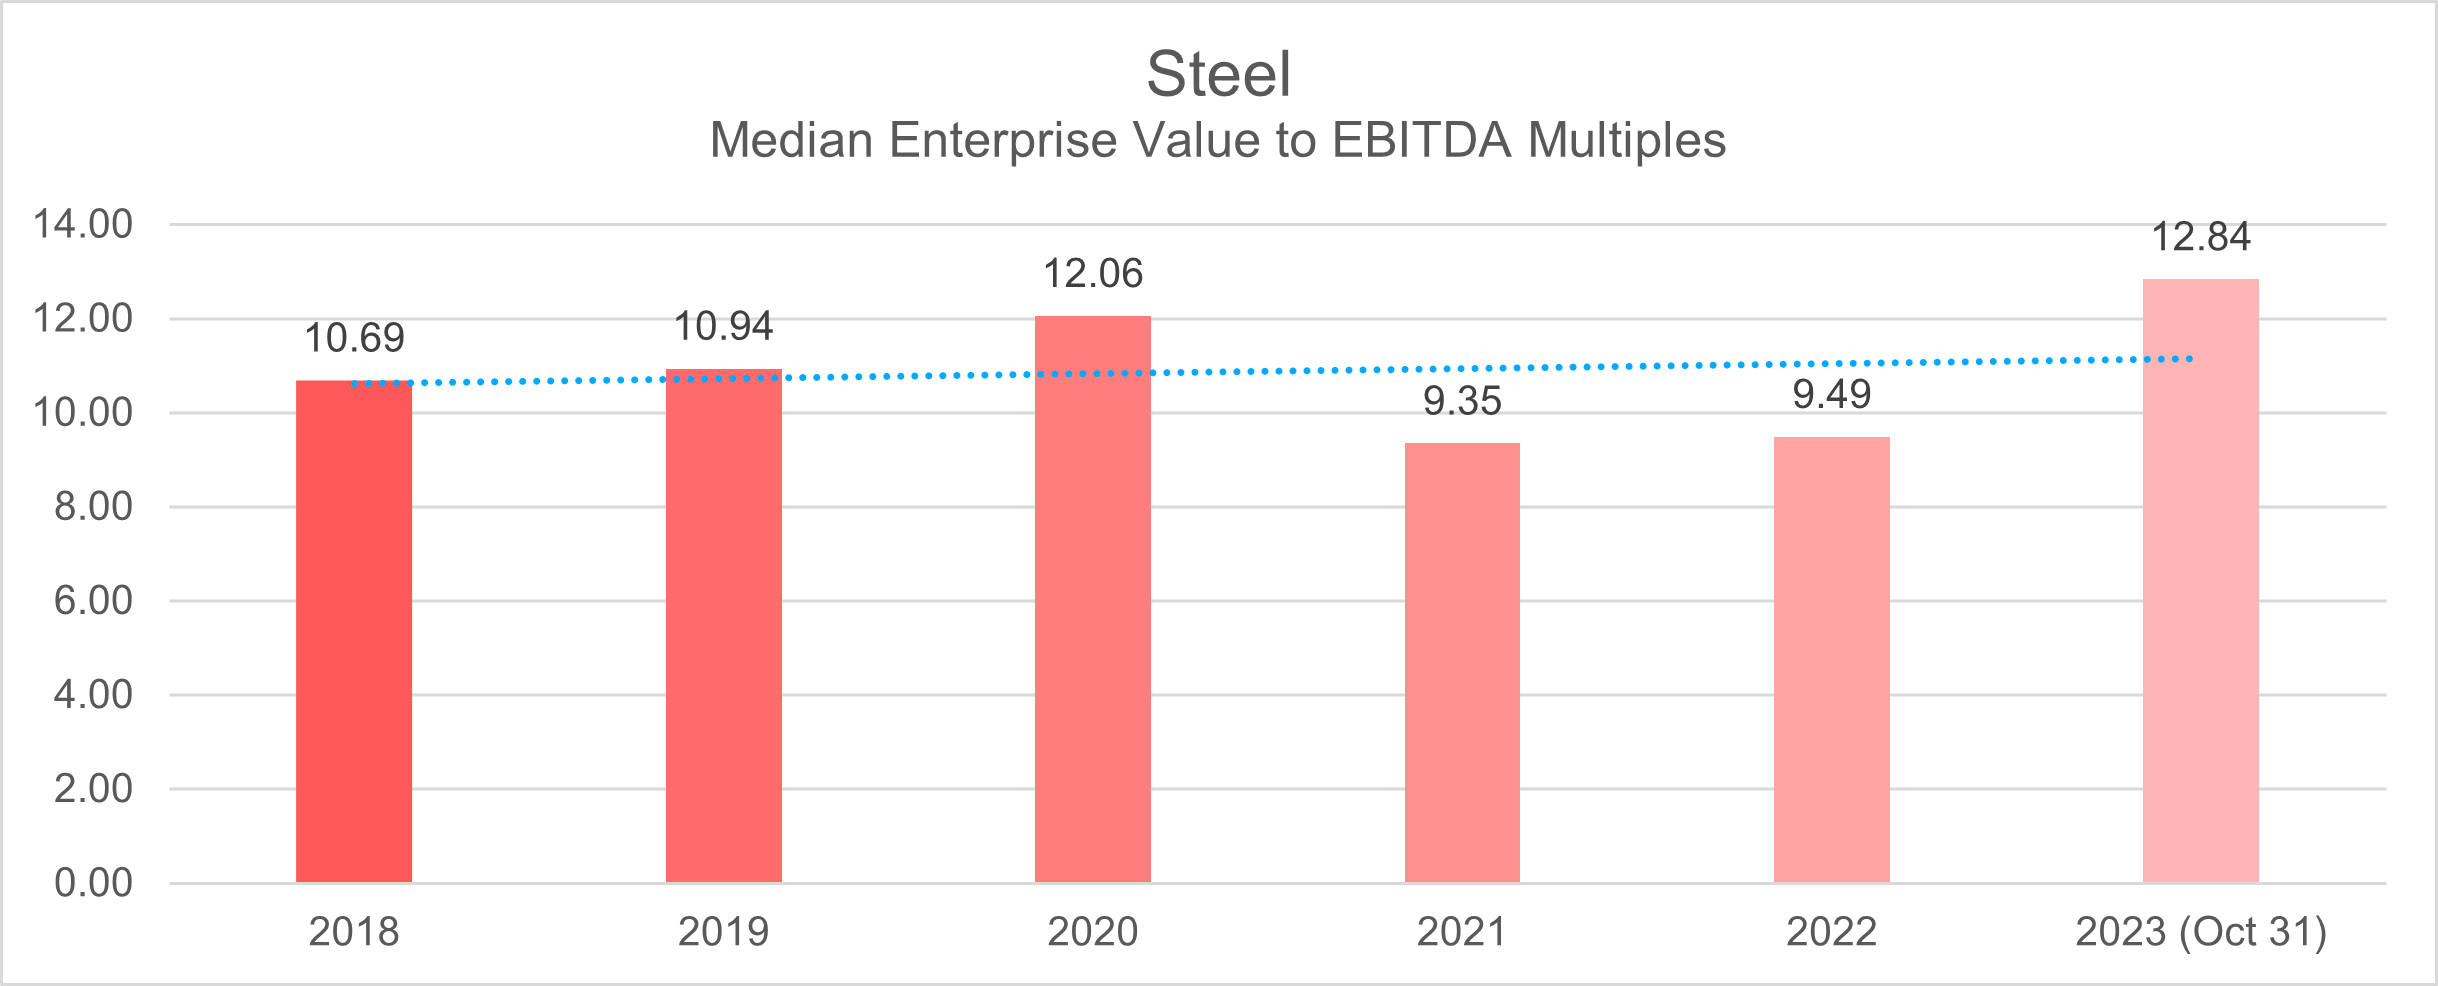
In the pre-pandemic period (2018-2019), the Steel Sector reported median deal multiples of 10.7 and 10.9, respectively, when assessed using the EV/EBITDA metric.
A noticeable shift in valuation dynamics occurred in 2020, as deal multiples experienced a significant increase, reaching 12. This surge was followed by a decline in the subsequent year, settling at 9.3.
Navigating the transition into the post-pandemic landscape in 2022, the trend persisted as the deal multiple settled at 9.5. Yet, as of October 2023, a notable resurgence occurred, with the median multiple readjusting to 12.8, indicating a potential stabilization or realignment in the industry’s valuation landscape.
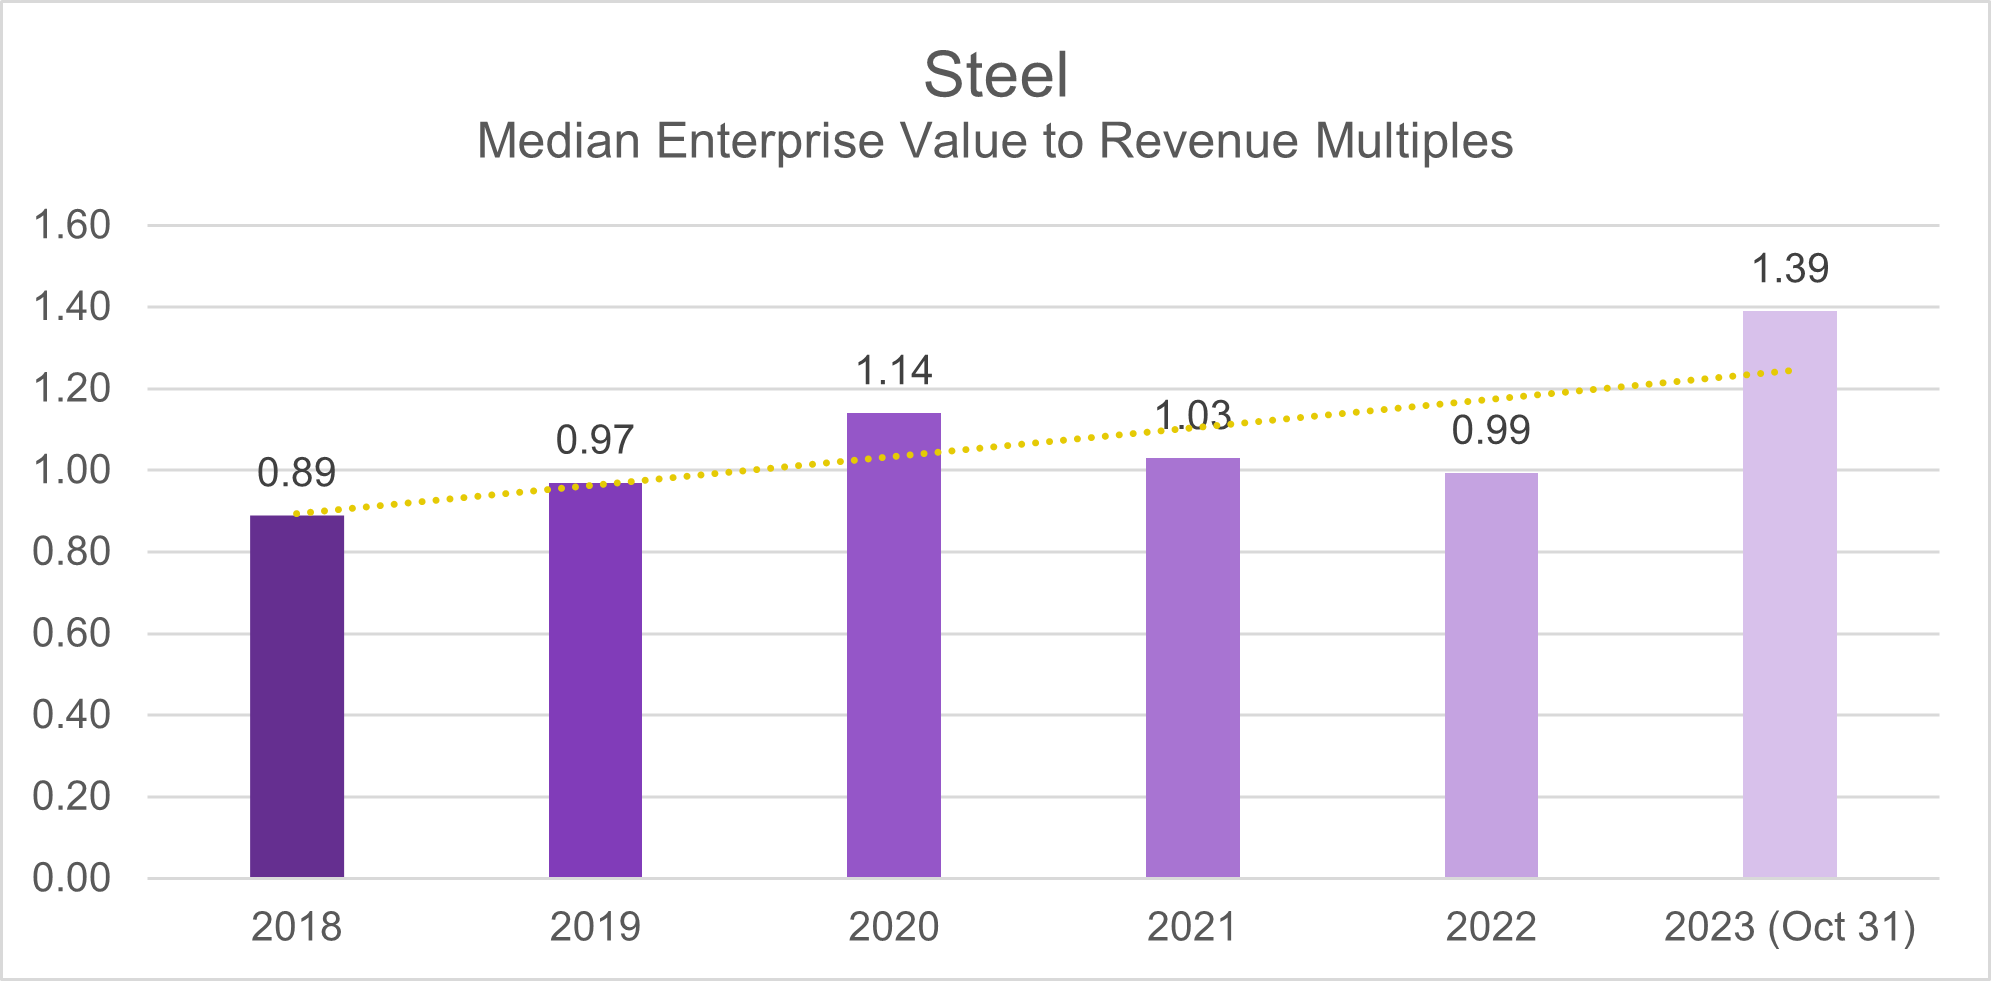
During the pre-pandemic years of 2018-2019, the Steel industry exhibited a median deal multiple, as measured by the EV/Revenue metric, of 0.89 and 0.97, respectively. Notably, this metric experienced a modest uptick during the pandemic in 2020, reaching 1.1. From 2021 transitioning into the post-pandemic landscape, the deal multiple stabilized at 1. However, as of October 2023, a discernible shift is evident, with the median deal multiple for the Steel Sector now elevated to 1.4.
Telecommunications
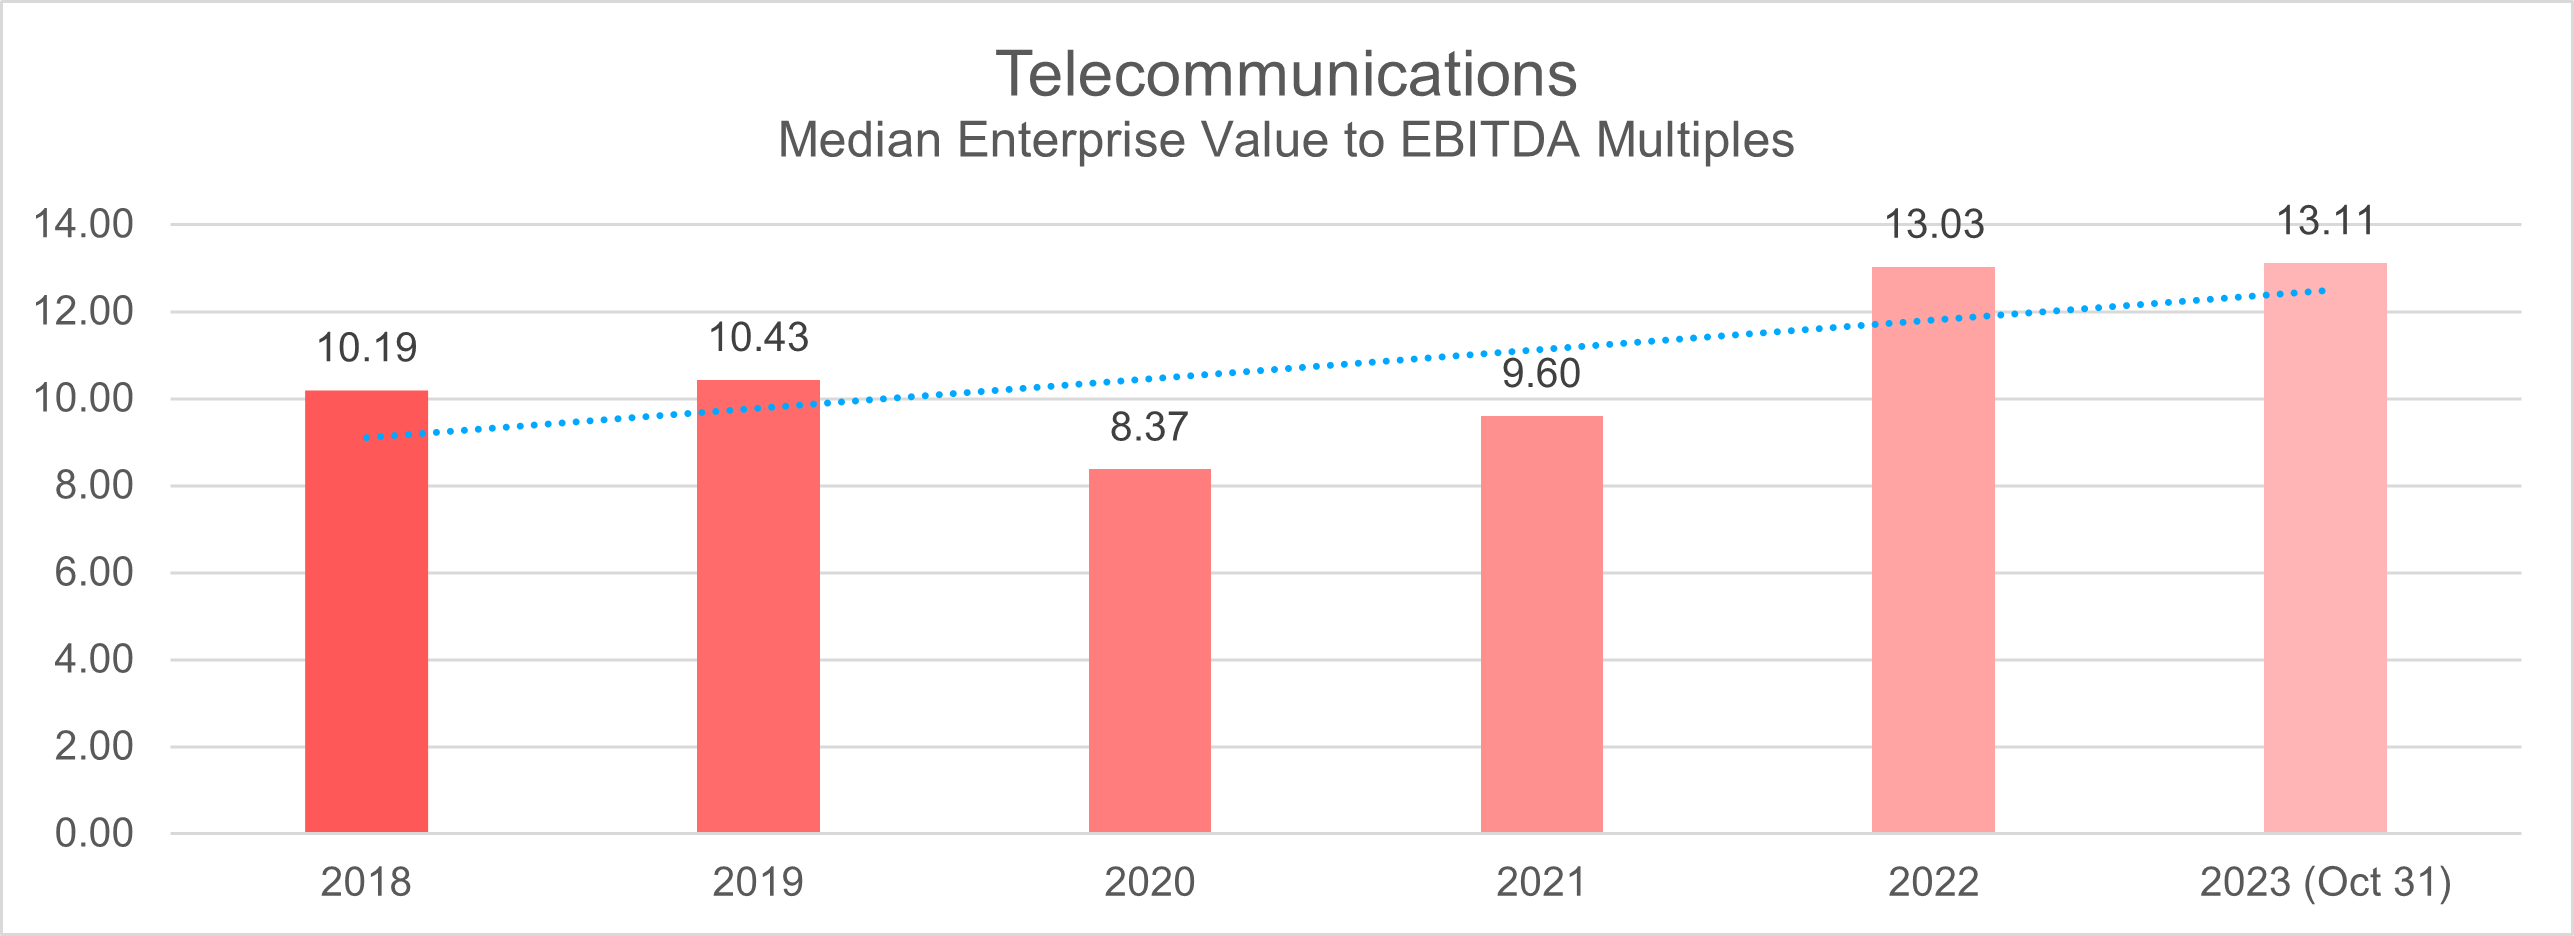
Between 2018 and 2019, the Telecommunications sector consistently maintained a median deal multiple of 10 when evaluated using the EV/EBITDA metric.
However, in 2020, the sector faced a decline in deal multiples, dropping to as low as 8.4 due to the challenges brought about by the global pandemic. In 2021, there was a modest recovery, with deal multiples increasing to 9.6.
Despite the setbacks during the pandemic, the Telecommunications sector showcased resilience. As of October 2023, there has been a notable rebound, with the median multiple reaching an elevated level of 13.
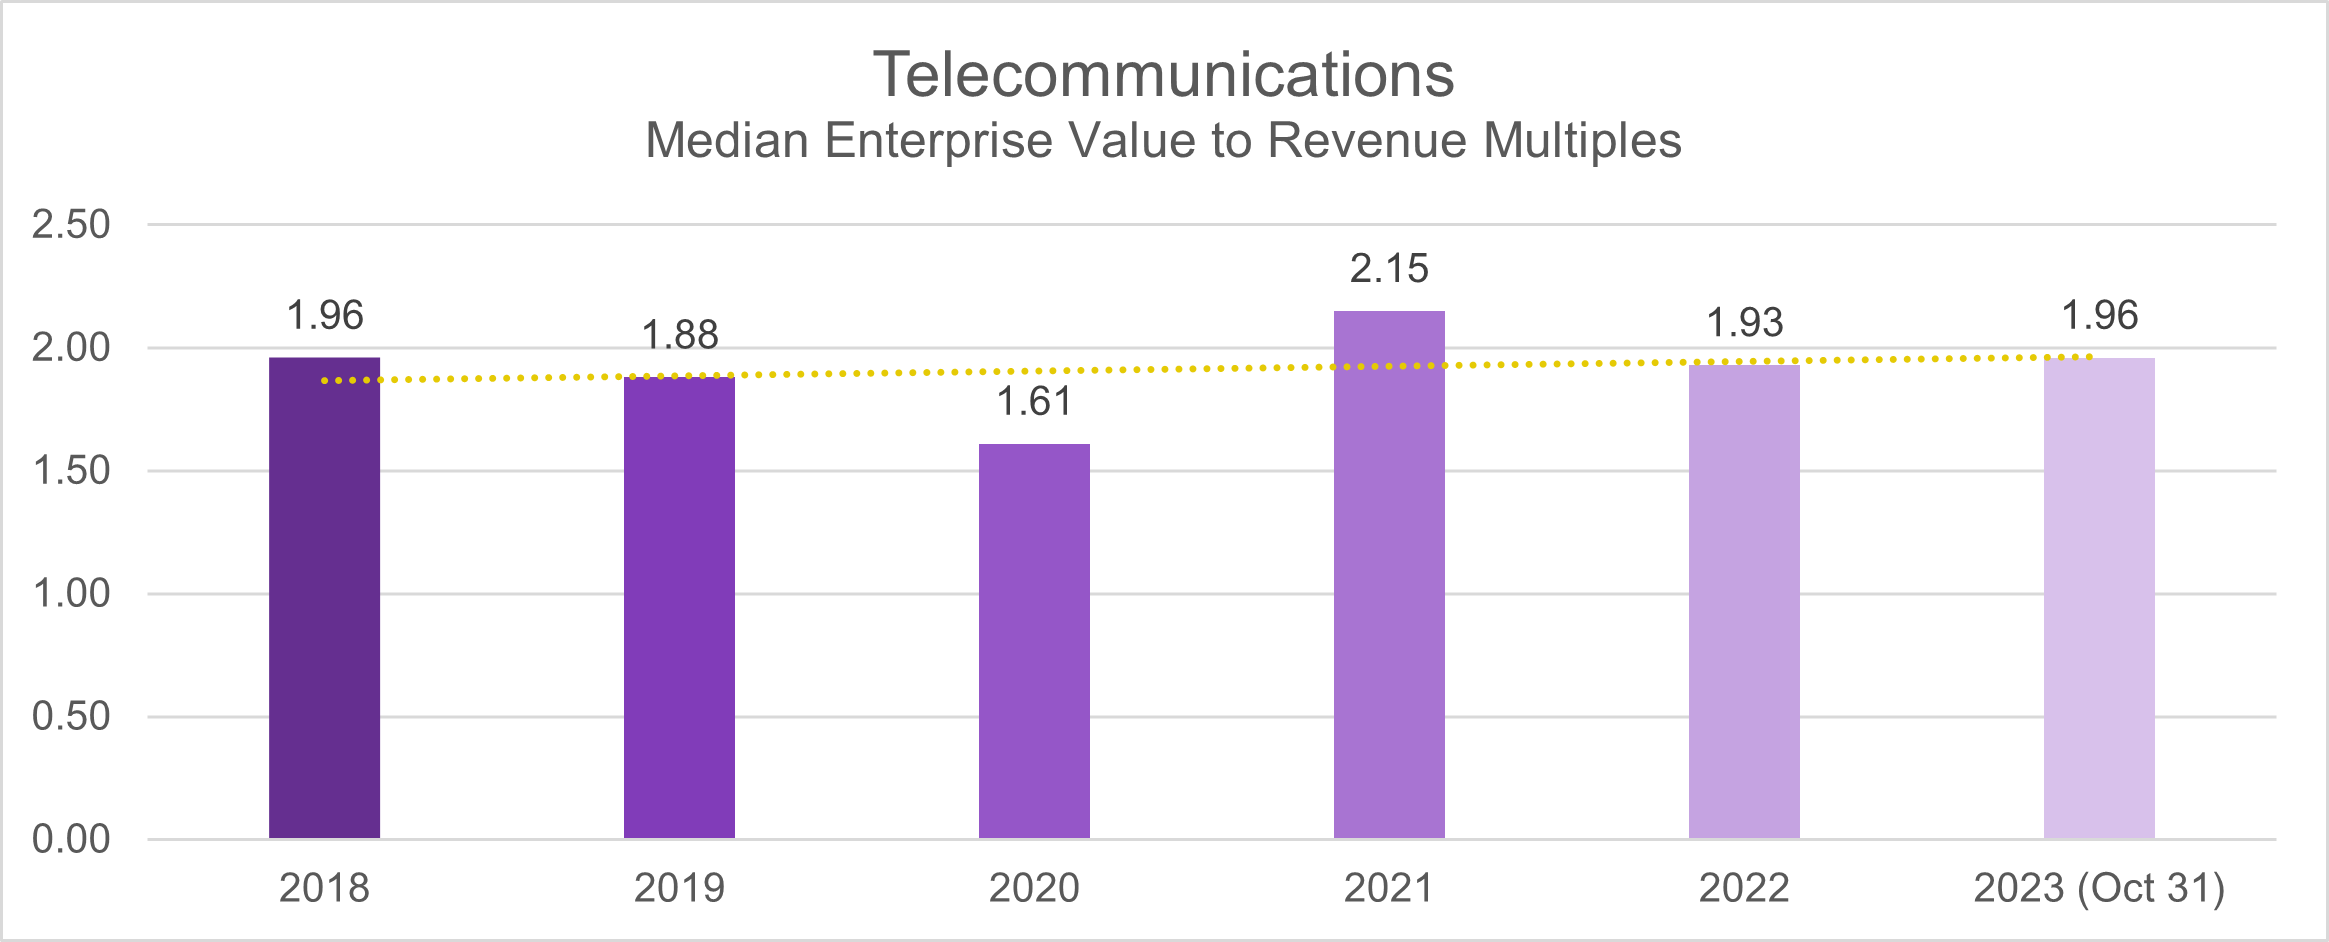
In the pre-pandemic period of 2018-2019, the median deal multiples were 1.96 and 1.88, respectively. As the pandemic unfolded in 2020, there was a slight contraction, with the median deal multiple dipping to 1.6. However, by 2021, the sector exhibited resilience, bouncing back to reach a peak in deal multiples median of 2.15. In the post-pandemic landscape, the industry displayed stability, with deal multiples consistently settling at 1.9 from 2022 to October 2023.
This blog is part of IMAA’s report on Thriving in Turbulence? M&A Valuations in the Age of High Interest Rates
TAGS:


Stay up to date with M&A news!
Subscribe to our newsletter
