BlogThriving in Turbulence? M&A Valuations in the Age of High Interest Rates
Blog
Thriving in Turbulence? M&A Valuations in the Age of High Interest Rates
IMAA
SHARE:
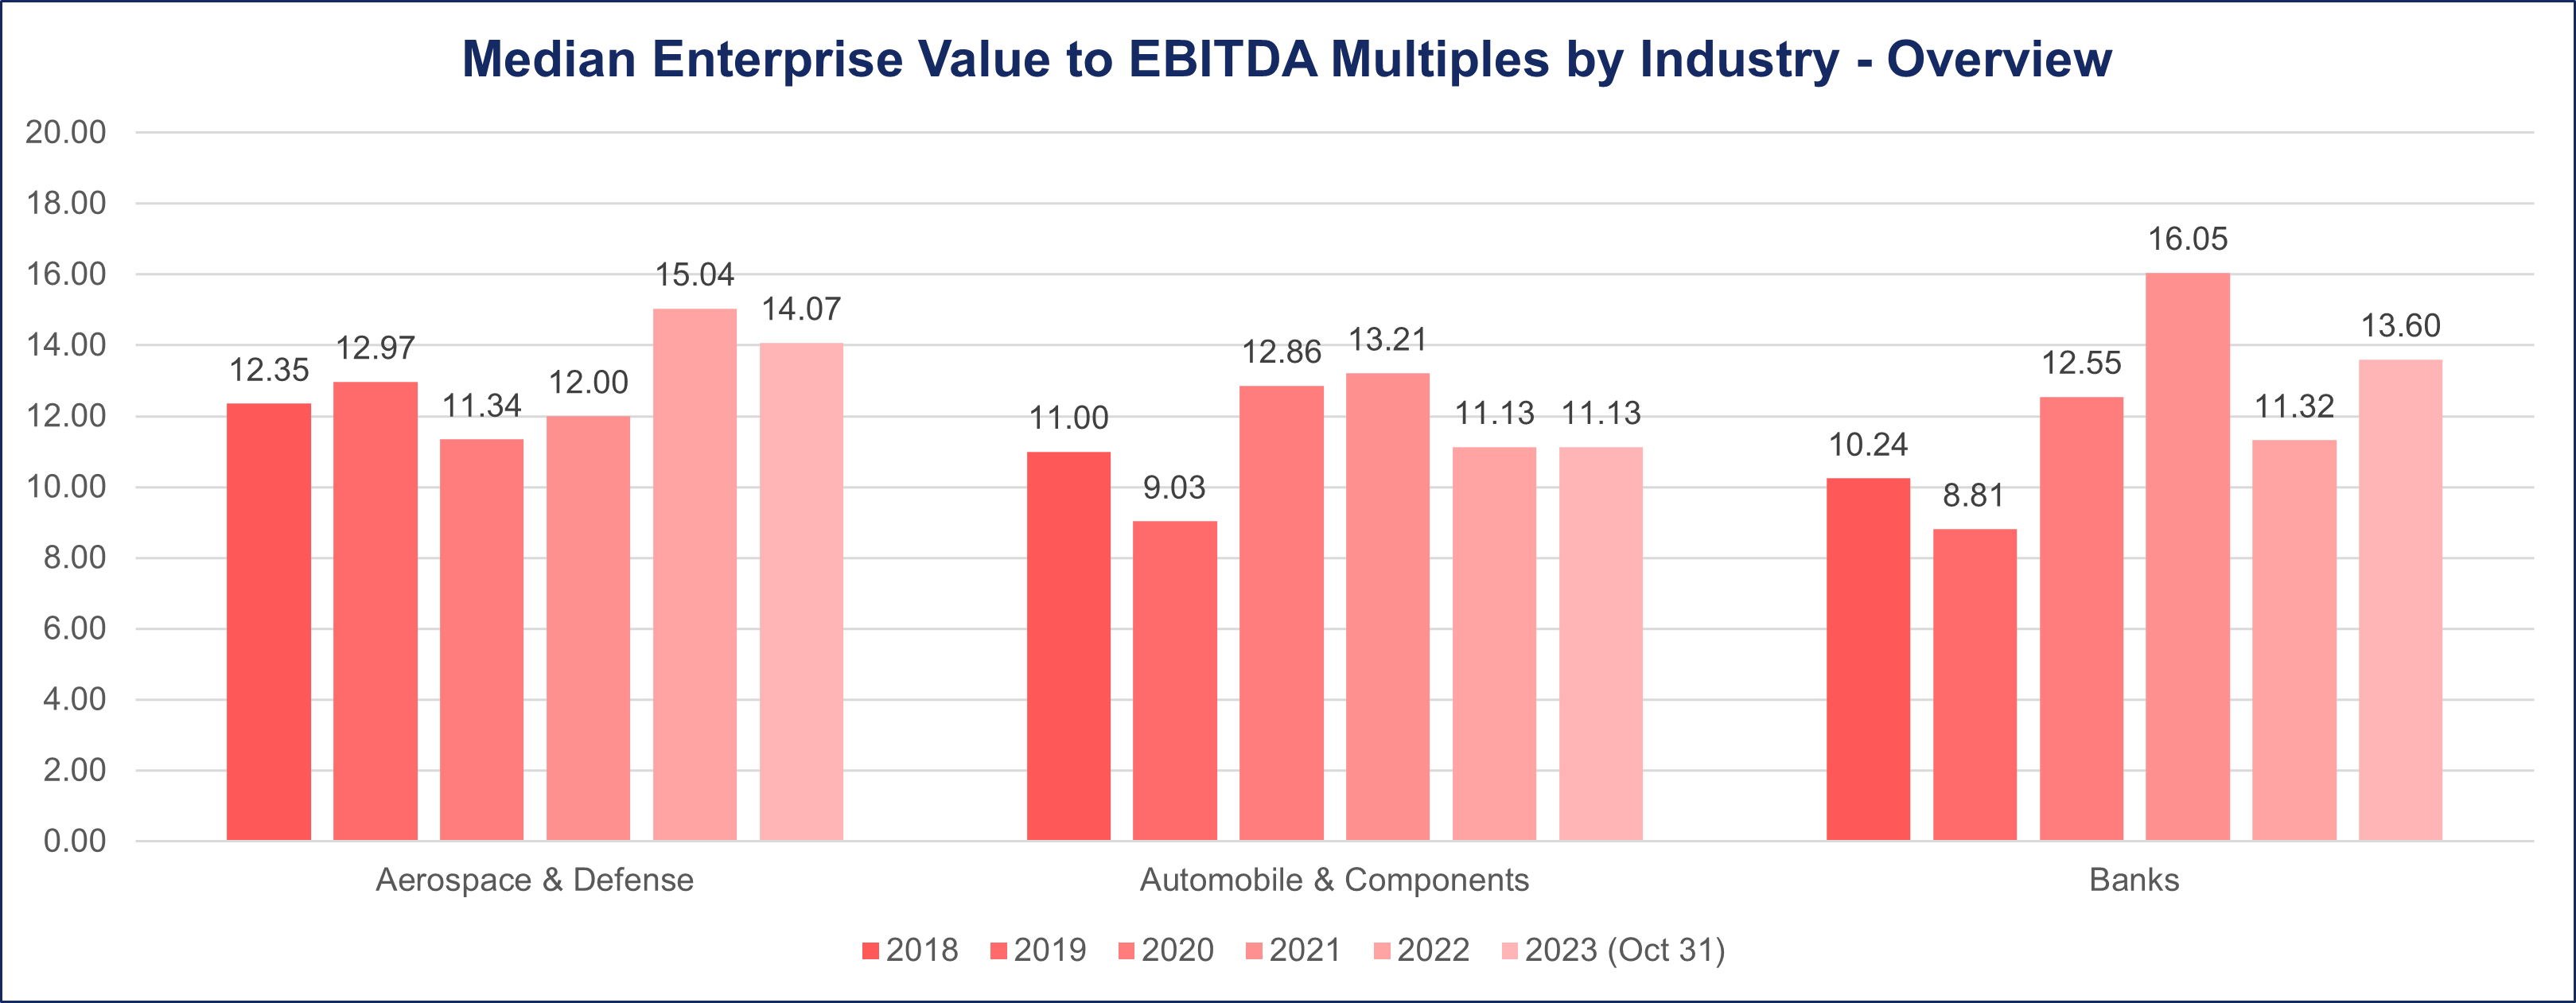
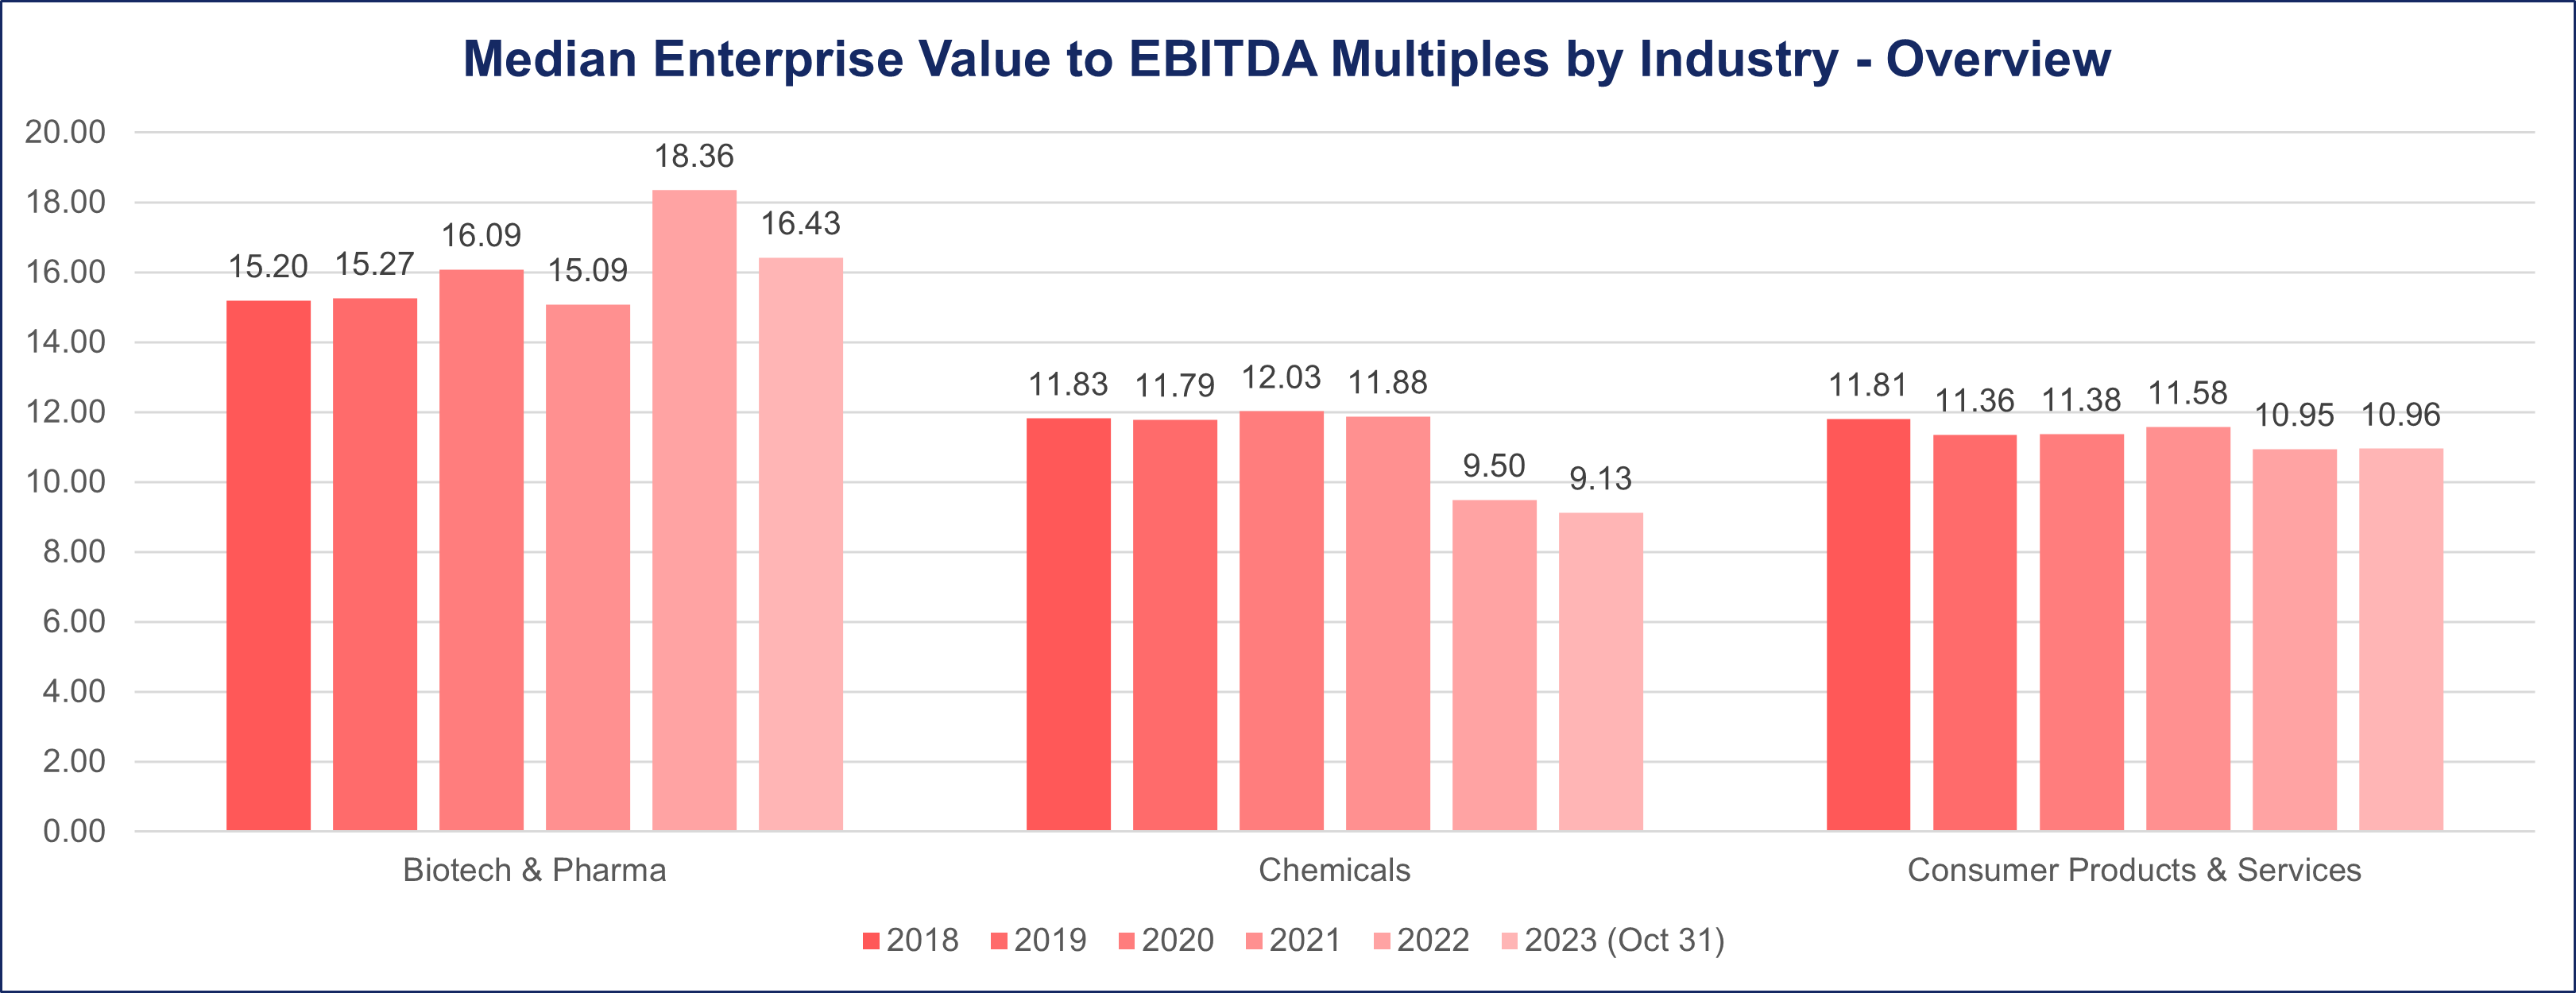
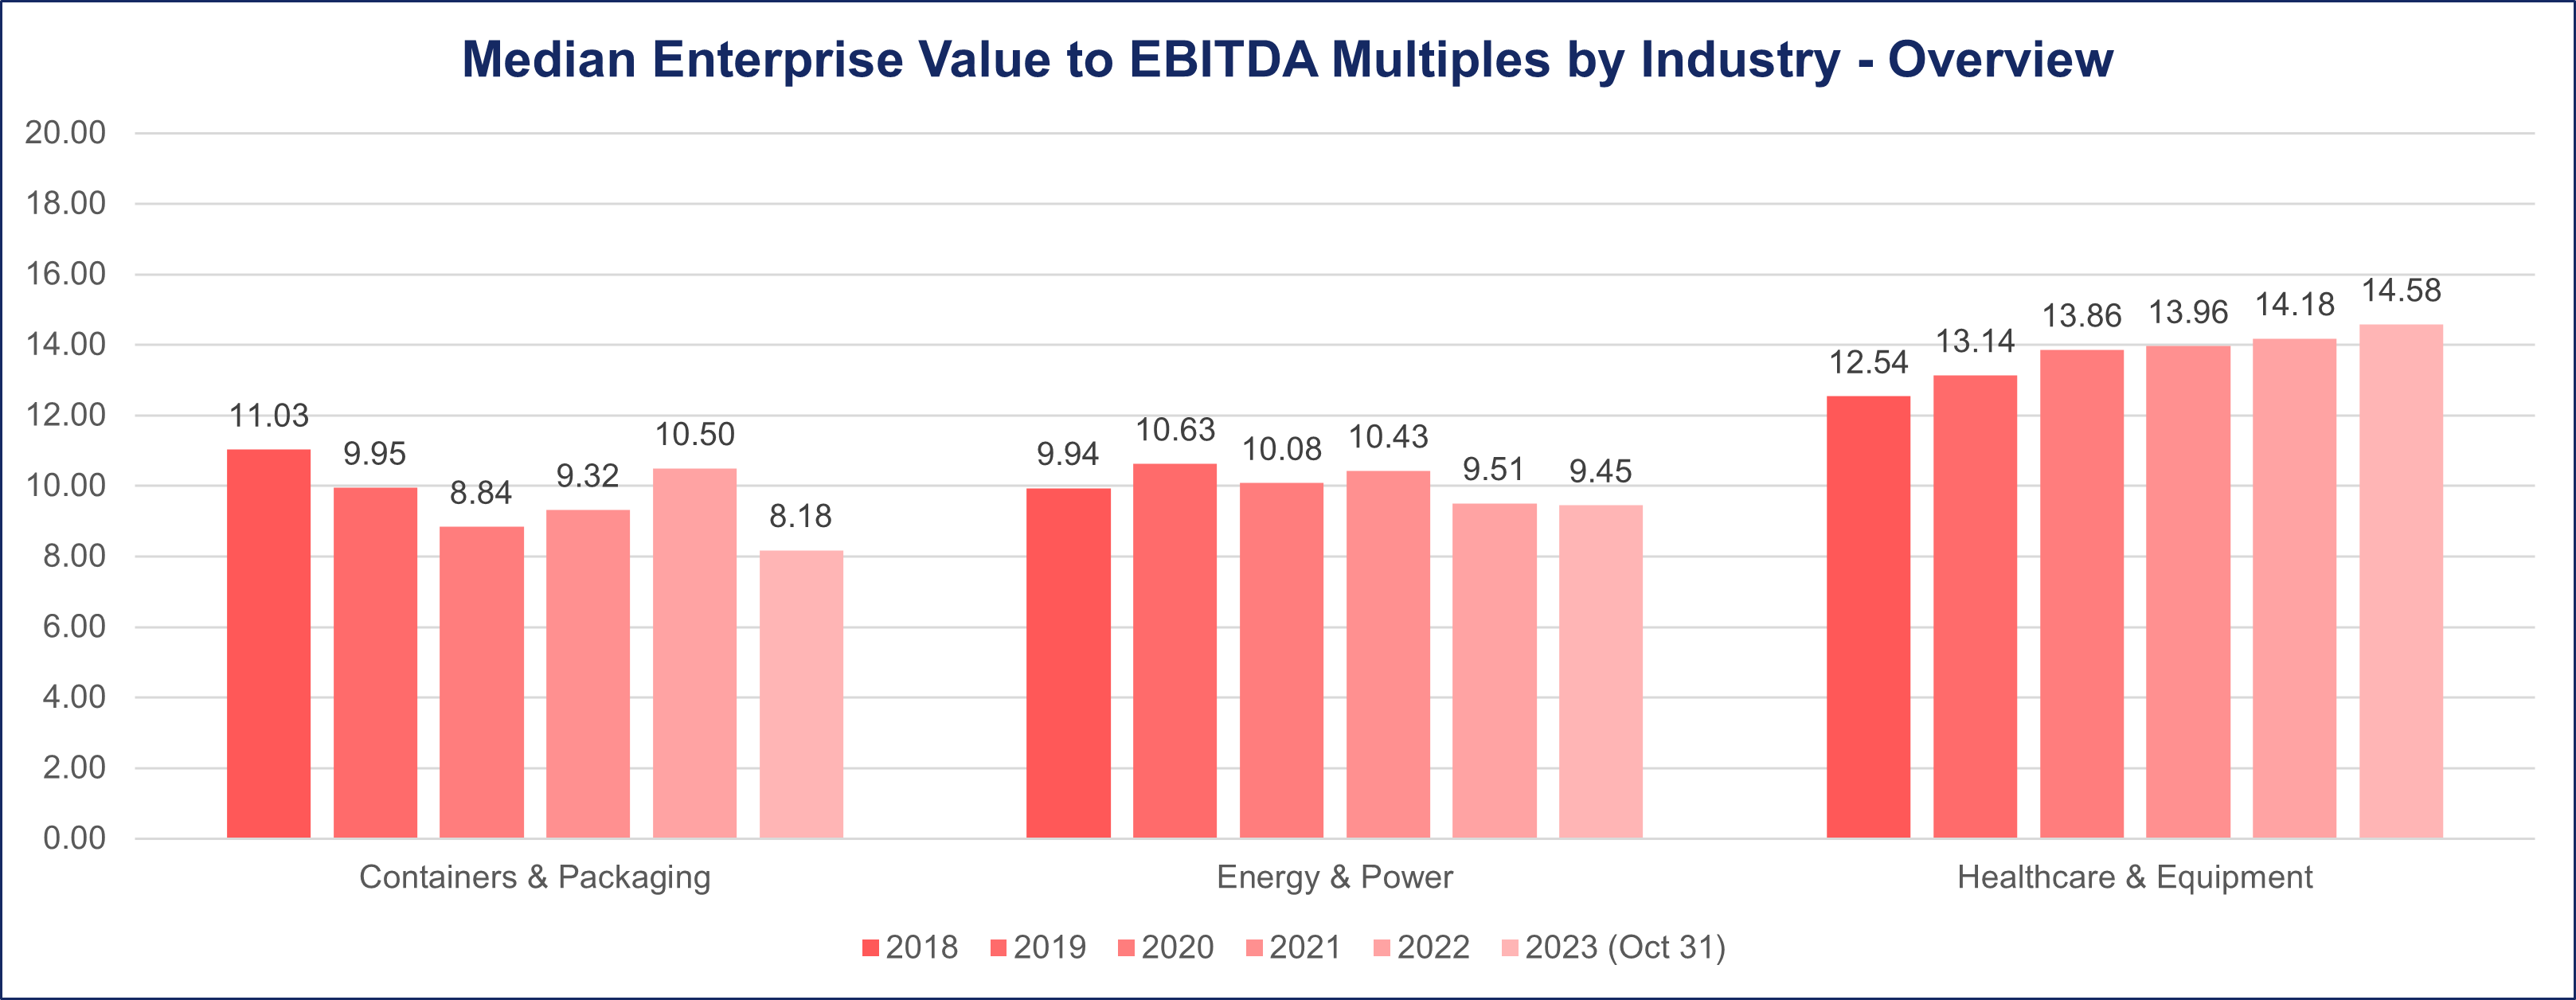
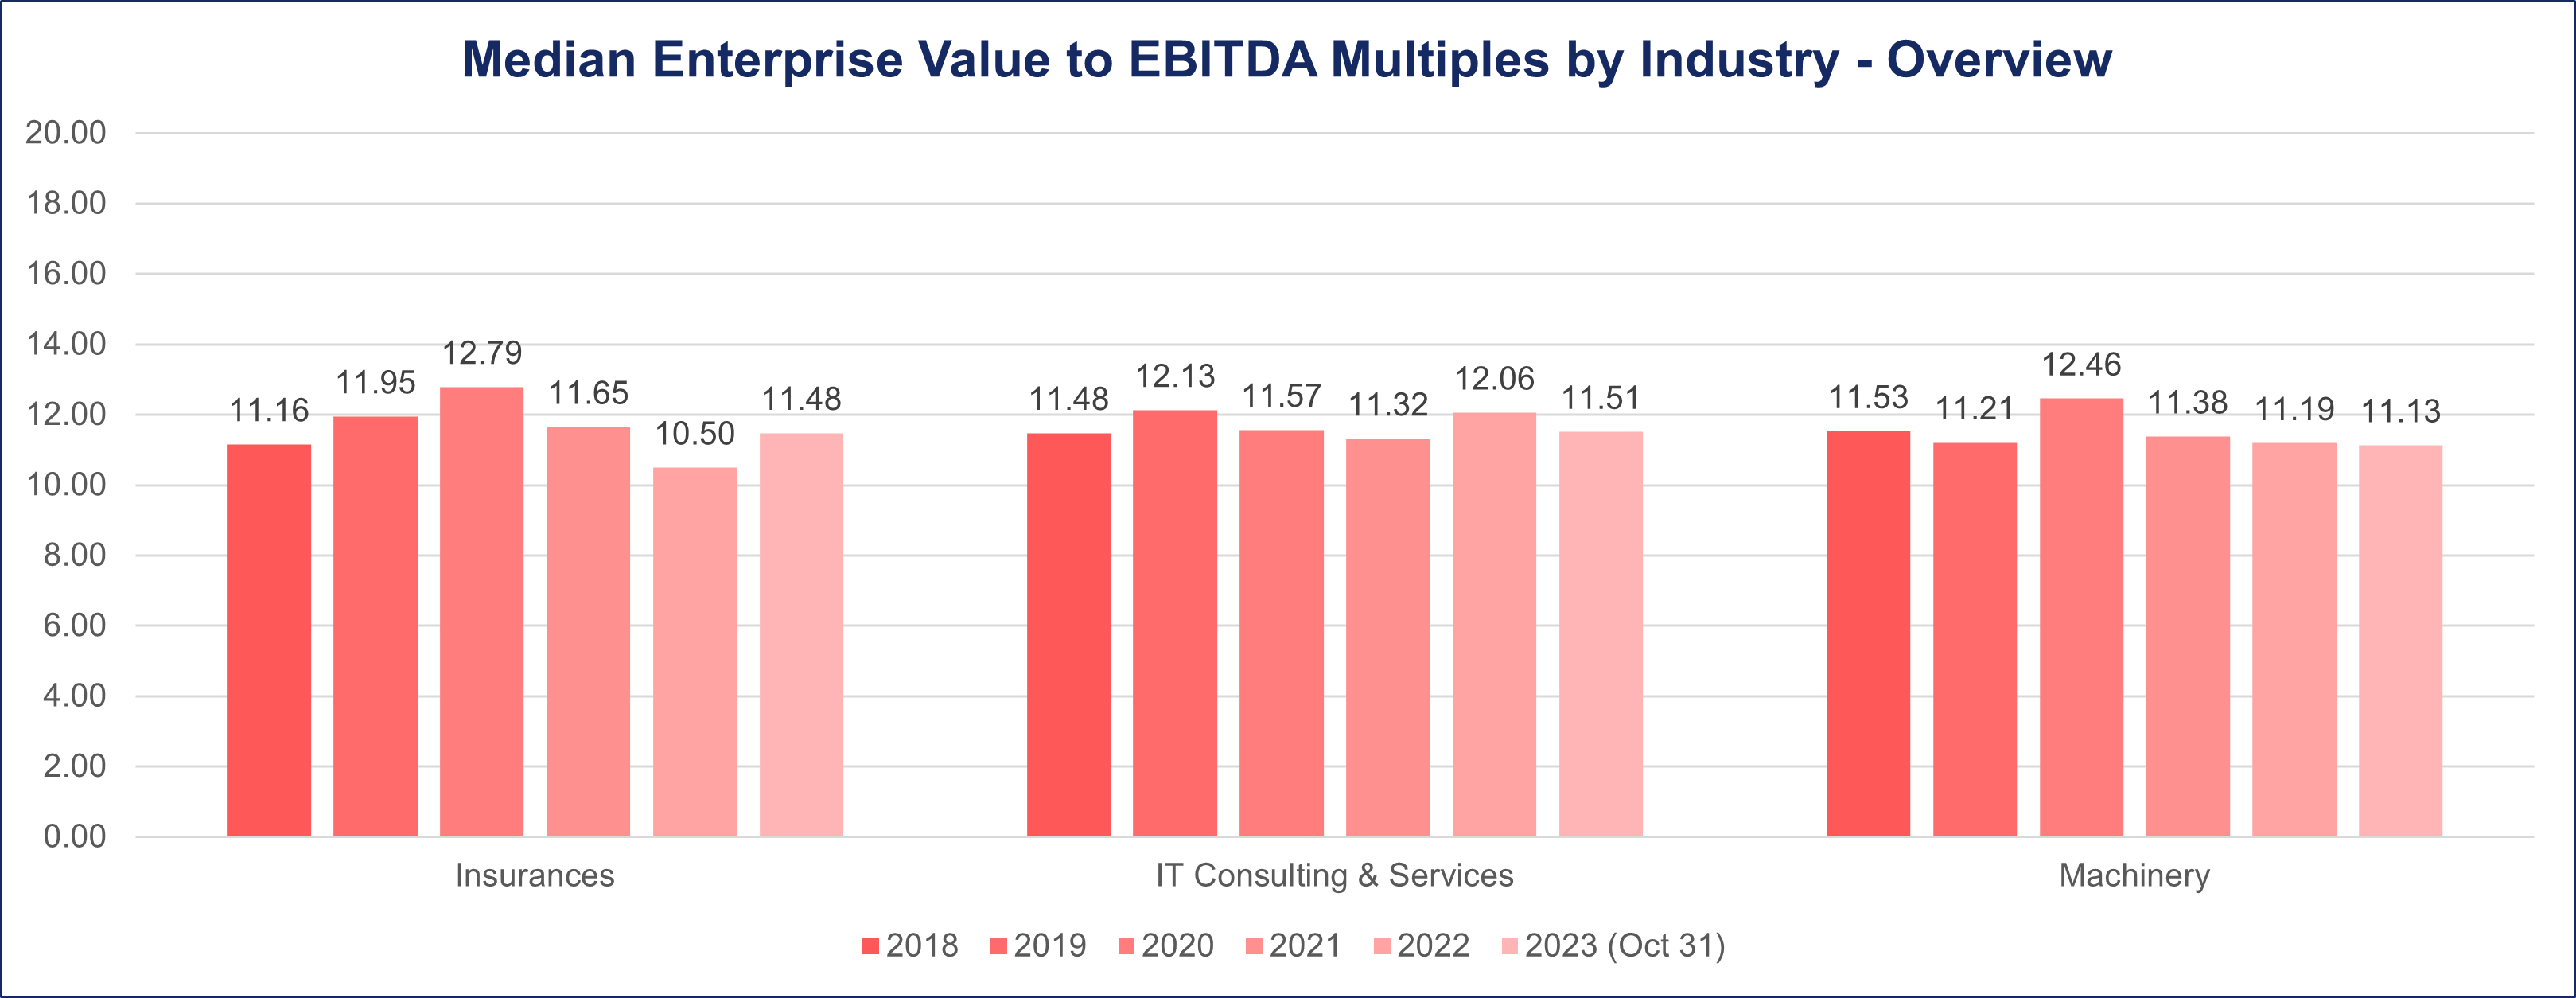
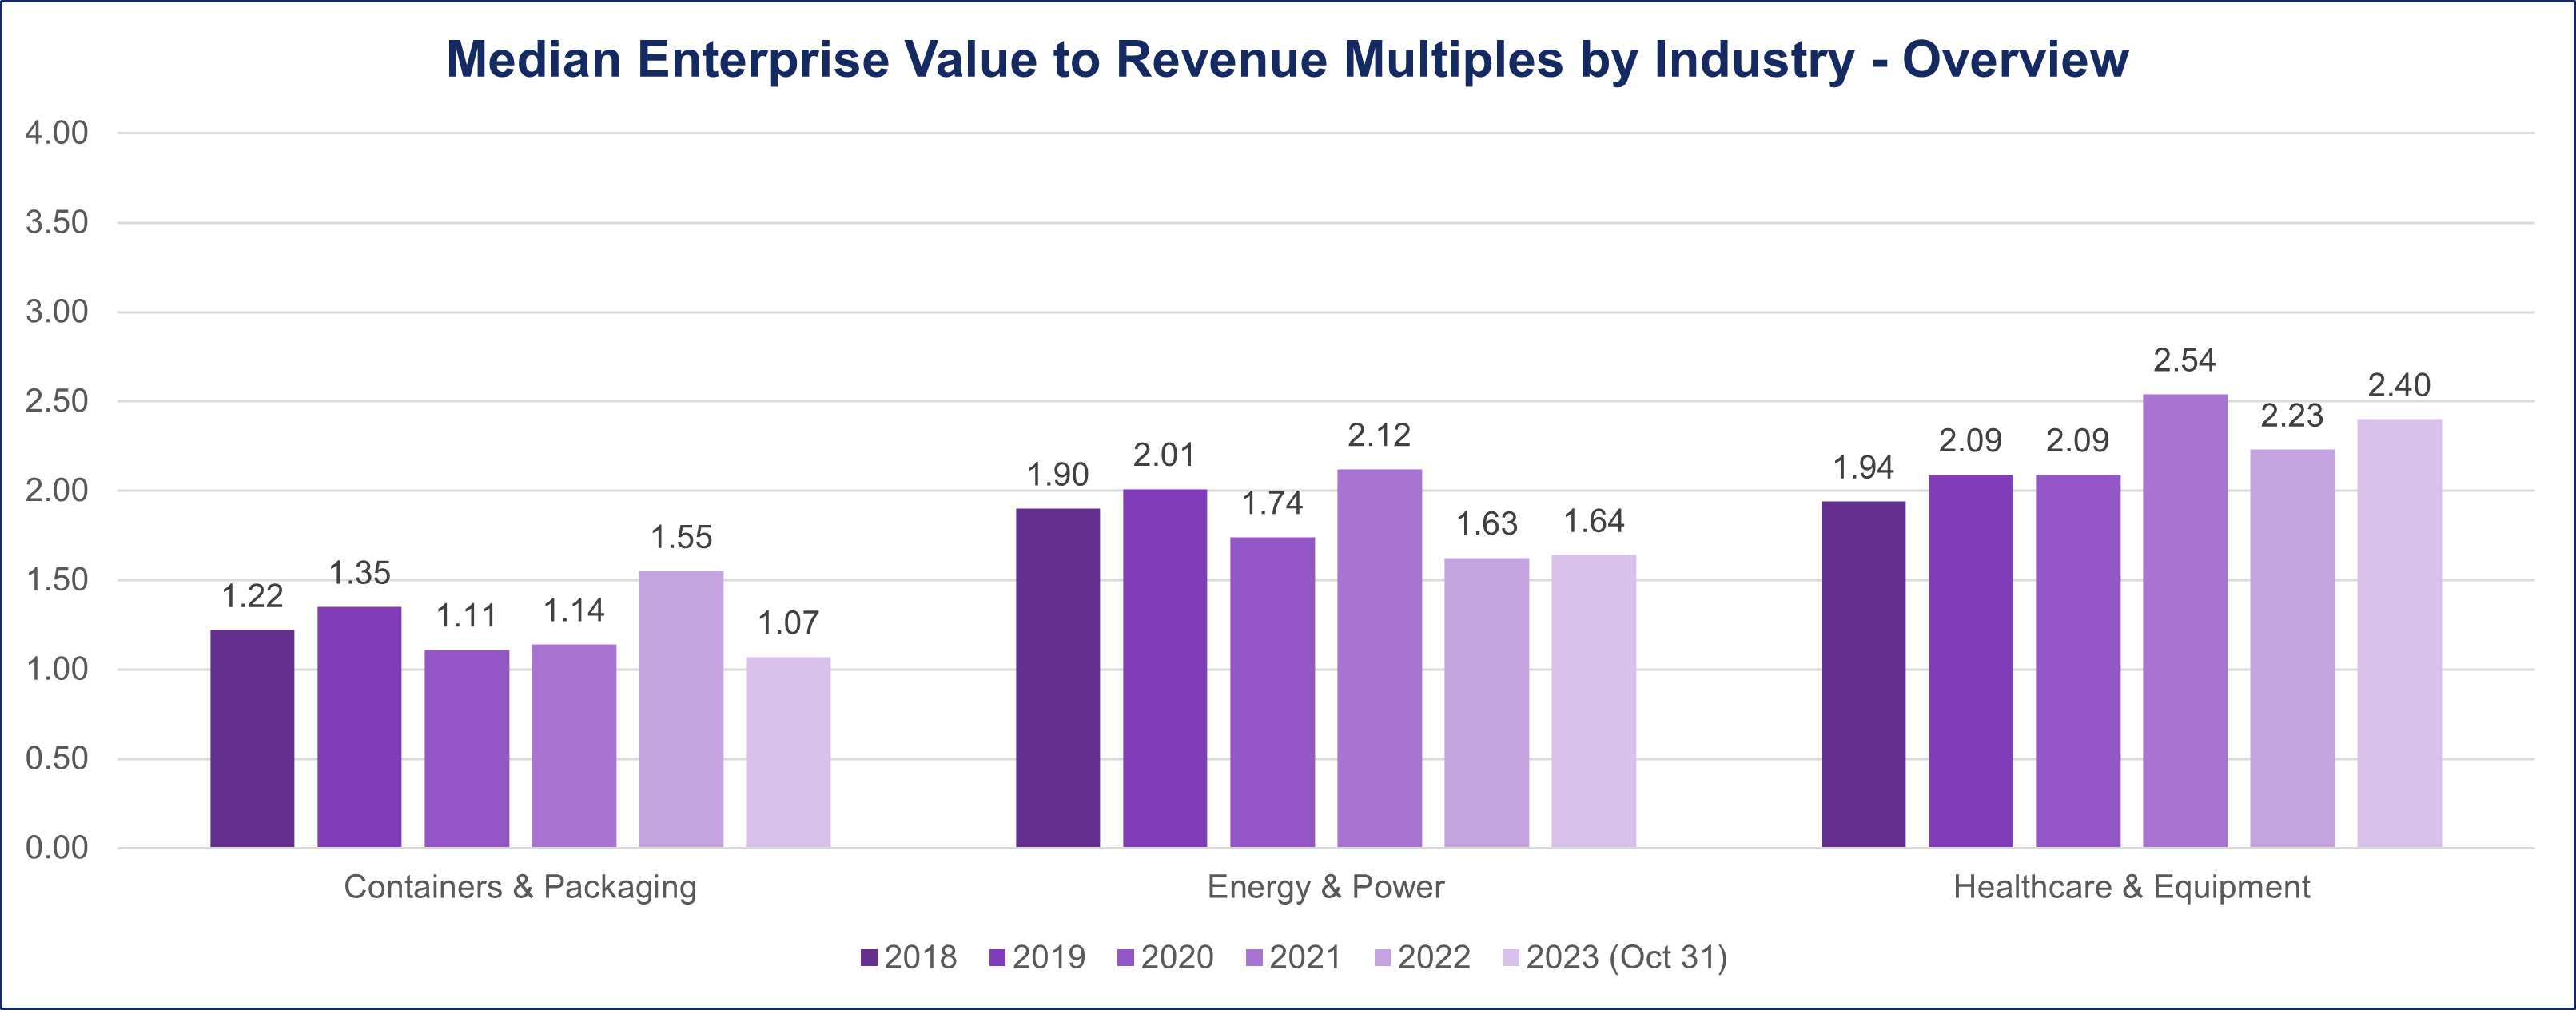
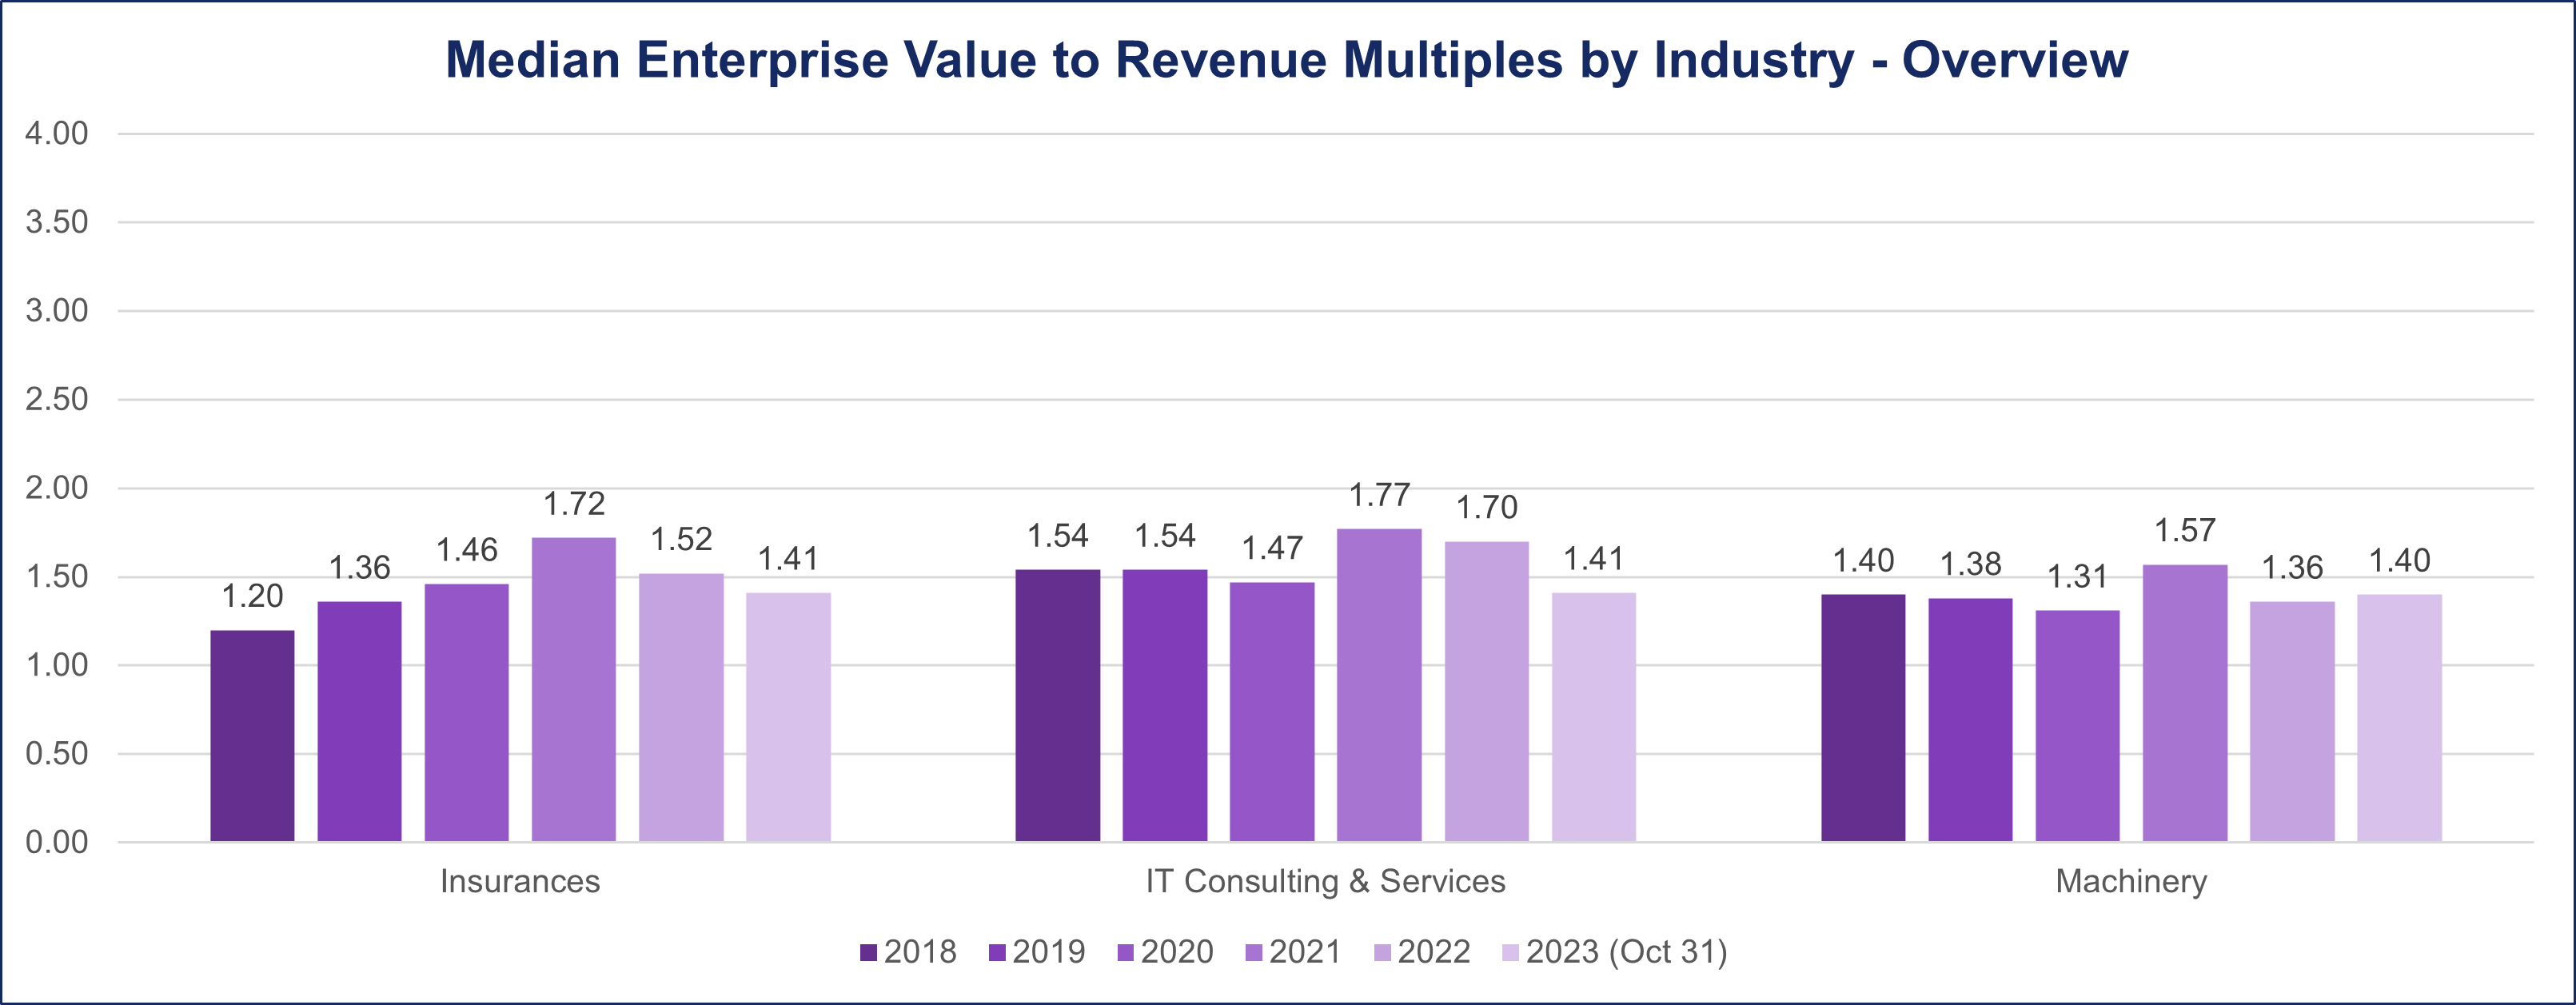
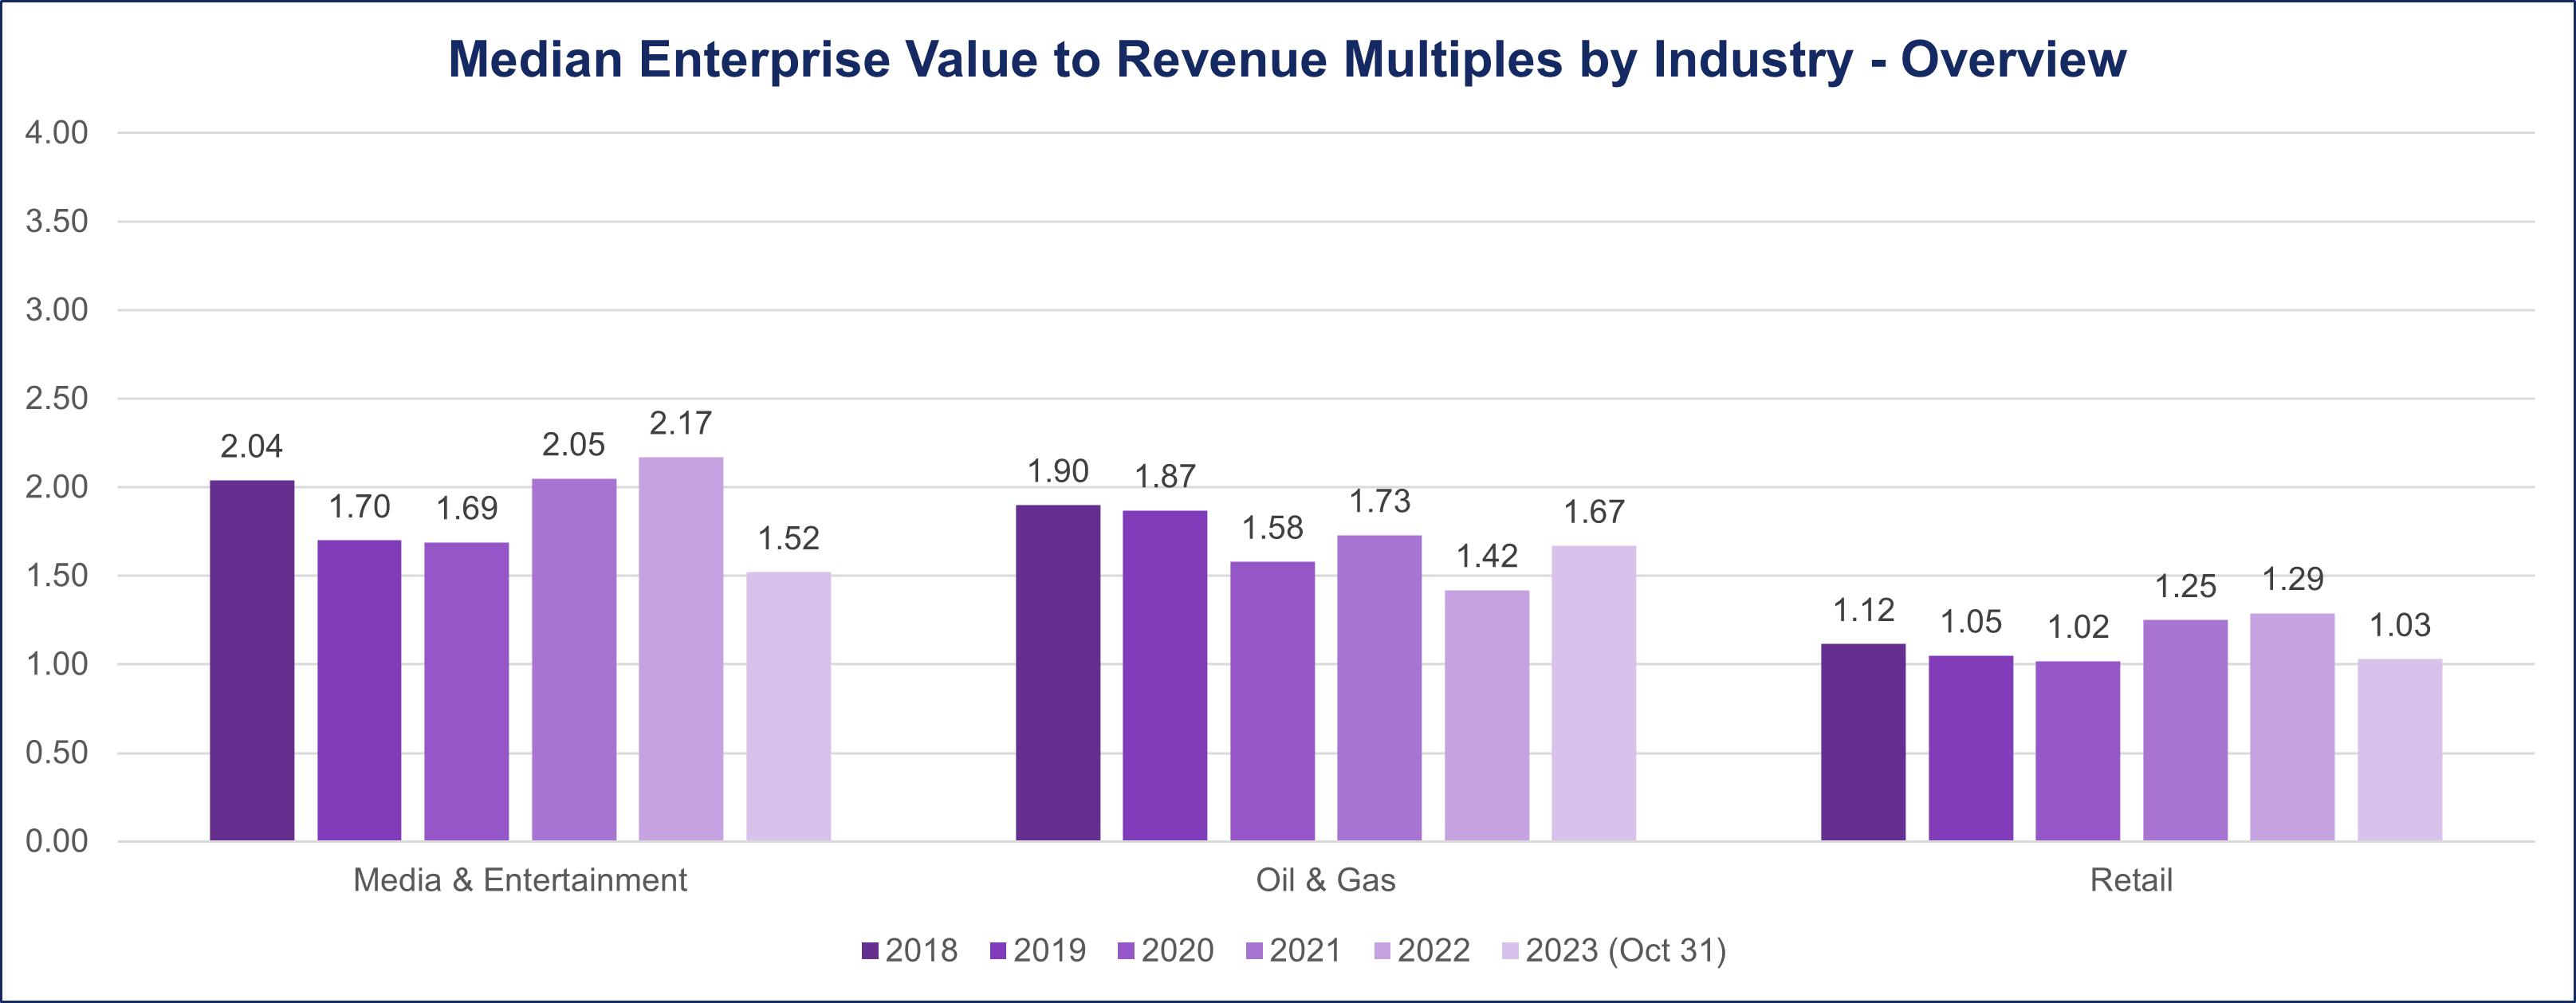
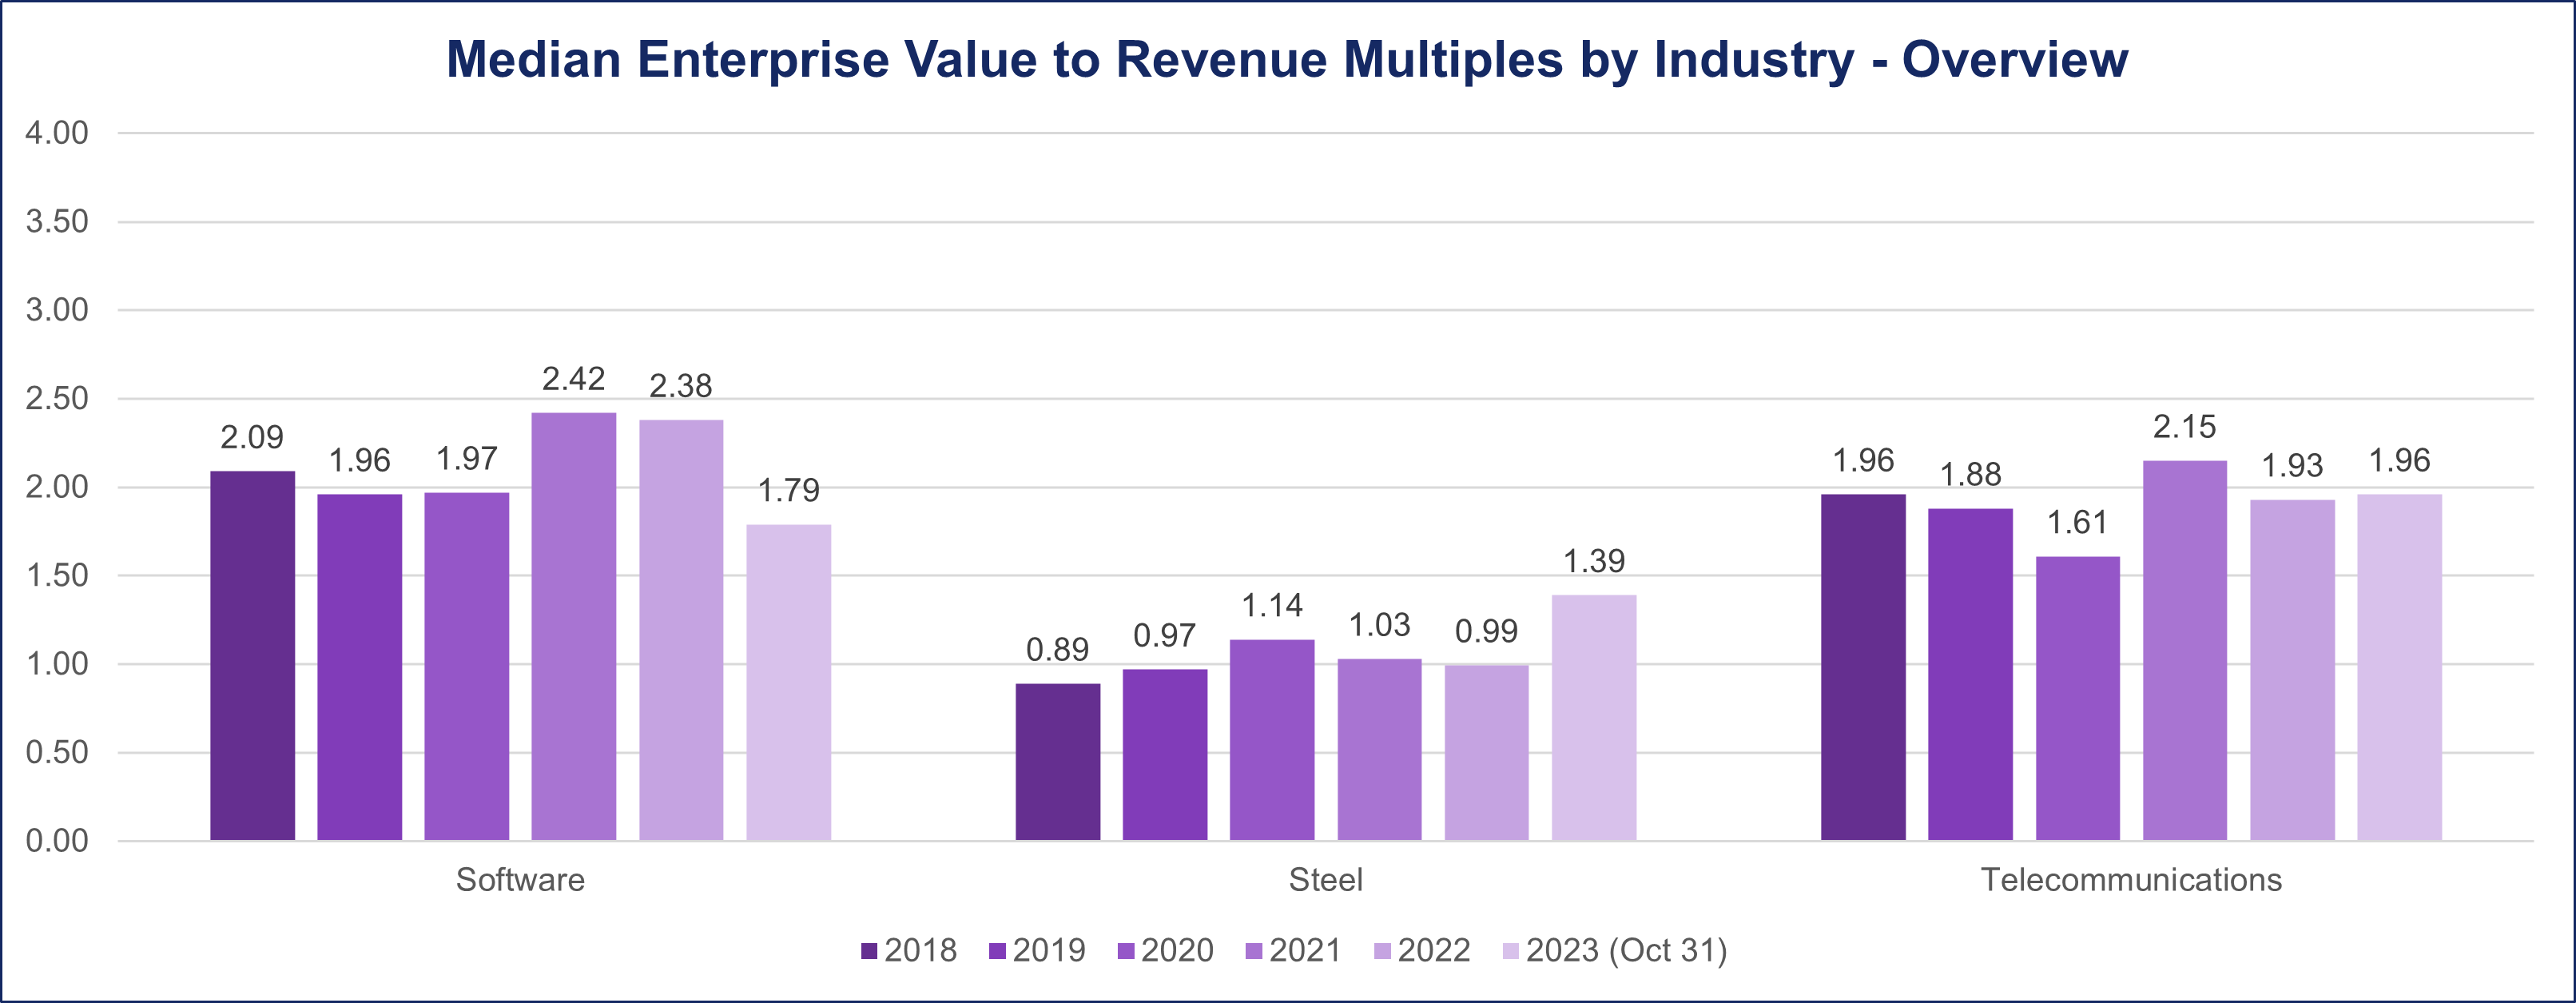
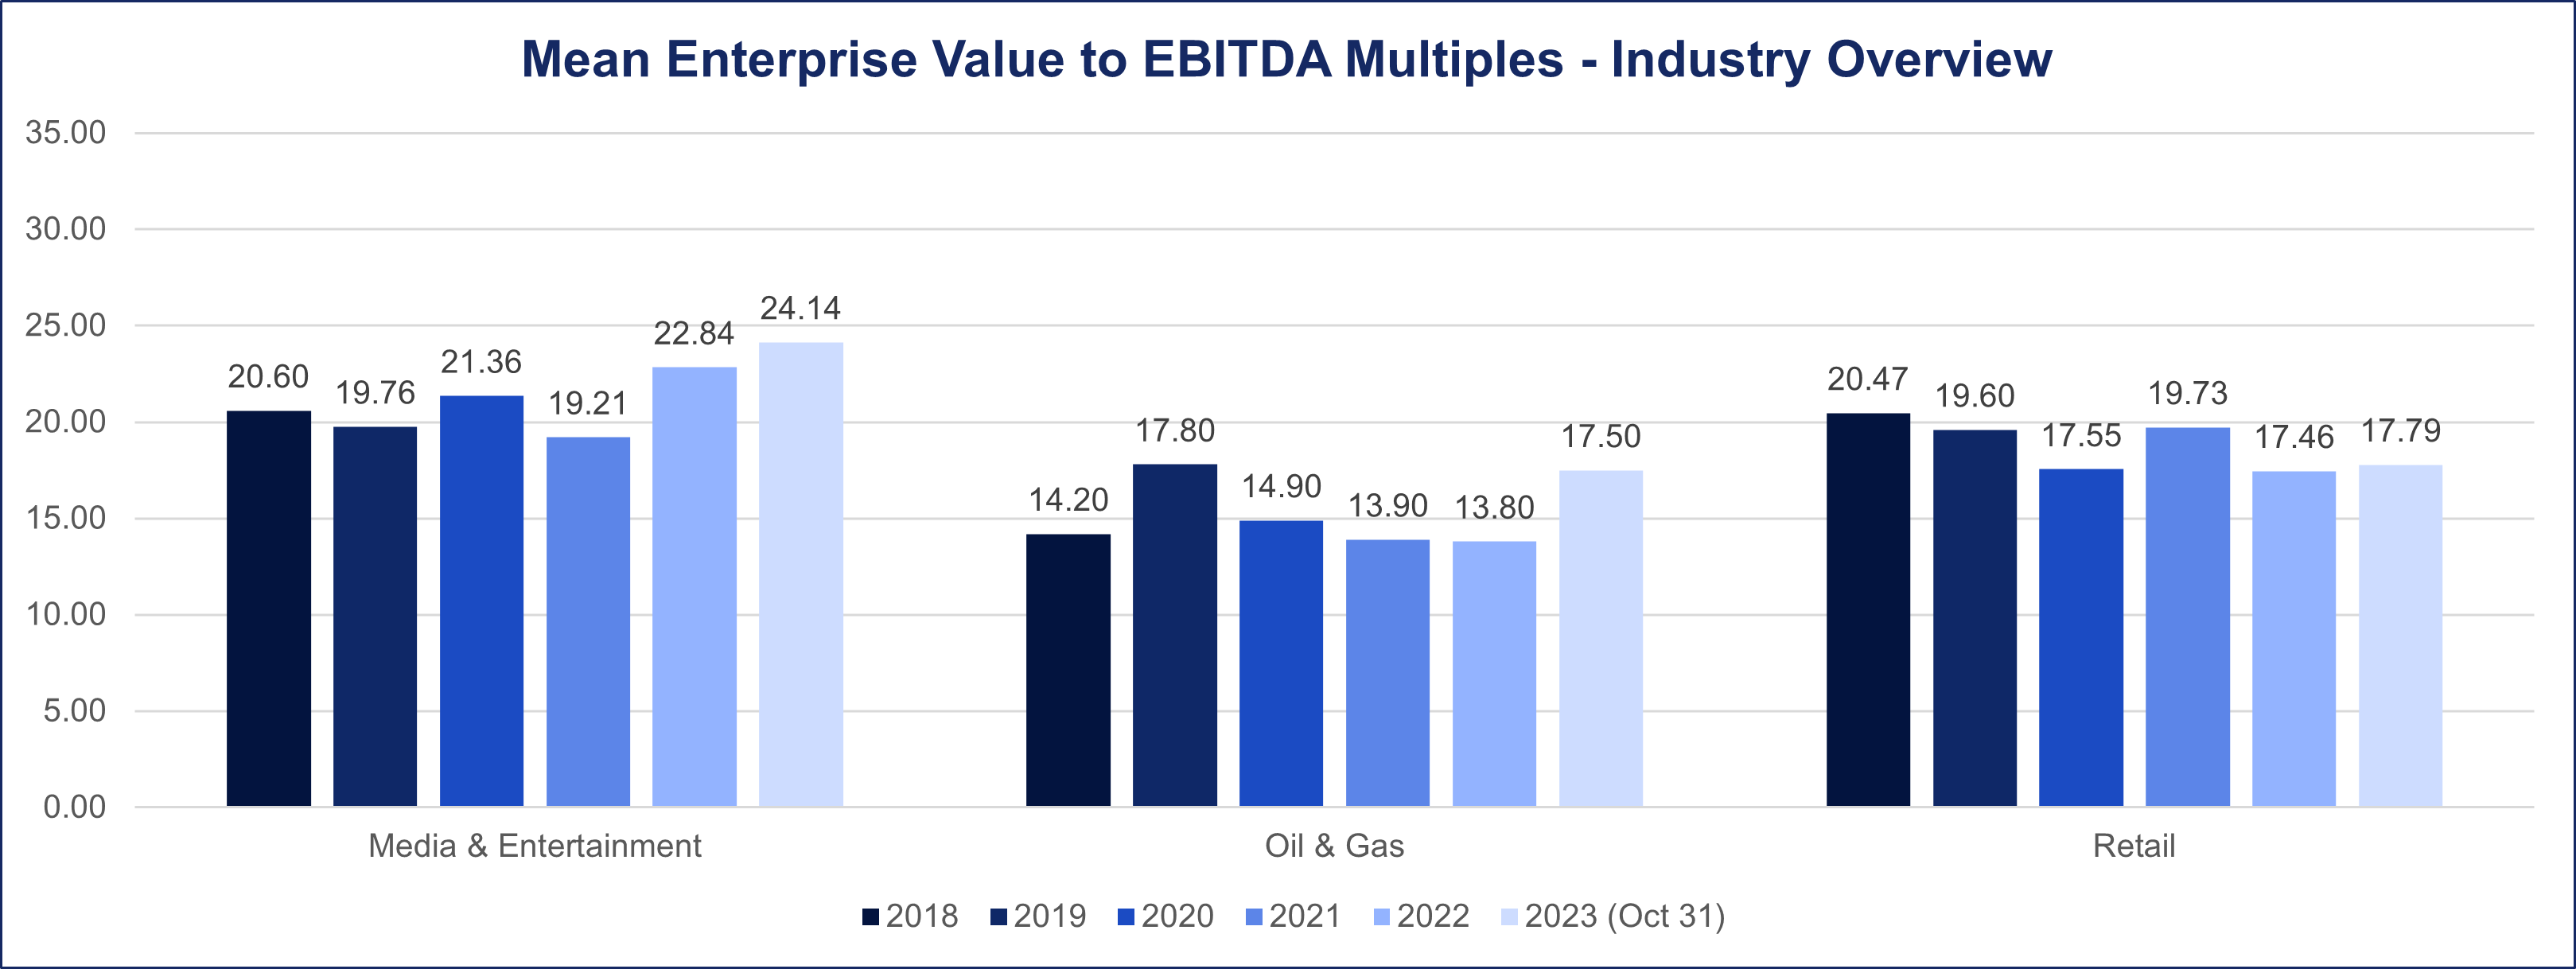
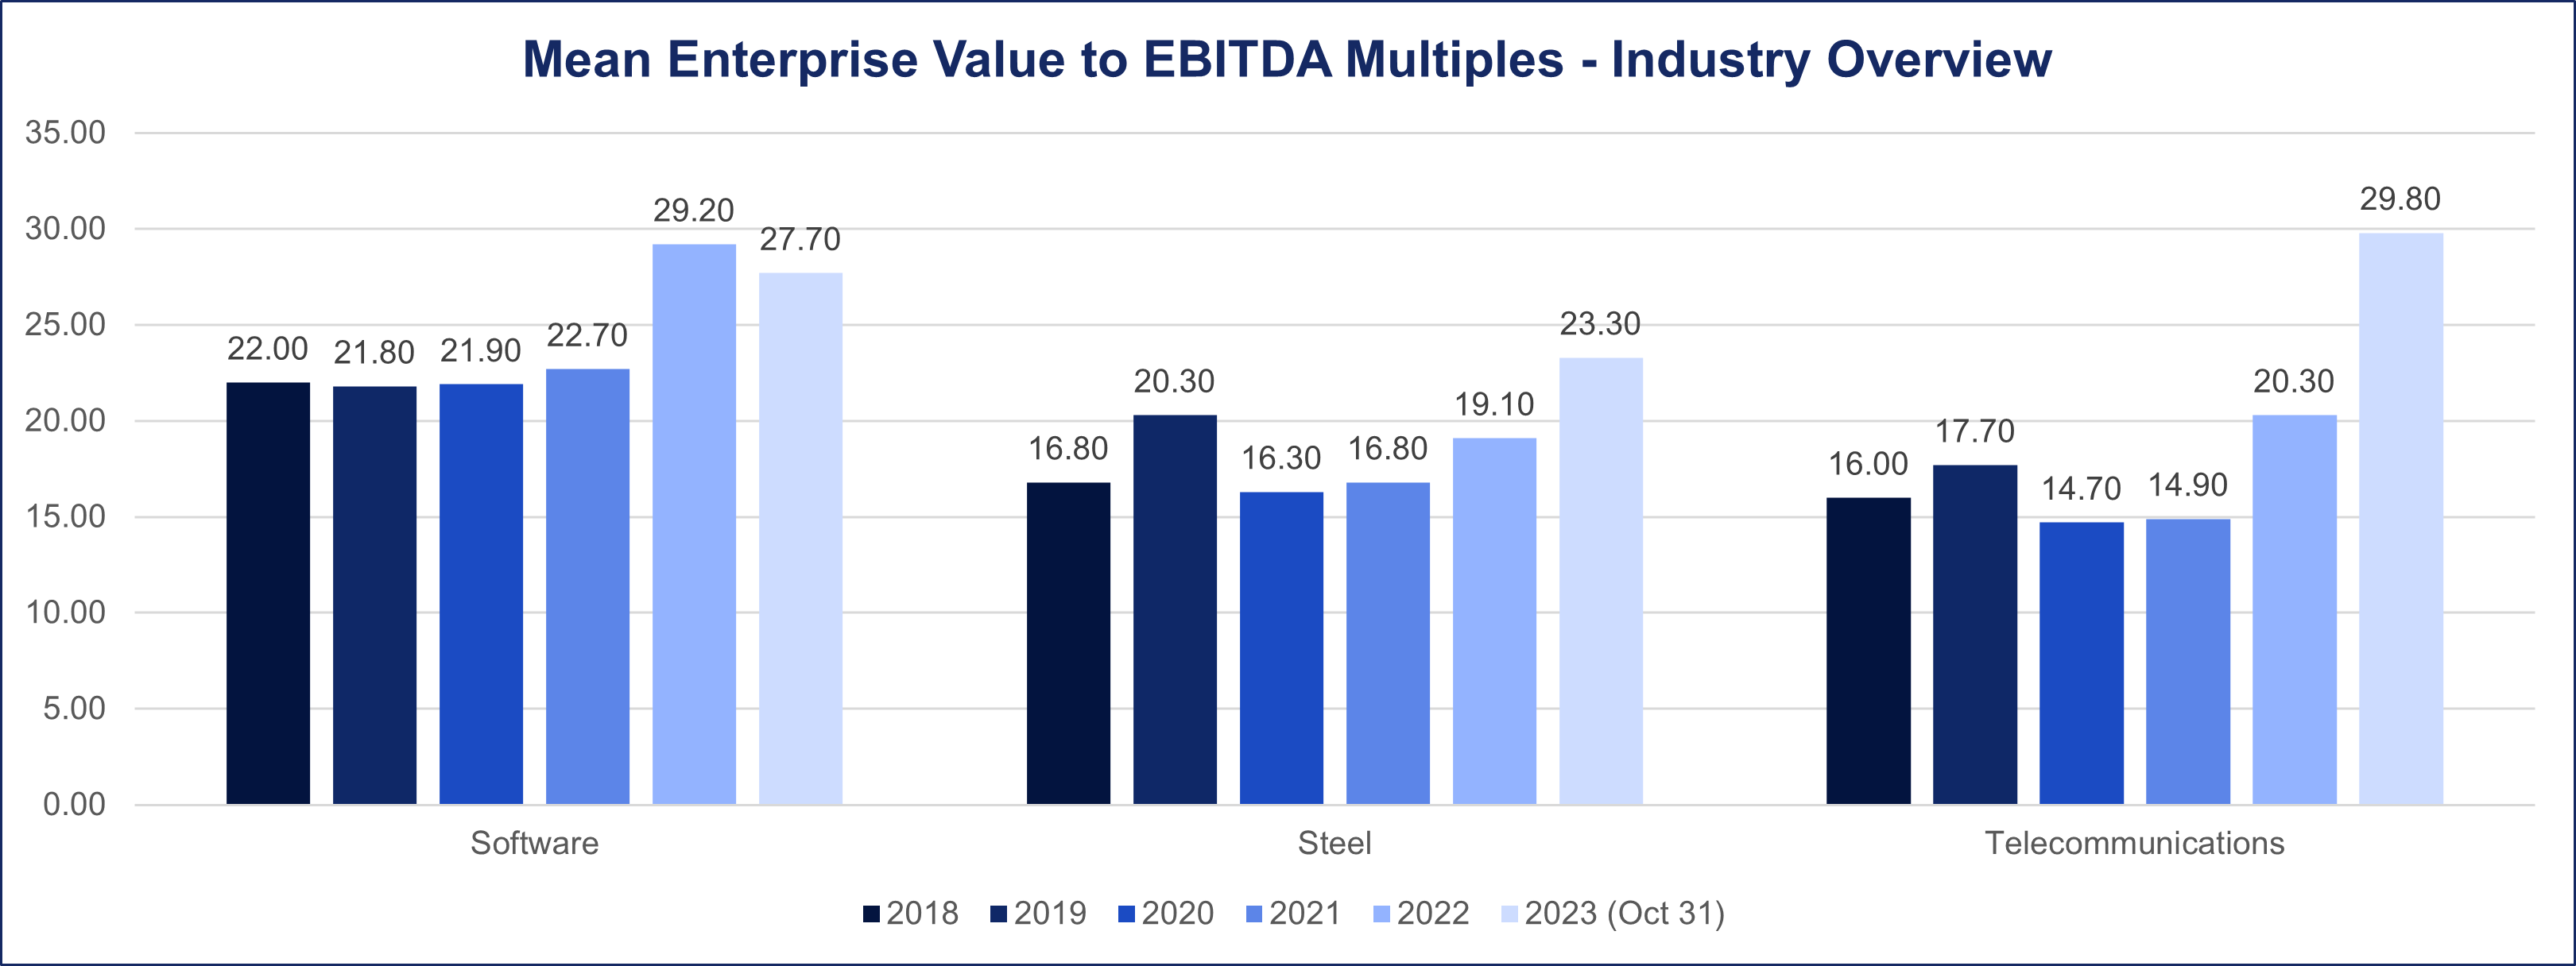
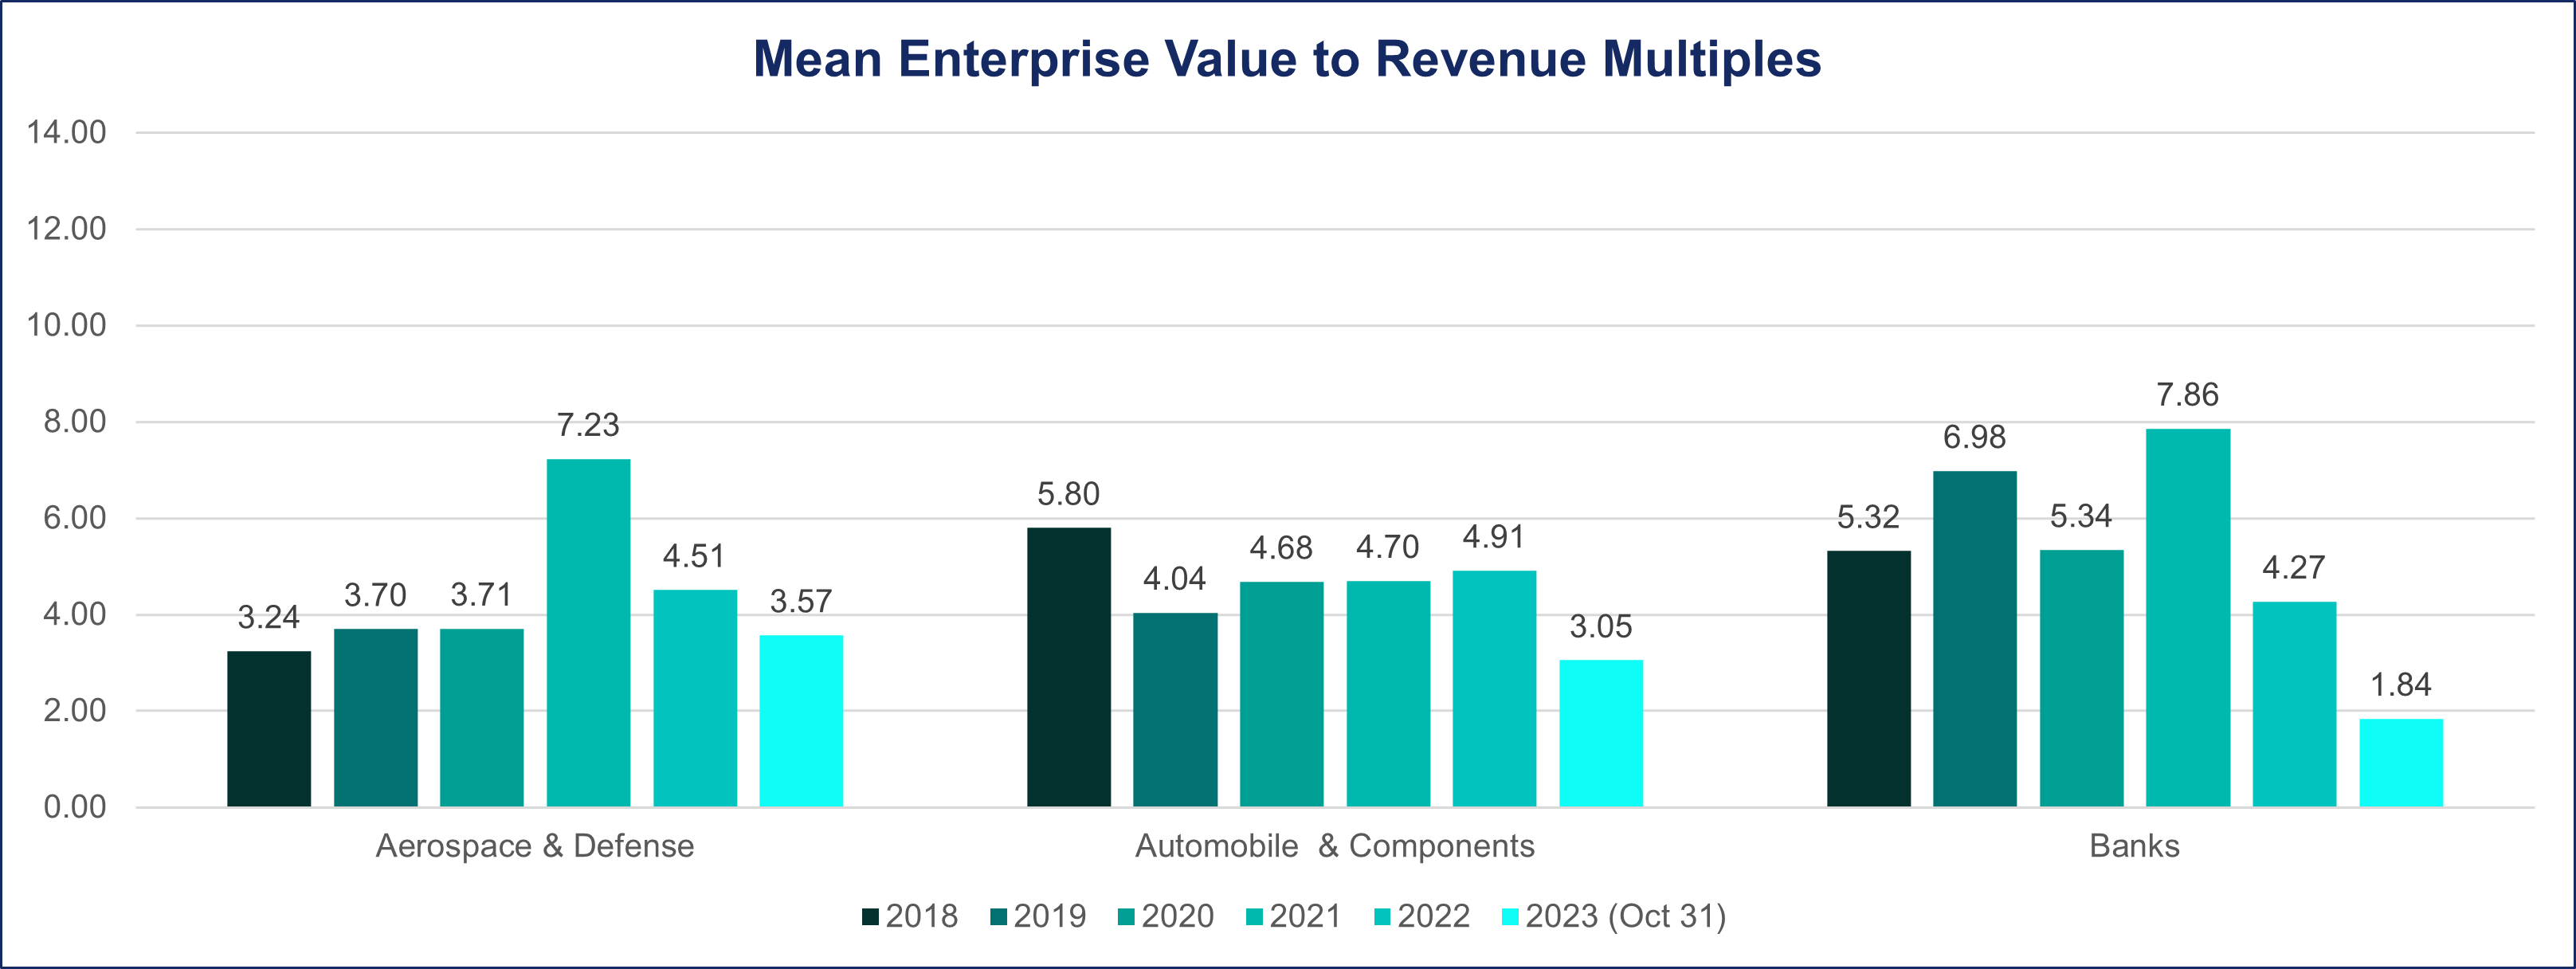
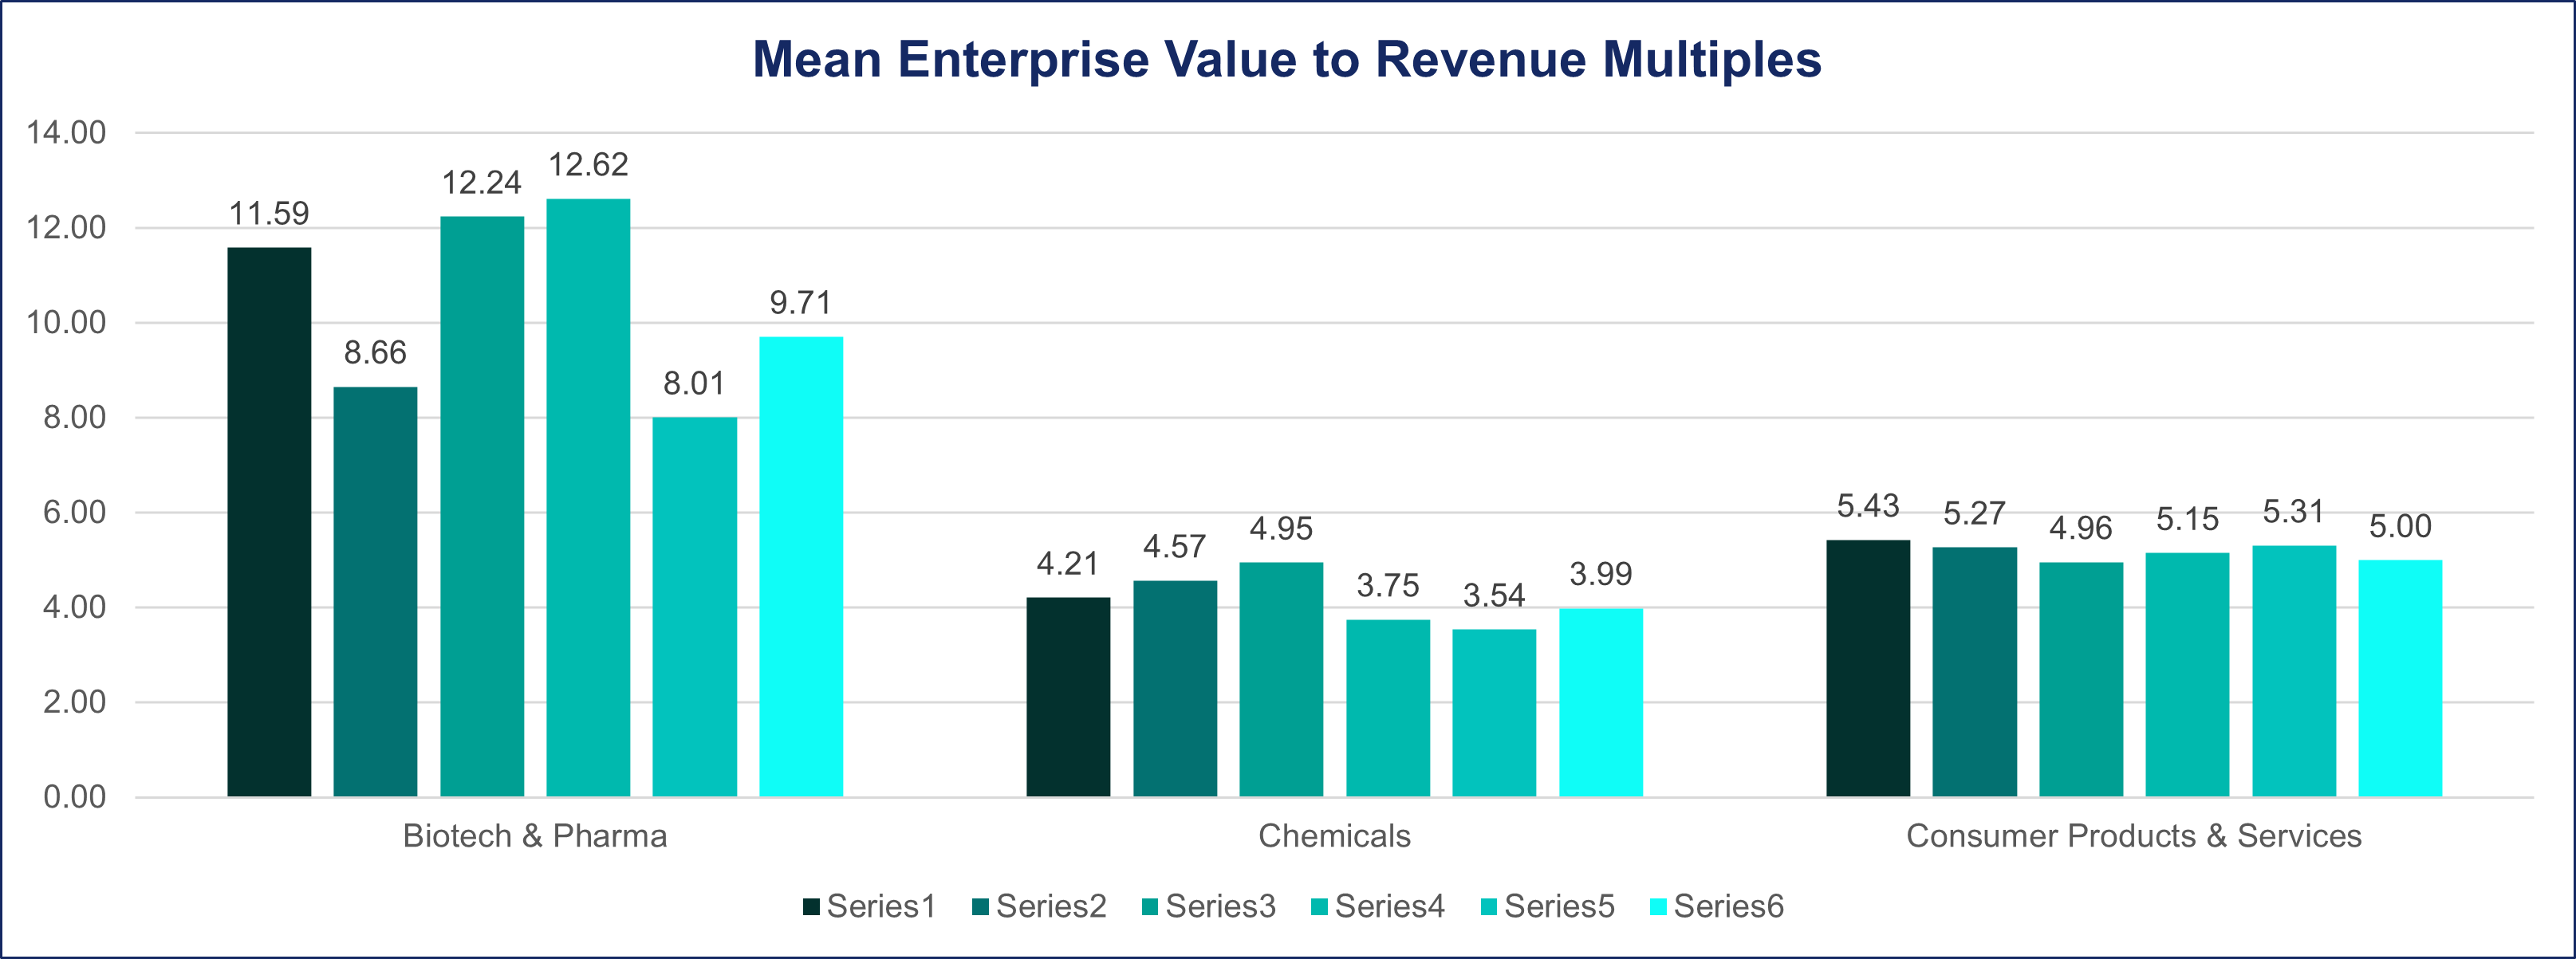
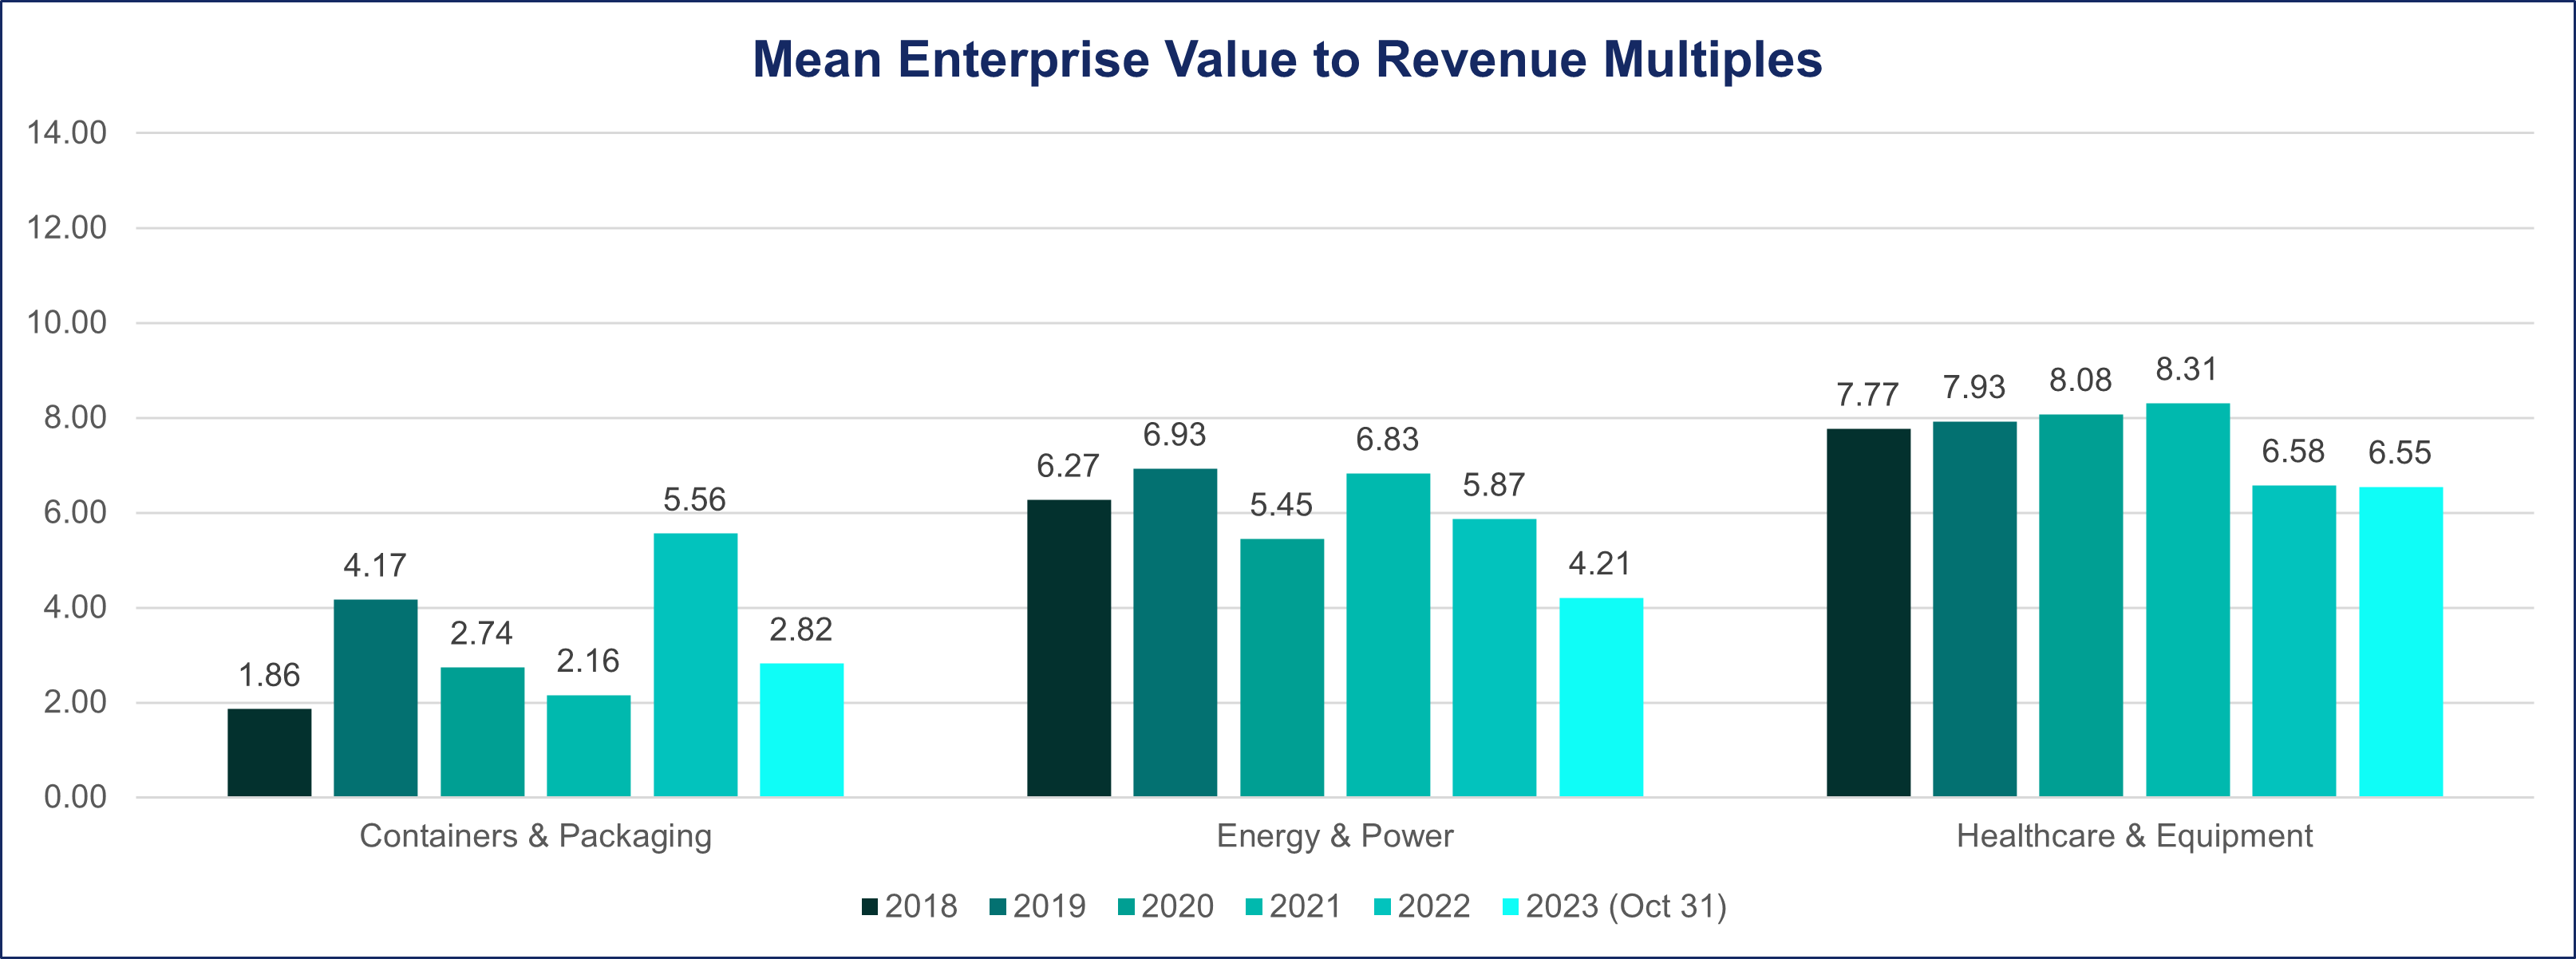
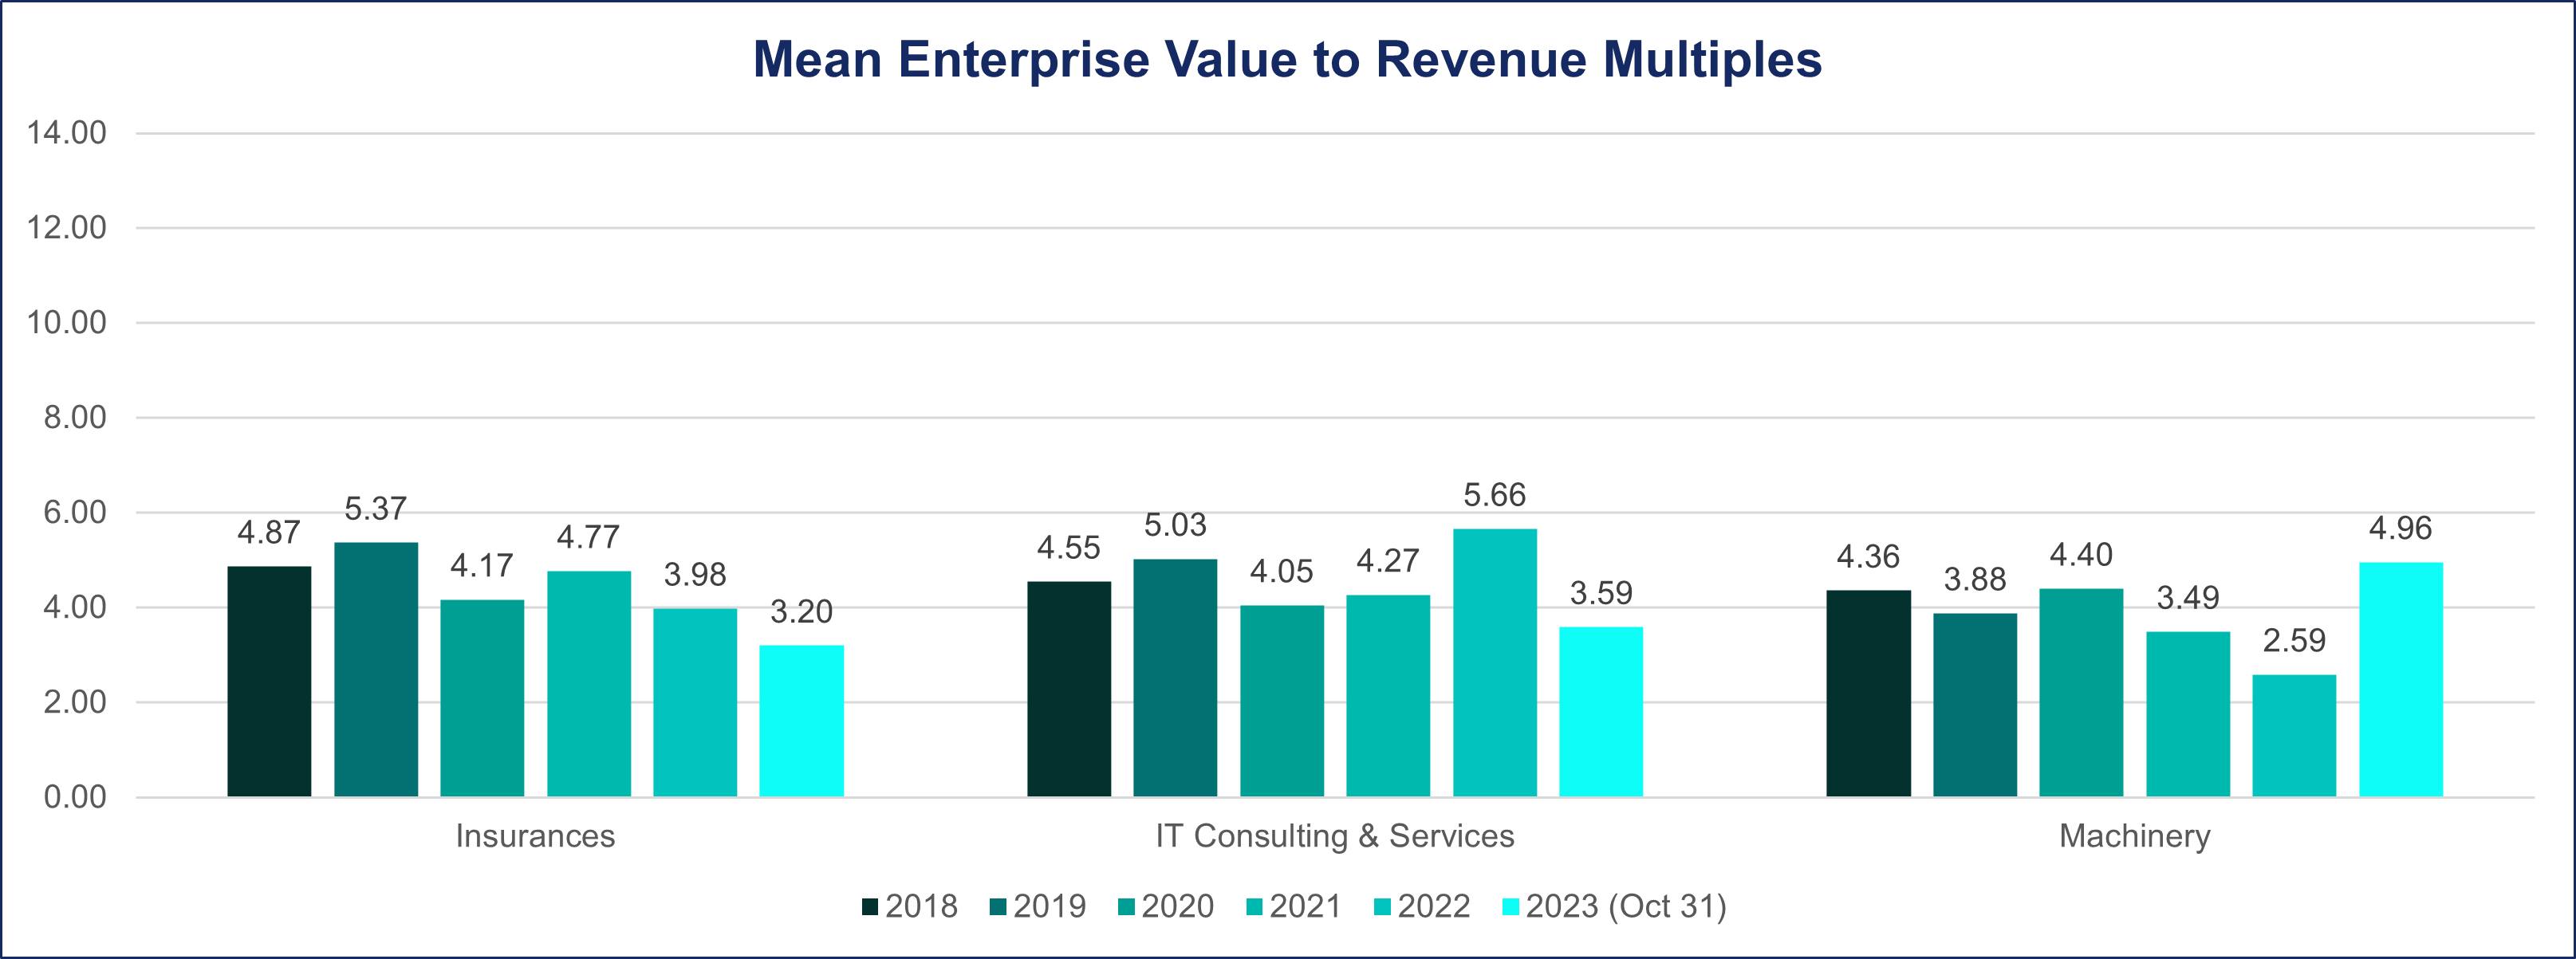
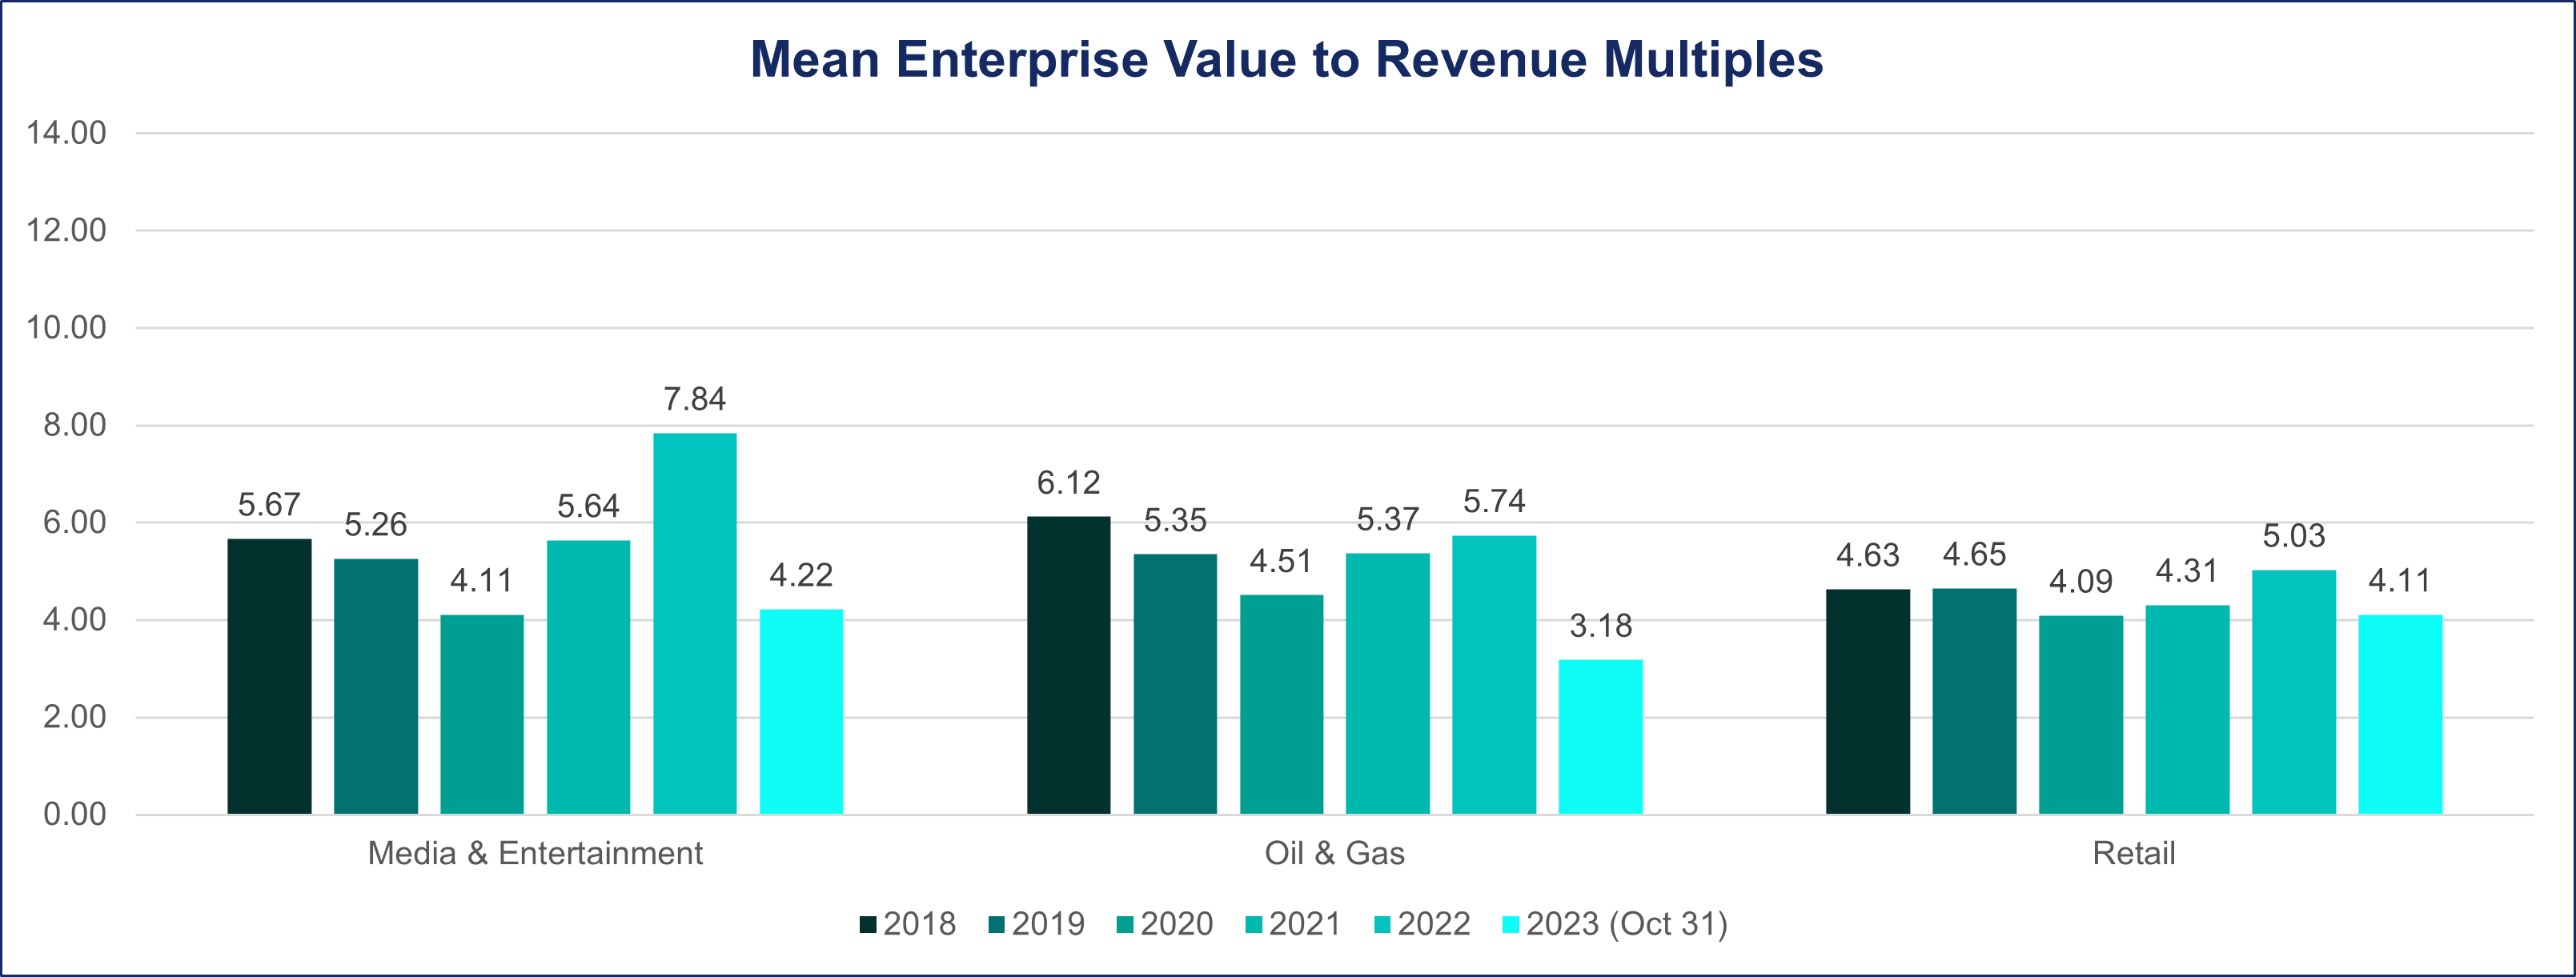
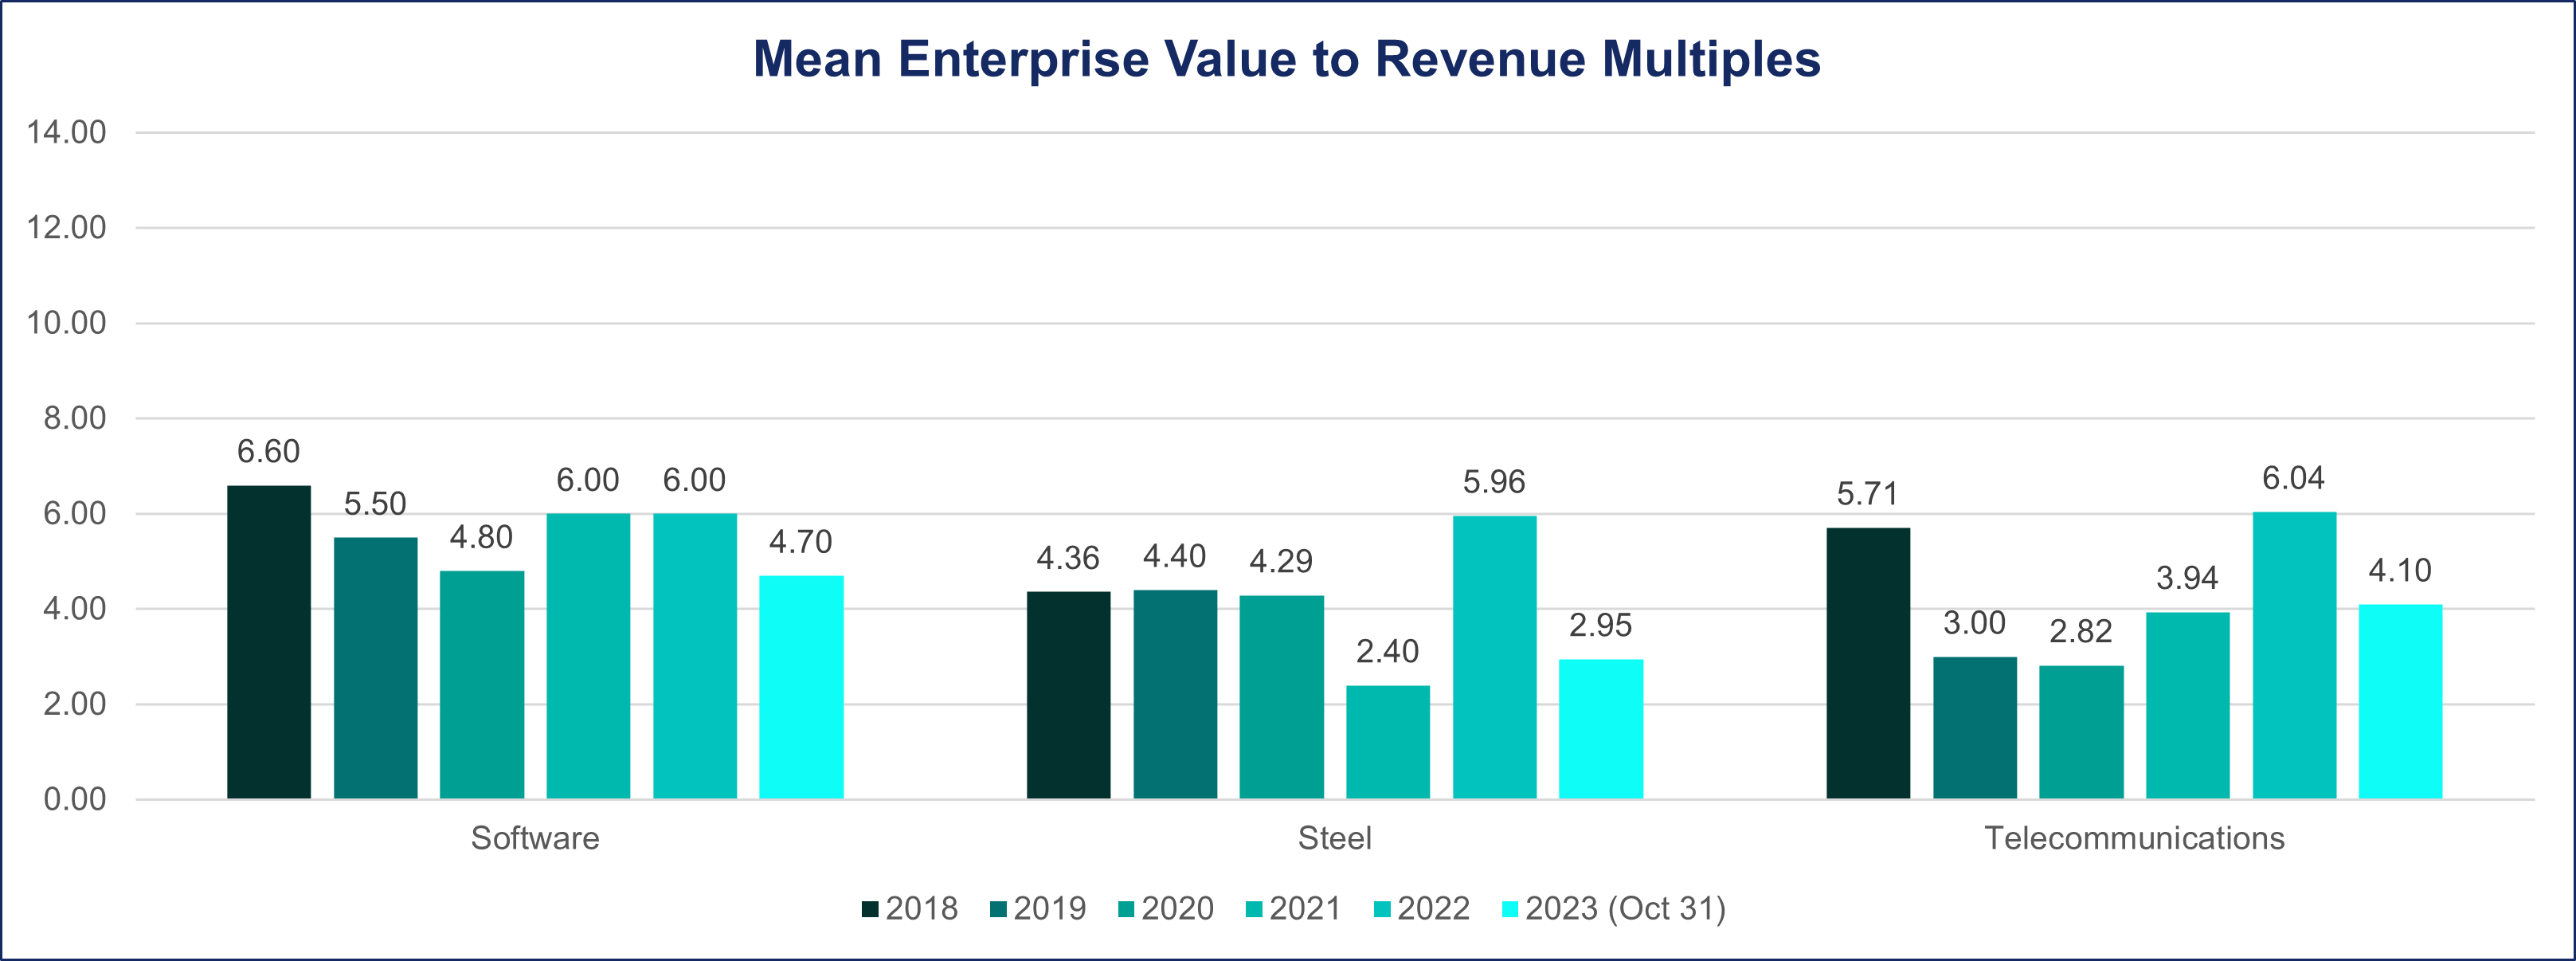
In this comprehensive report, we delve into the valuation dynamics of 18 diverse industries over the last six years, specifically focusing on the periods pre-pandemic, during the pandemic, and post-pandemic (2018 to October 31, 2023).
Overview
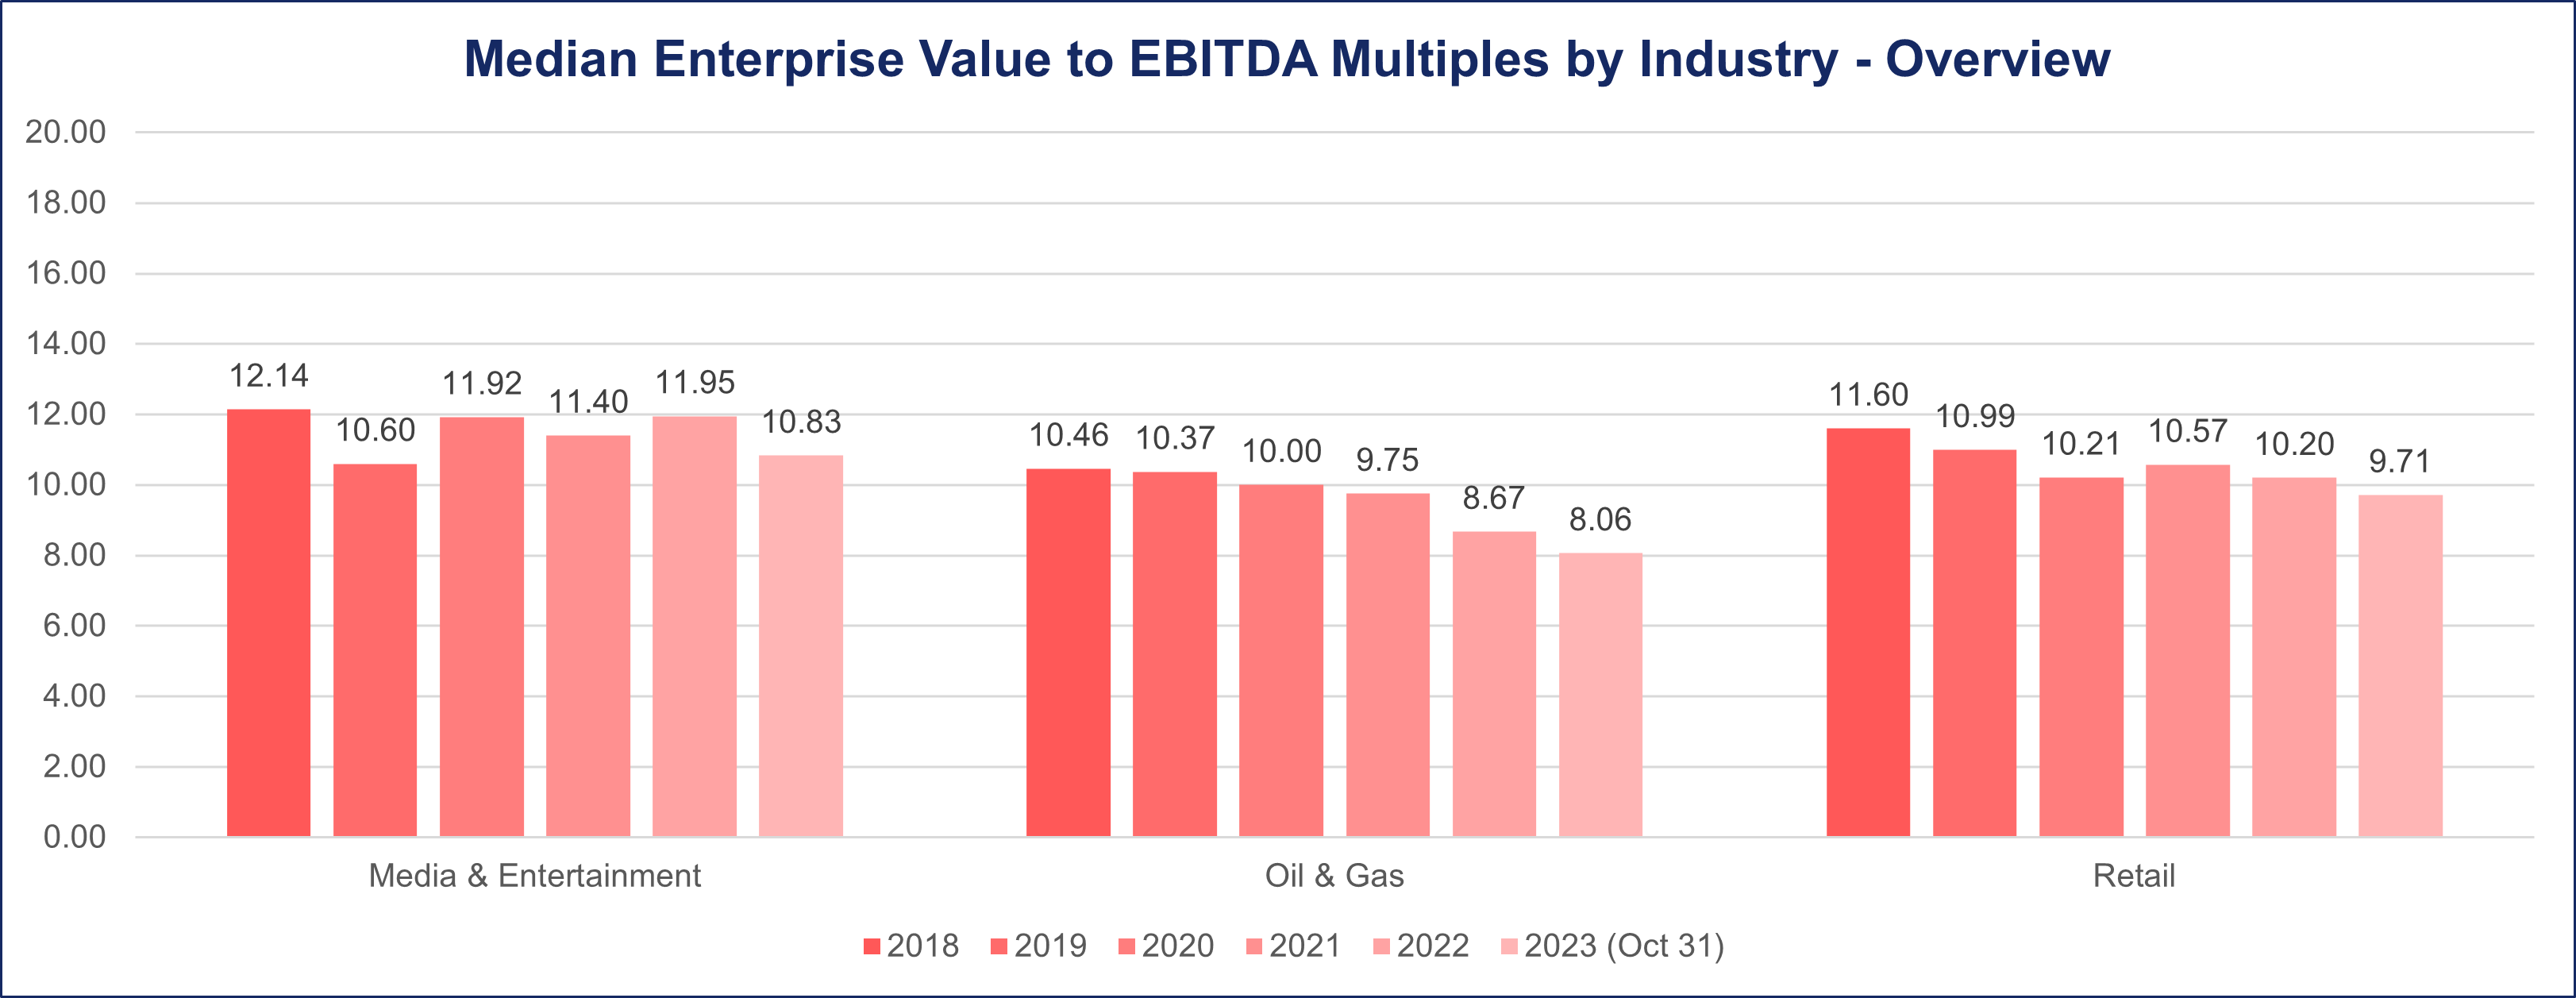
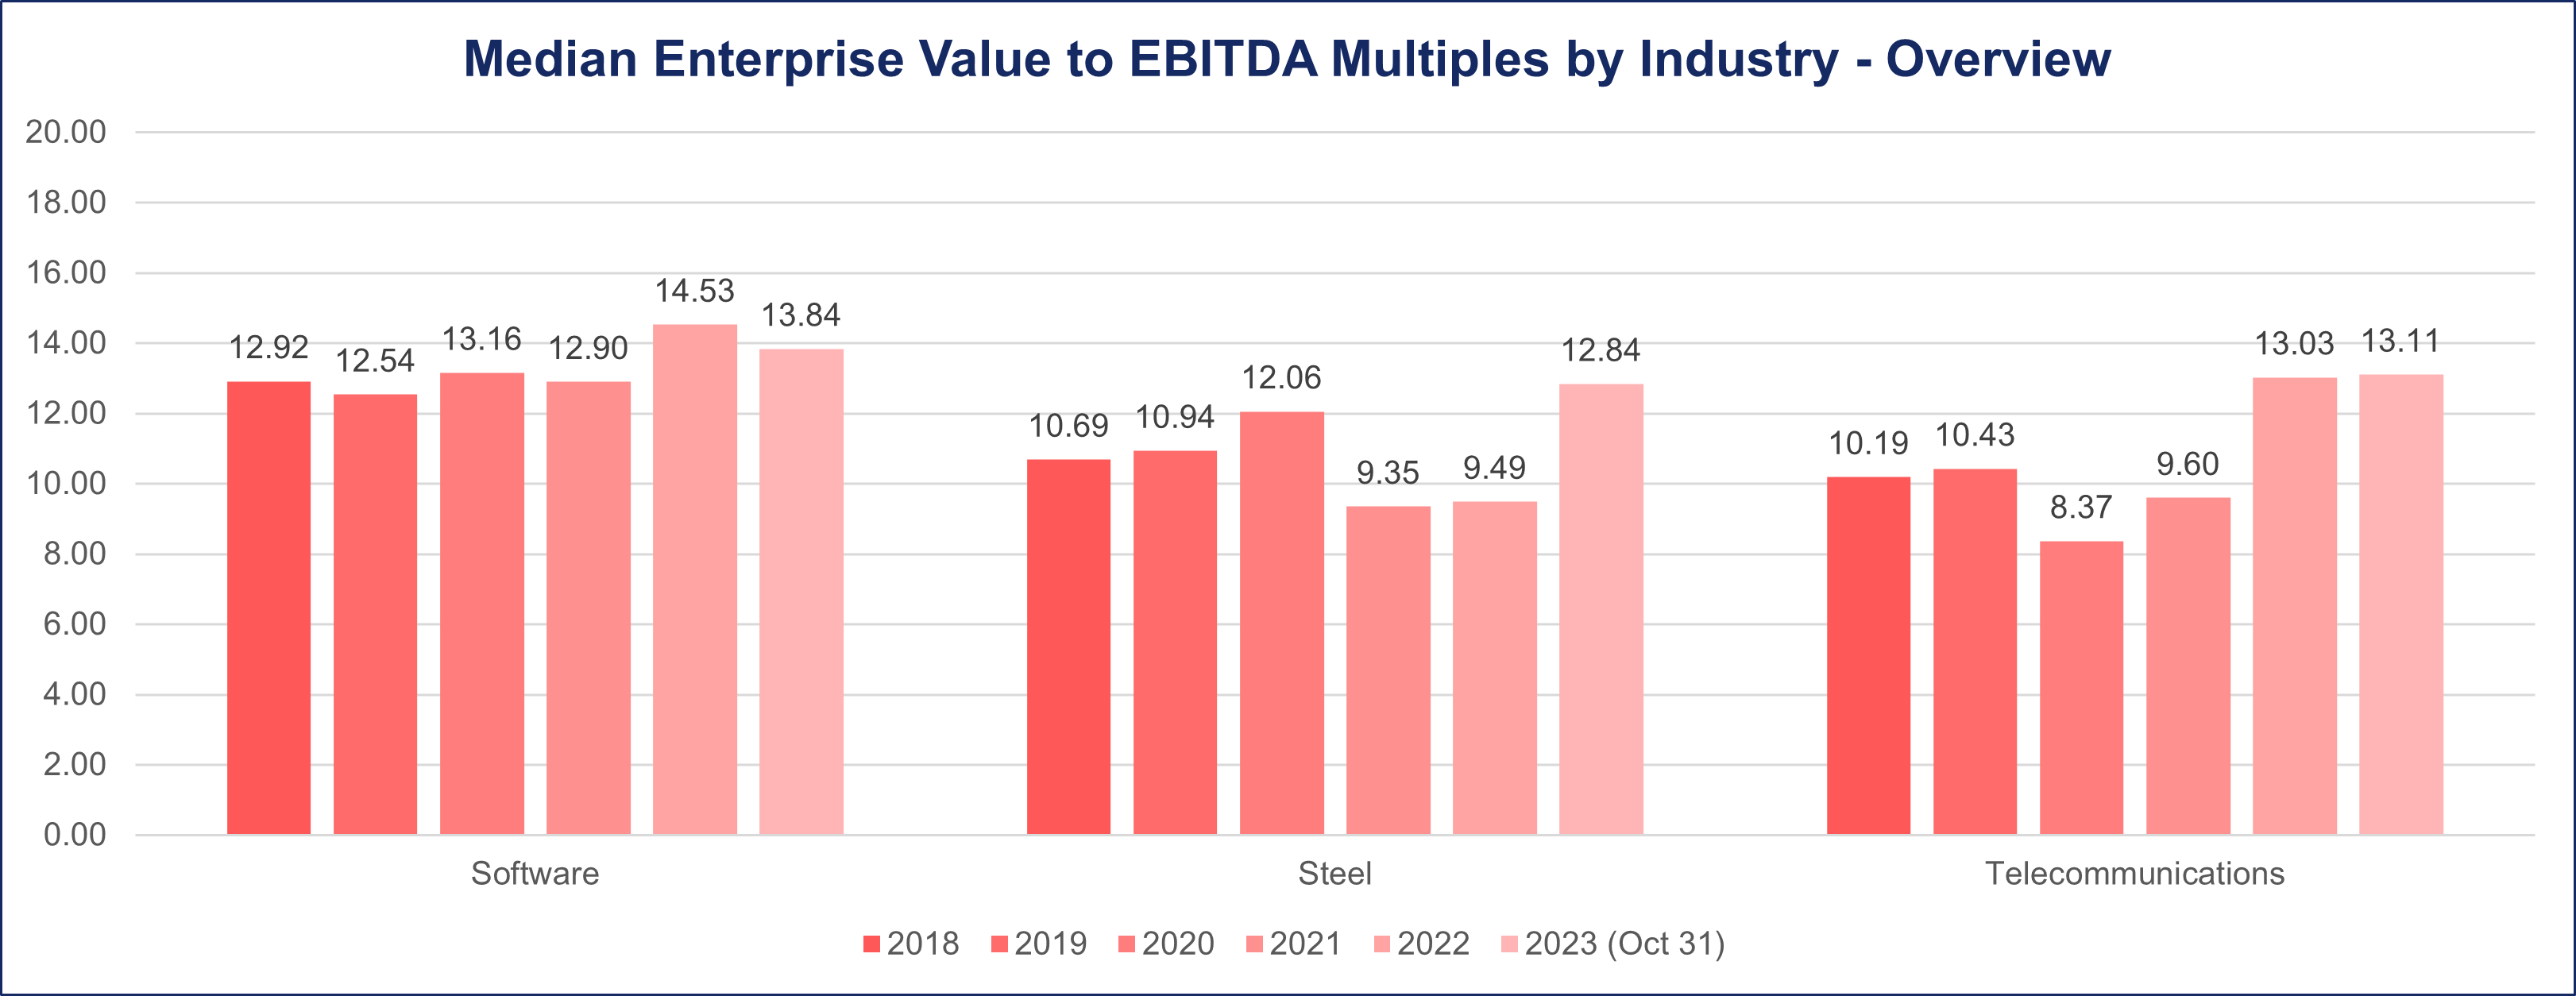
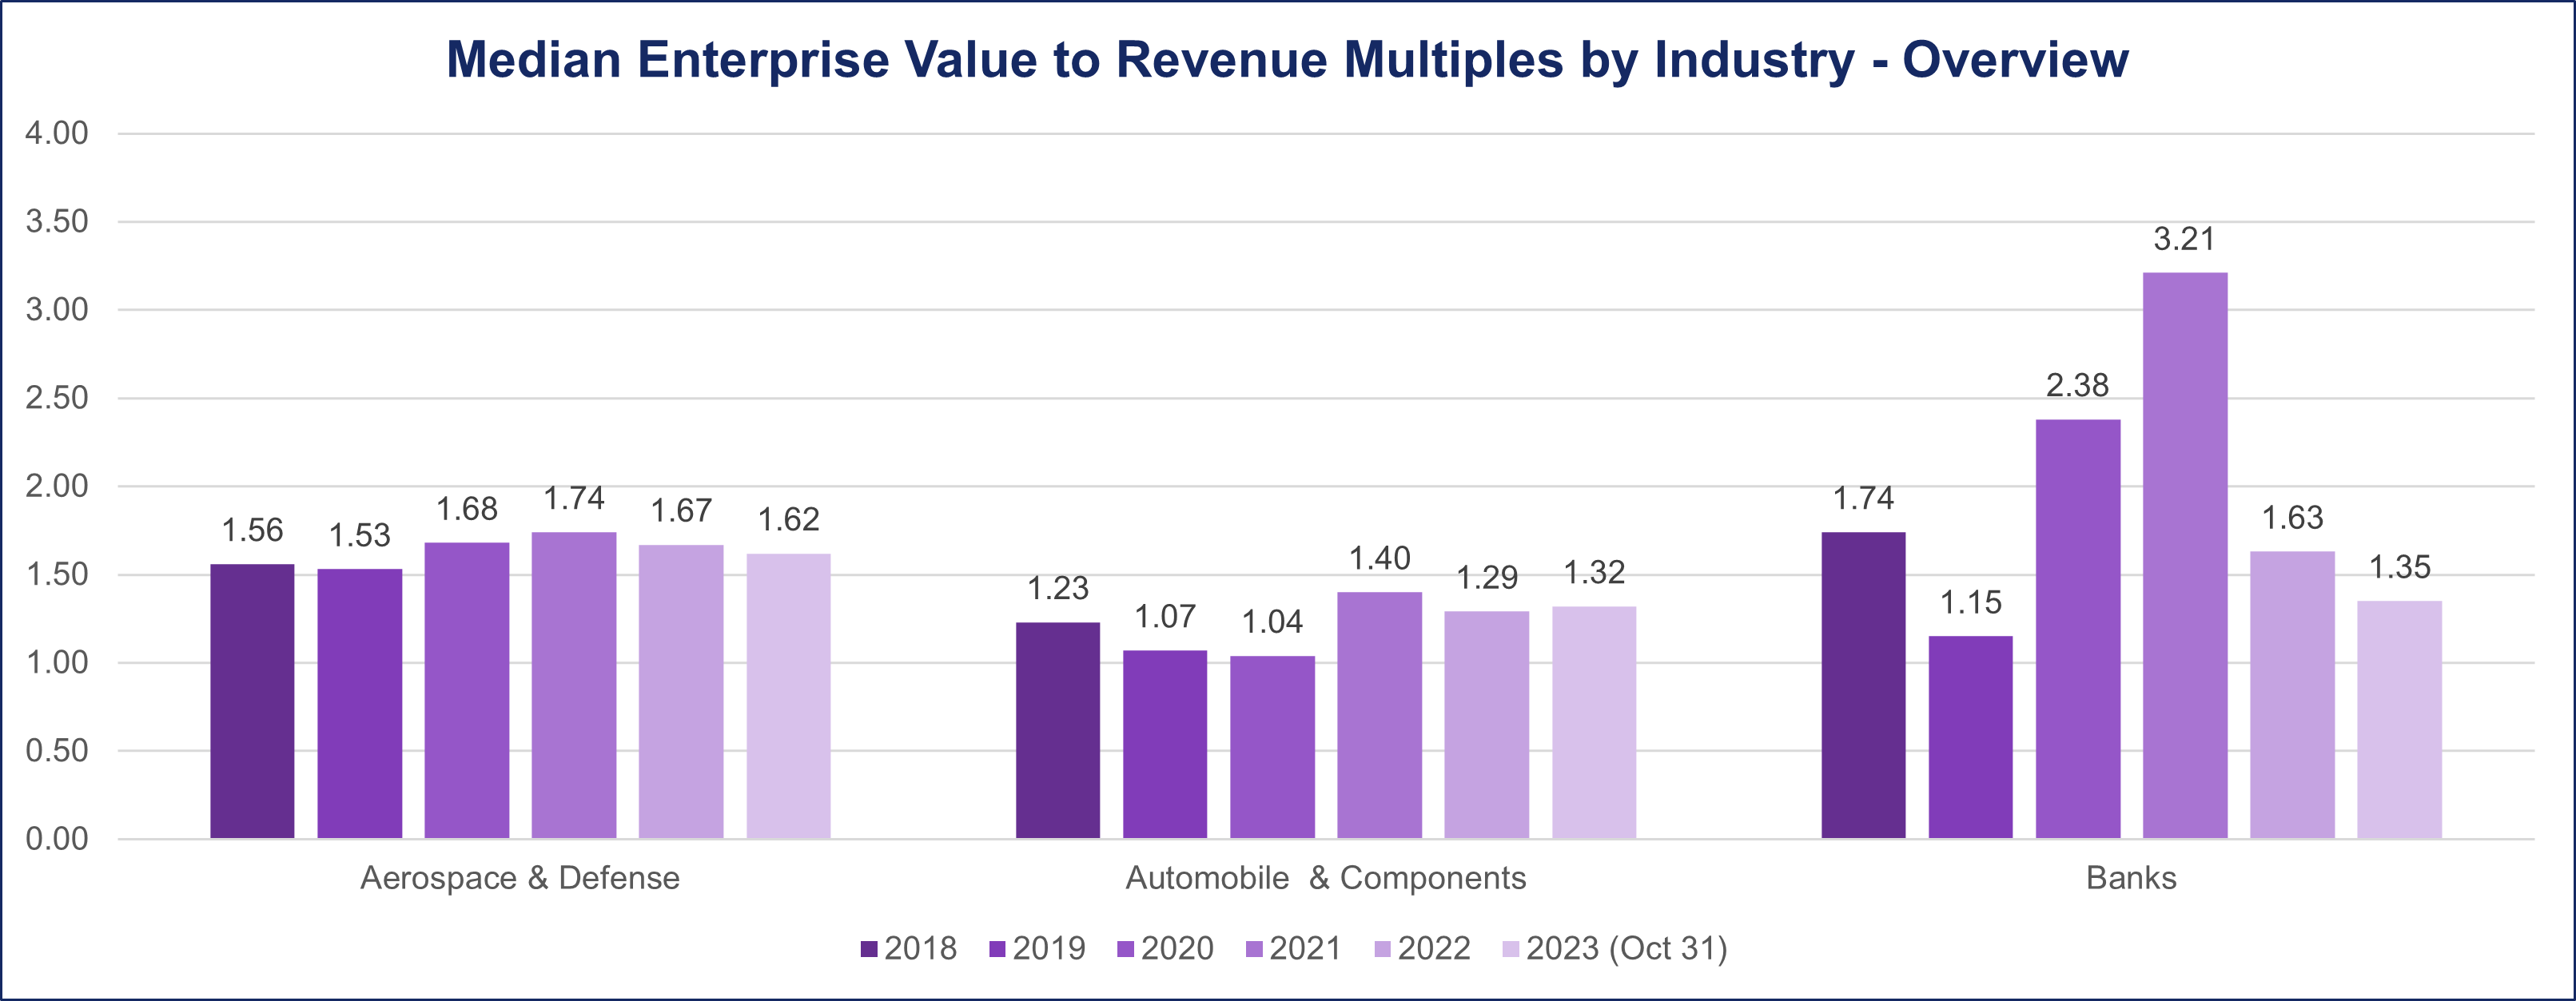
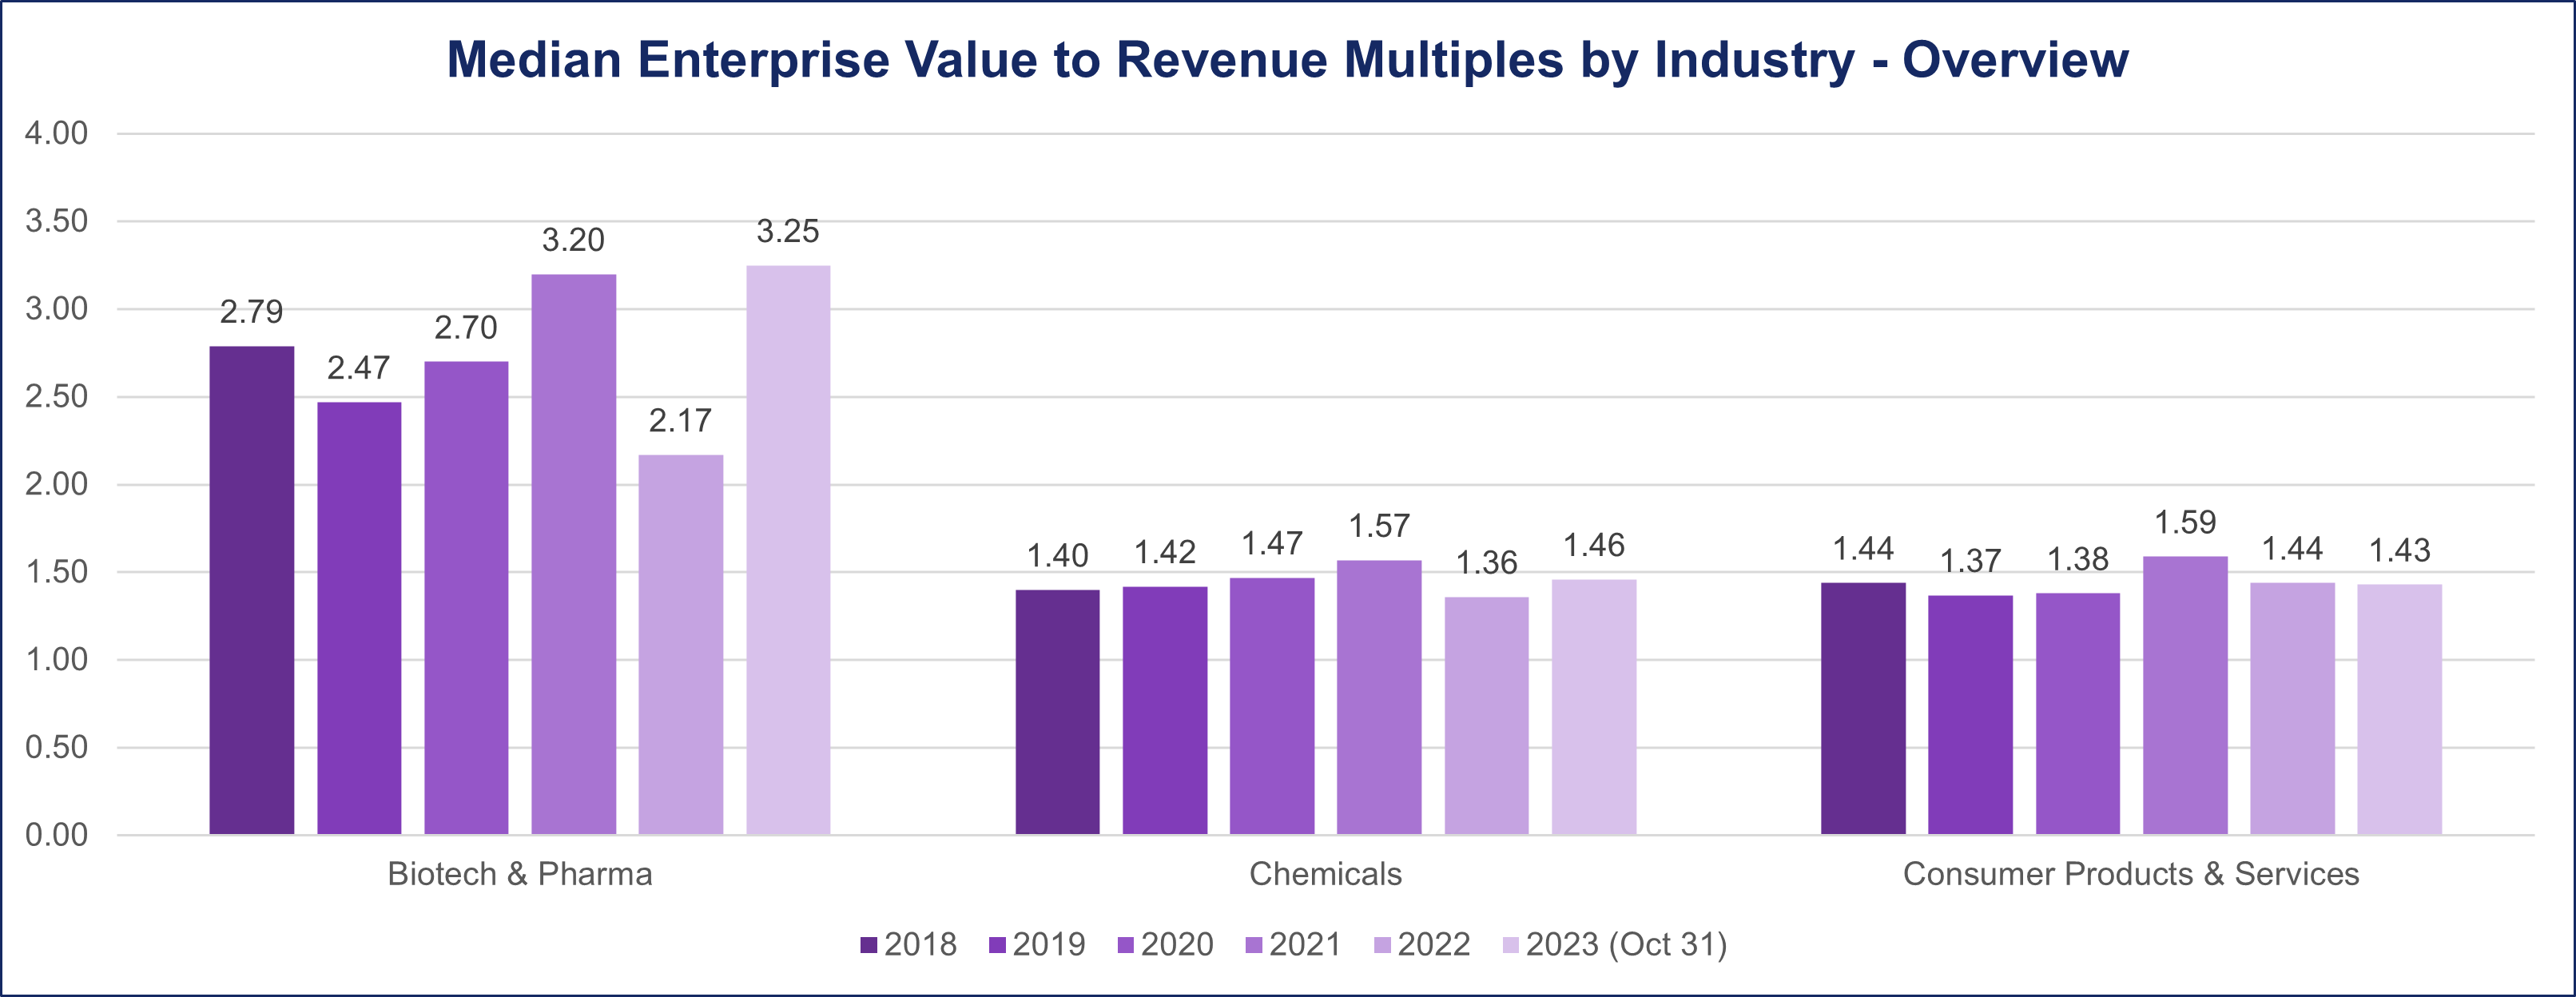
Our analysis employs two key valuation multiples: Enterprise Value to Earnings Before Interest, Taxes, Depreciation, and Amortization (EV/EBITDA) and Enterprise Value to Revenue (EV/Revenue). The goal is to provide a nuanced understanding of how industries have reacted and evolved in terms of deal multiples during these distinct economic phases.
EV/EBITDA and EV/Revenue Report
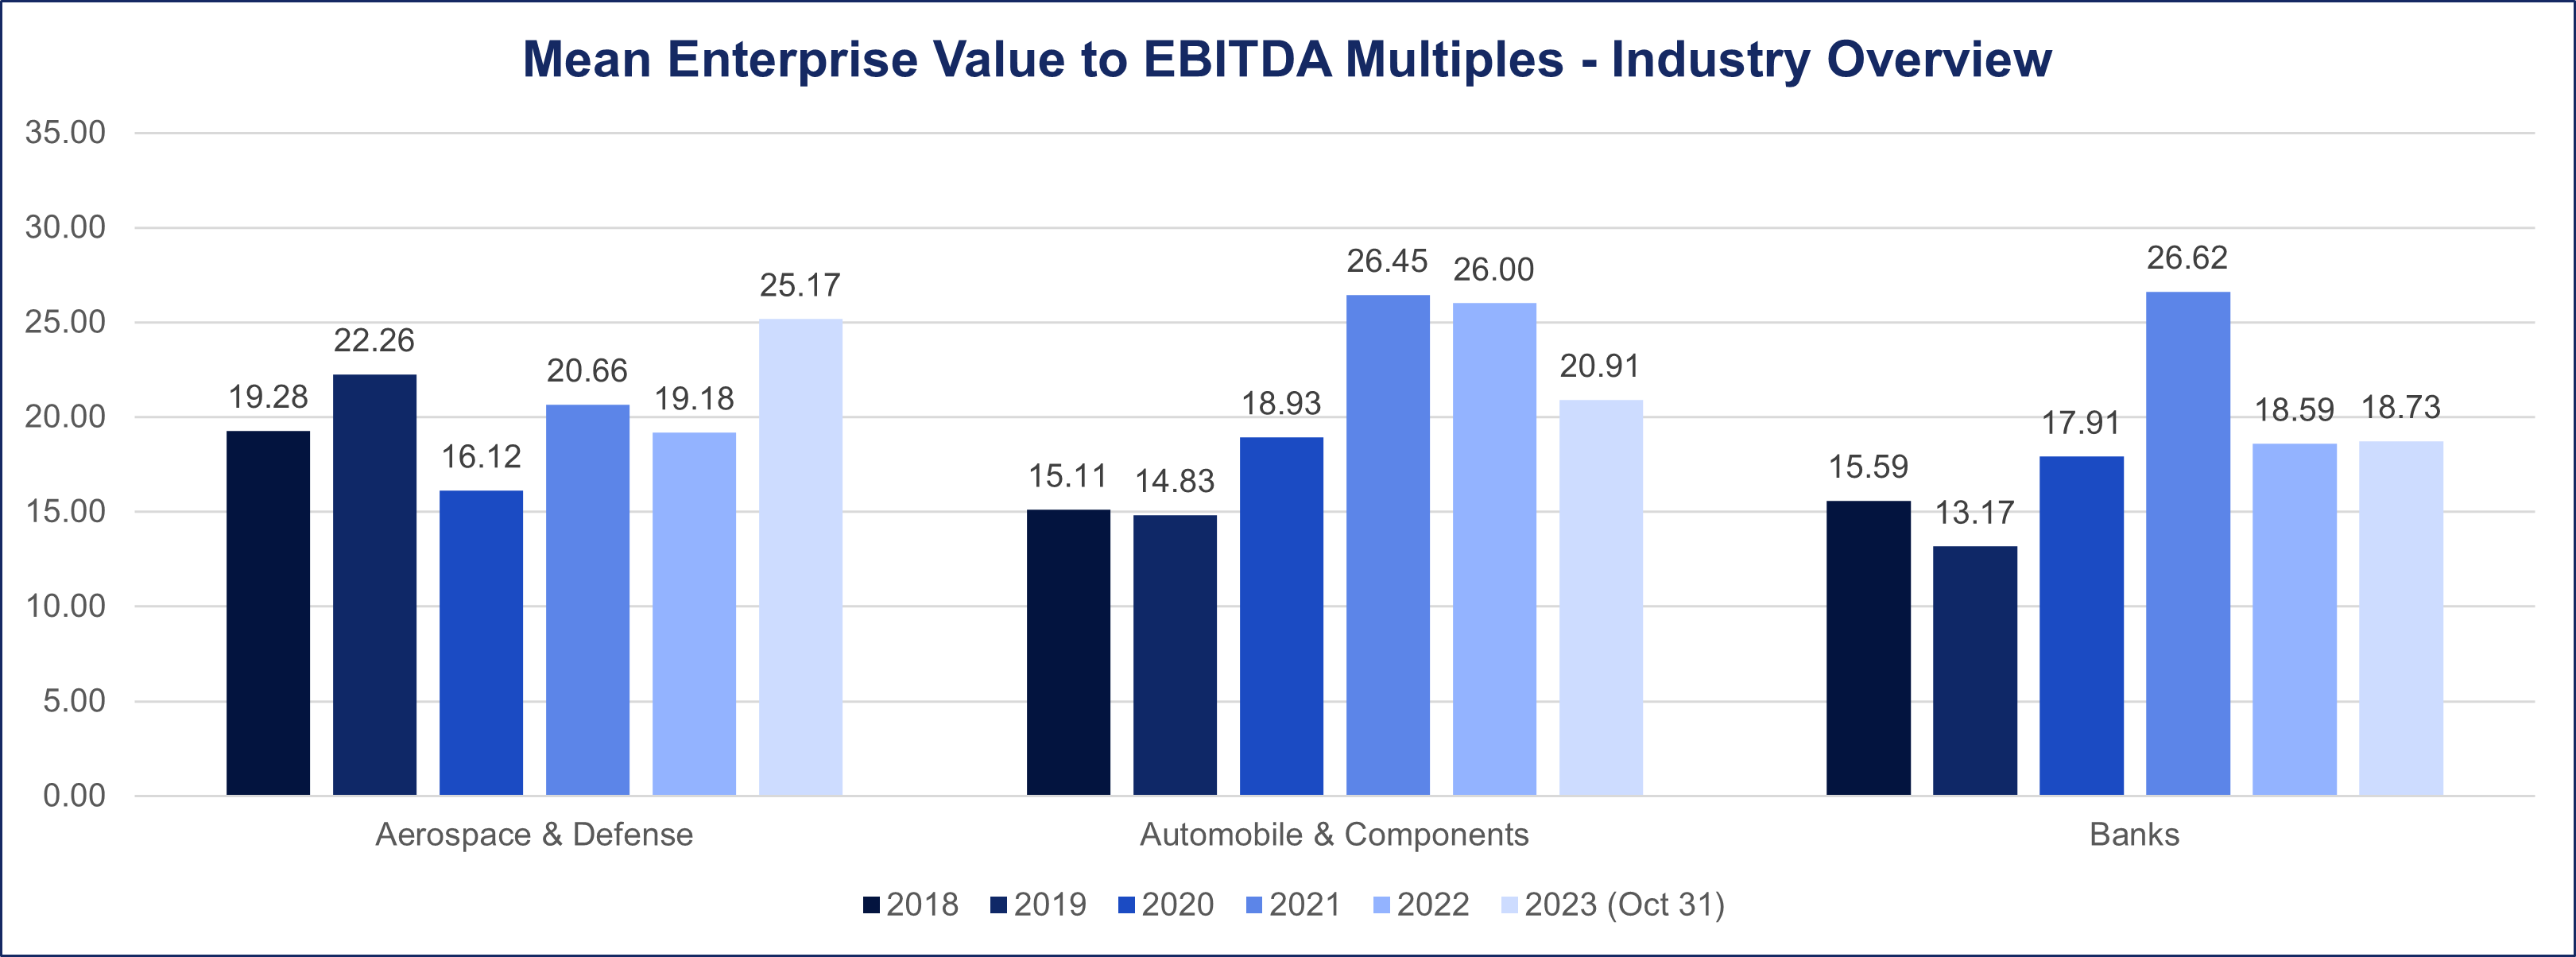
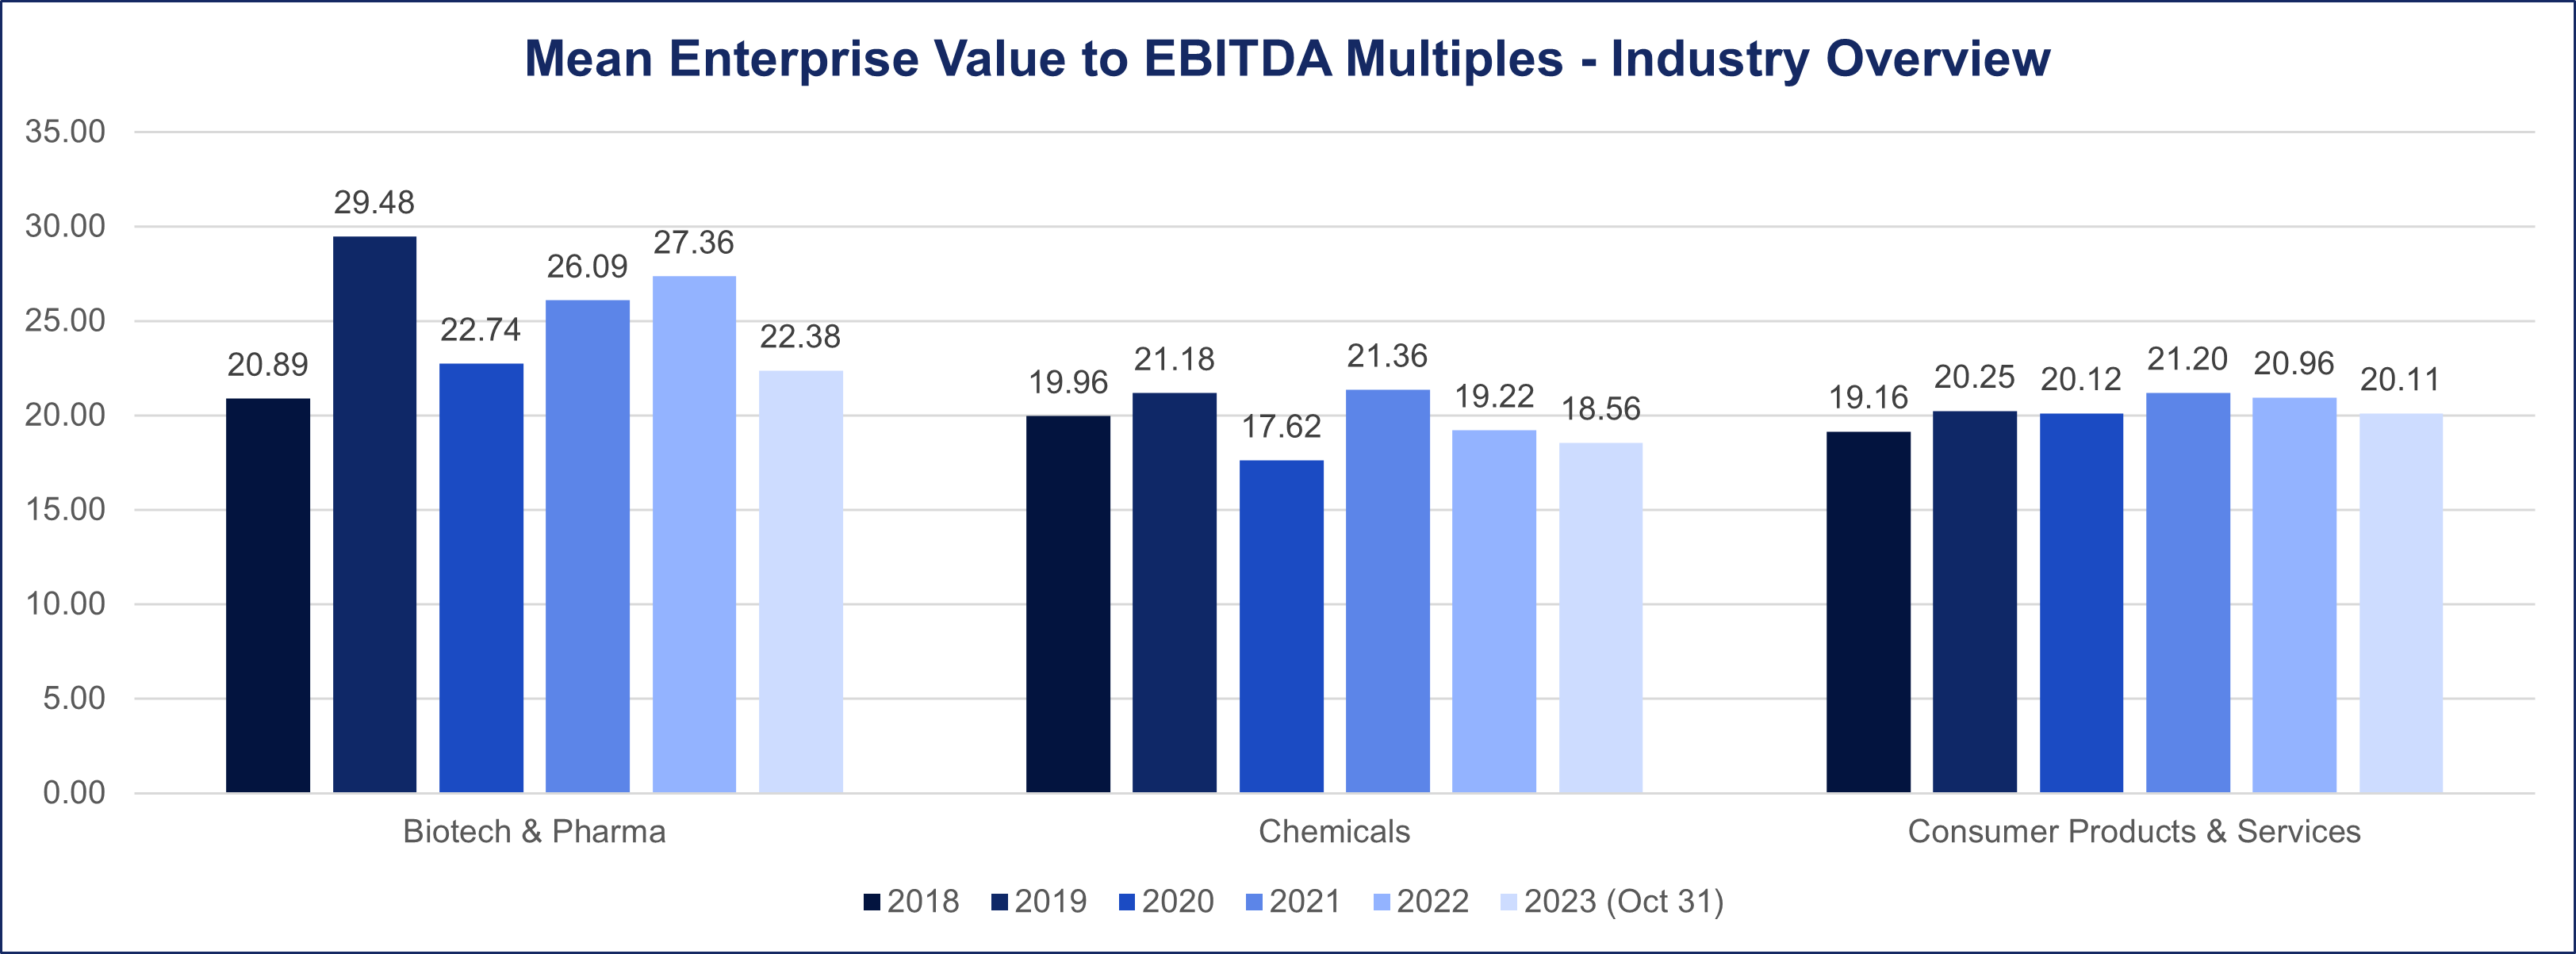
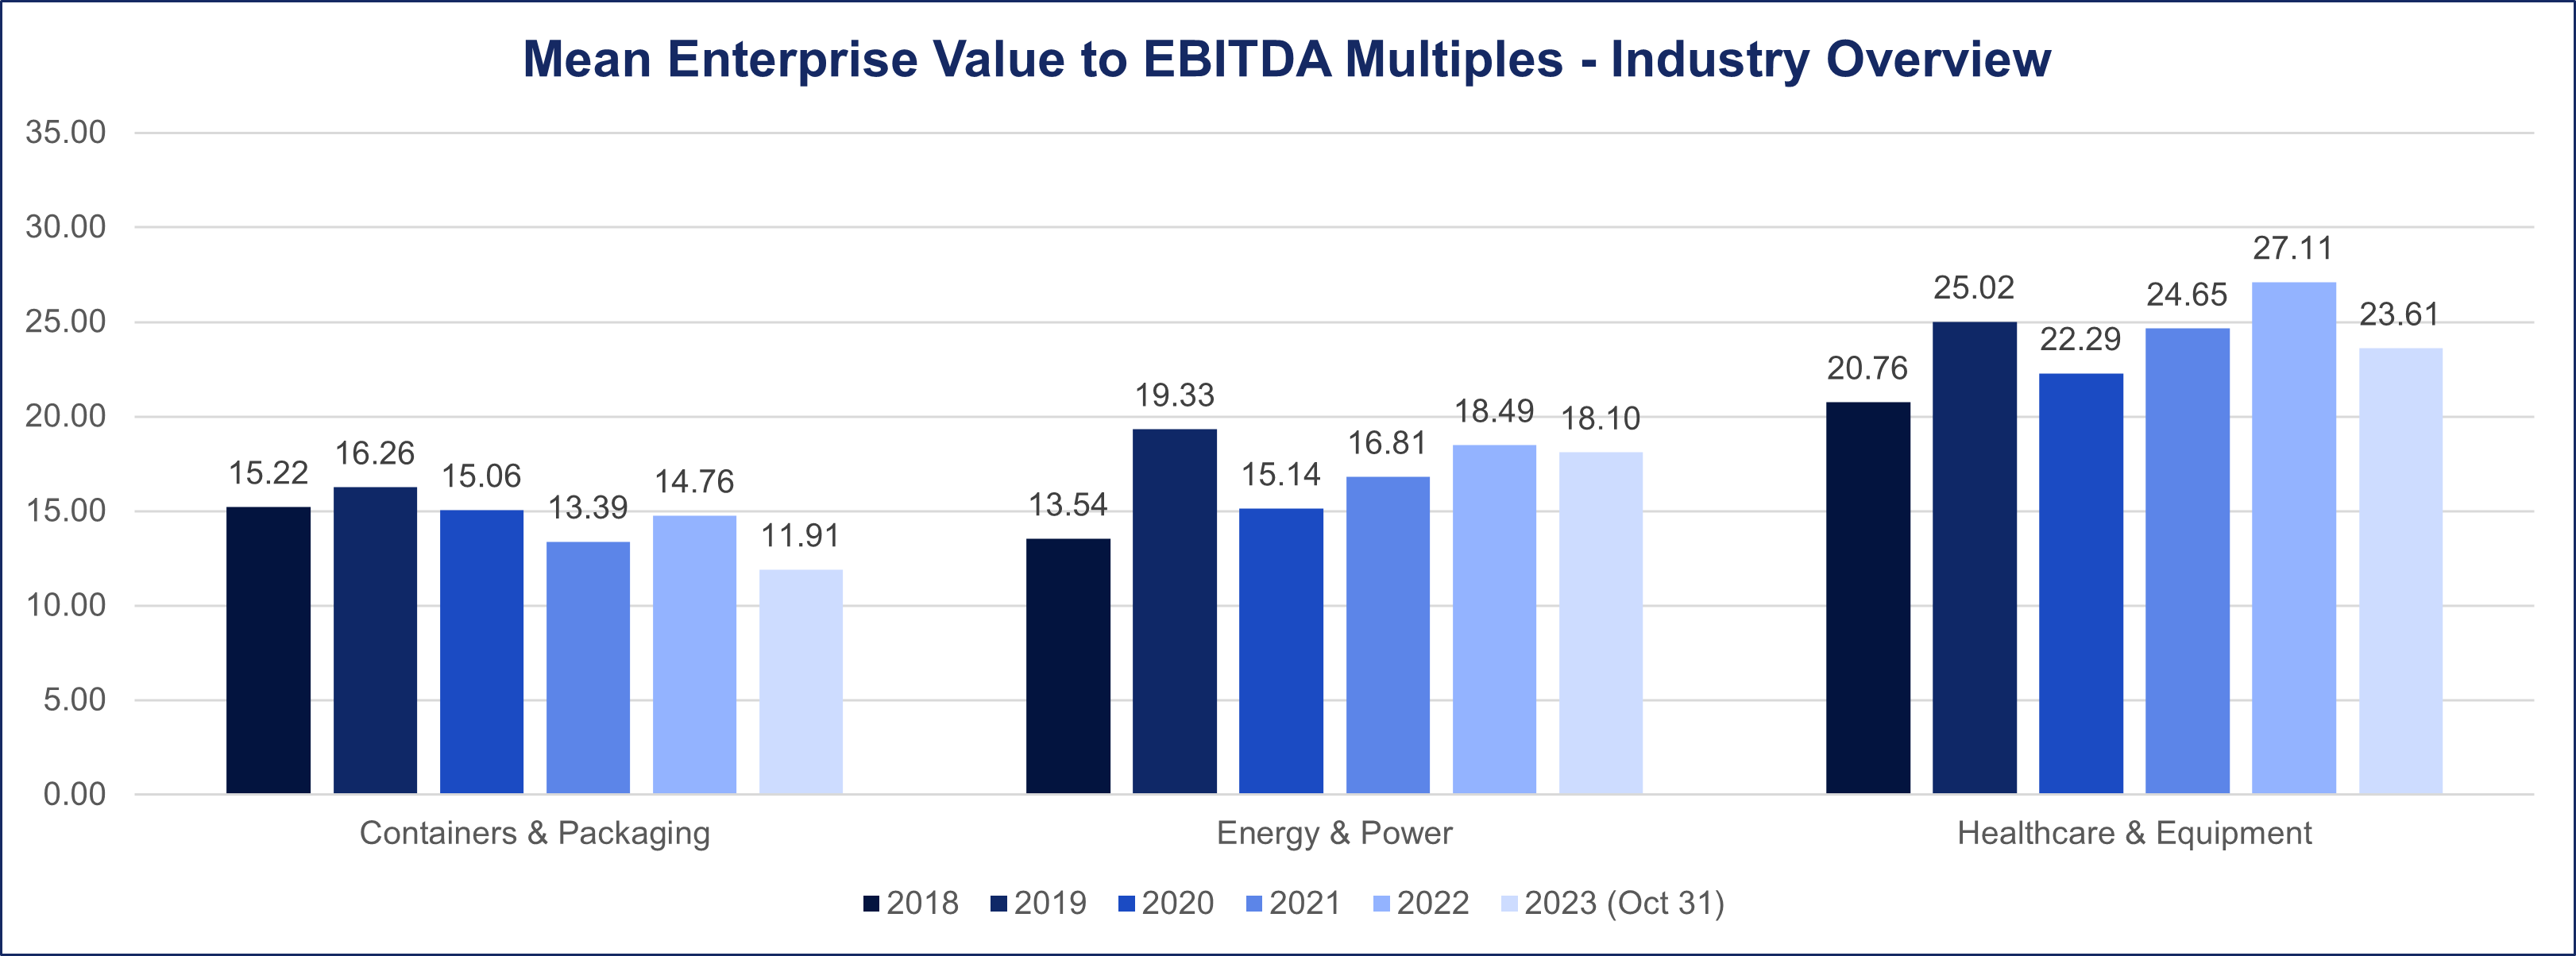
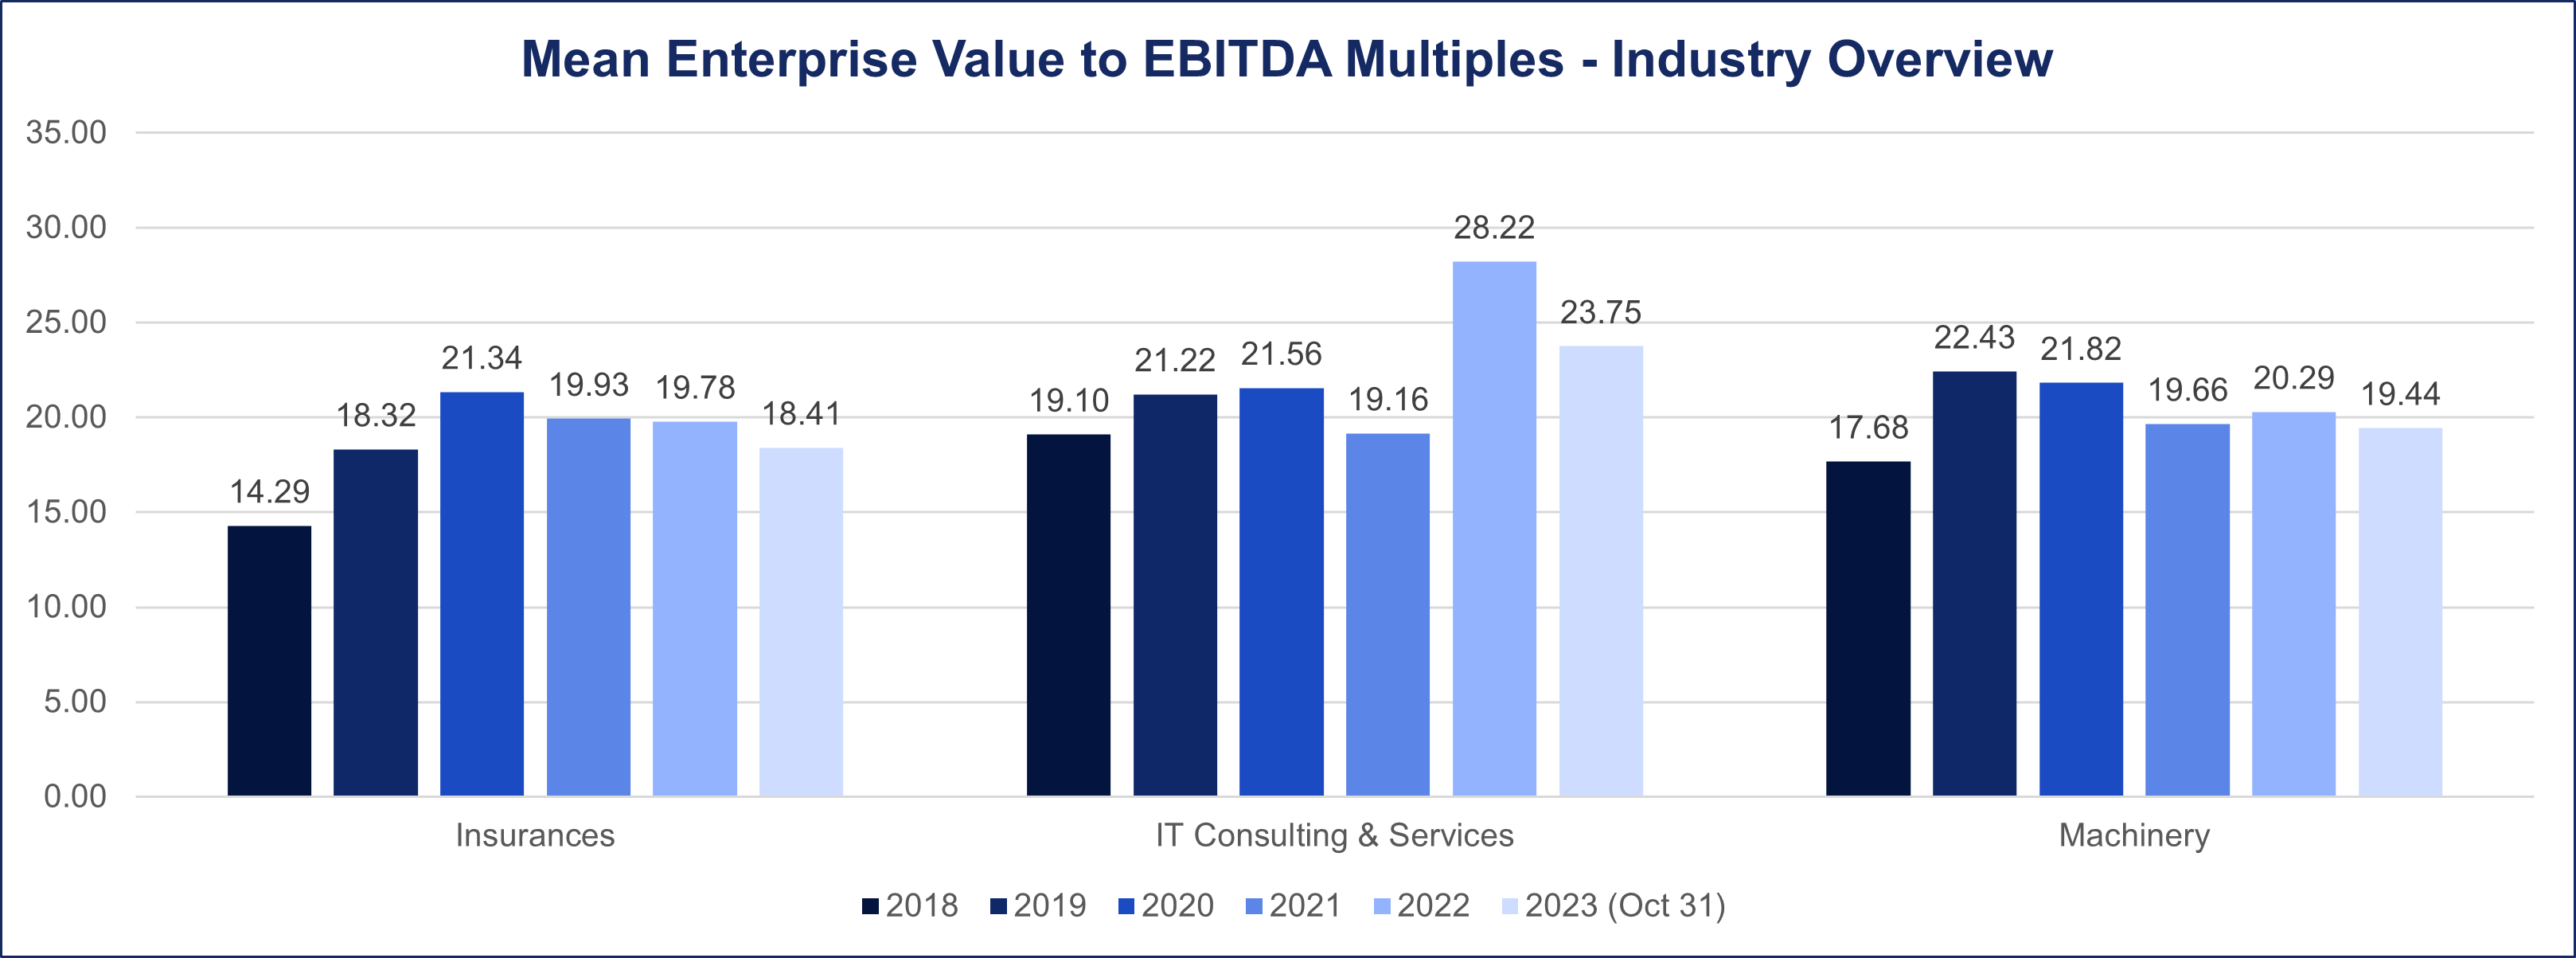
Our report covers 18 diverse industries, capturing the nuances of their valuation dynamics. The industries are as follows:
Aerospace & Defense
Automobile & Components
Banks
Biotech & Pharma
Chemicals
Consumer Products & Services
Containers & Packaging
Energy & Power
Healthcare & Equipment
Insurances
IT Consulting & Services
Machinery
Media & Entertainment
Oil & Gas
Retail
Software
Steel
Telecommunications
The analysis includes both median and mean deal multiples based onEV/EBITDA and EV/Revenue. The following charts and insights aim to elucidate how these industries responded to the challenges and opportunities presented in the pre-pandemic, during-pandemic, and post-pandemic periods.
As industries navigated through the evolving economic landscape of the last six years, the choice of valuation metric played a pivotal role in shaping deal multiples. This report aims to provide valuable insights for industry stakeholders, M&A professionals, and investors seeking a nuanced understanding of industry-specific valuation trends.
Valuation Metrics Overview
1. EV/EBITDA: Unveiling Profitability Dynamics
Definition: EV/EBITDA represents the ratio of a company’s Enterprise Value to its Earnings Before Interest, Taxes, Depreciation, and Amortization. It is a metric emphasizing profitability and operating efficiency.
Enterprise Value-to-EBITDA (EV/EBITDA):
EV/EBIDTA =
Enterprise Value
EBITDA
Where:
Enterprise Value is the total value of a company’s equity and debt.
EBITDA stands for Earnings Before Interest, Taxes, Depreciation, and Amortization.
Applicability:
Often preferred for mature companies with established profitability.
Provides insights into a company’s operational performance, excluding non-operating expenses.
2. EV/Revenue: Unmasking Revenue-Centric Insights
Definition: EV/Revenue signifies the ratio of Enterprise Value to a company’s Revenue. This metric focuses on a company’s ability to generate revenue, irrespective of profitability.
Enterprise Value-to-Revenue (EV/R):
EV/R =
Enterprise Value
Revenue
Where:
Enterprise Value is the total value of a company’s equity and debt.
Revenue is the total income generated by the company from its primary operations.
Applicability:
Particularly relevant for high-growth or early-stage companies.
Emphasizes top-line growth and market presence.
Industry-Specific Analysis
In situations where a company is going through a downturn and is valued based on Forward Multiples (see next section).