Blog Mean Enterprise Value to EBITDA and Revenue Multiples
- Blog
Mean Enterprise Value to EBITDA and Revenue Multiples

SHARE:
This blog is part of IMAA’s report on Thriving in Turbulence? M&A Valuations in the Age of High Interest Rates
Overview
Mean Enterprise Value to EBITDA Multiples
by Industry – Overview
Mean Enterprise Value to Revenue Multiples
by Industry – Overview
Industry Spotlight
Aerospace & Defense
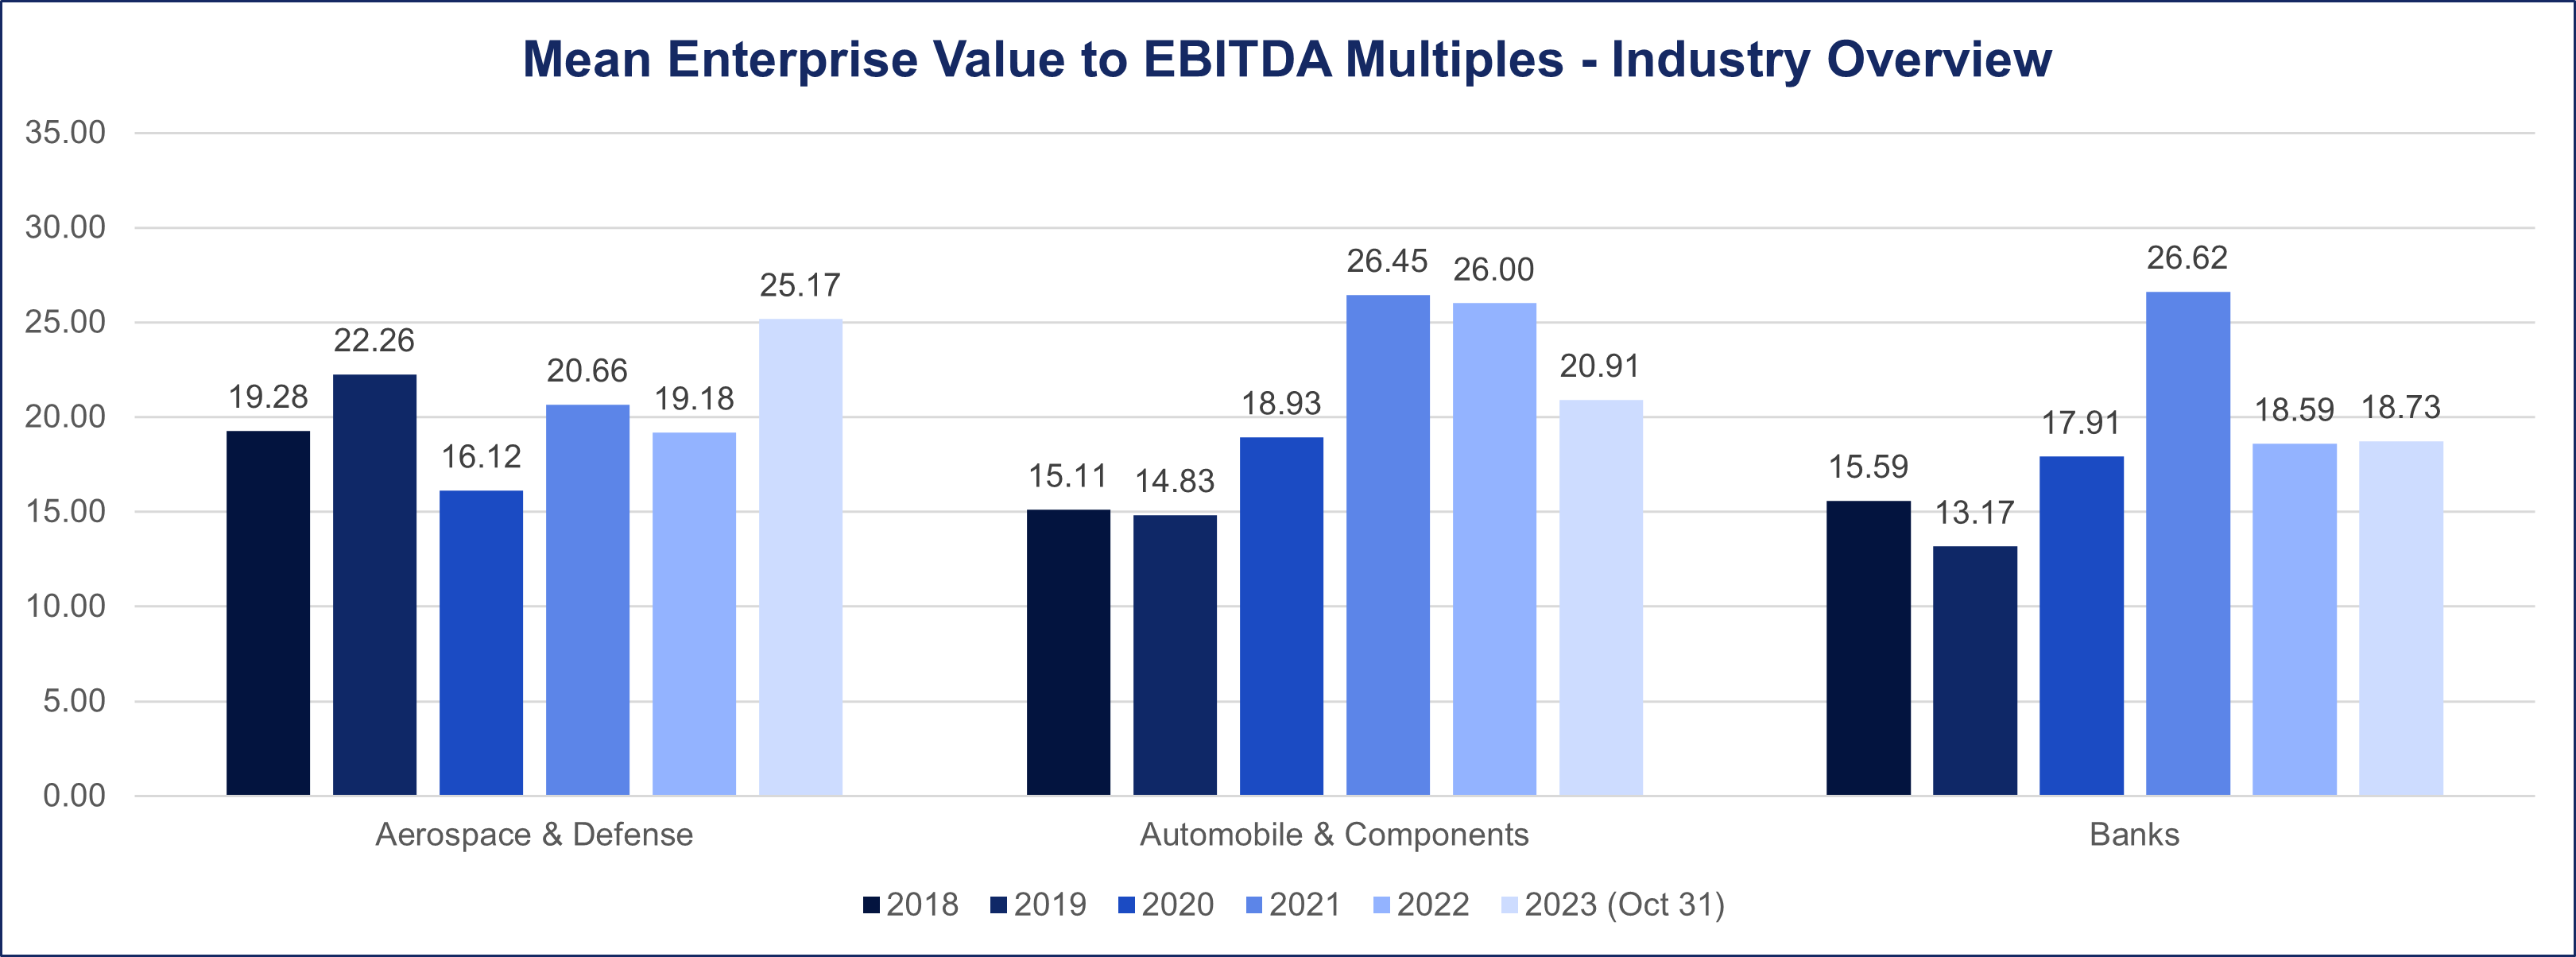
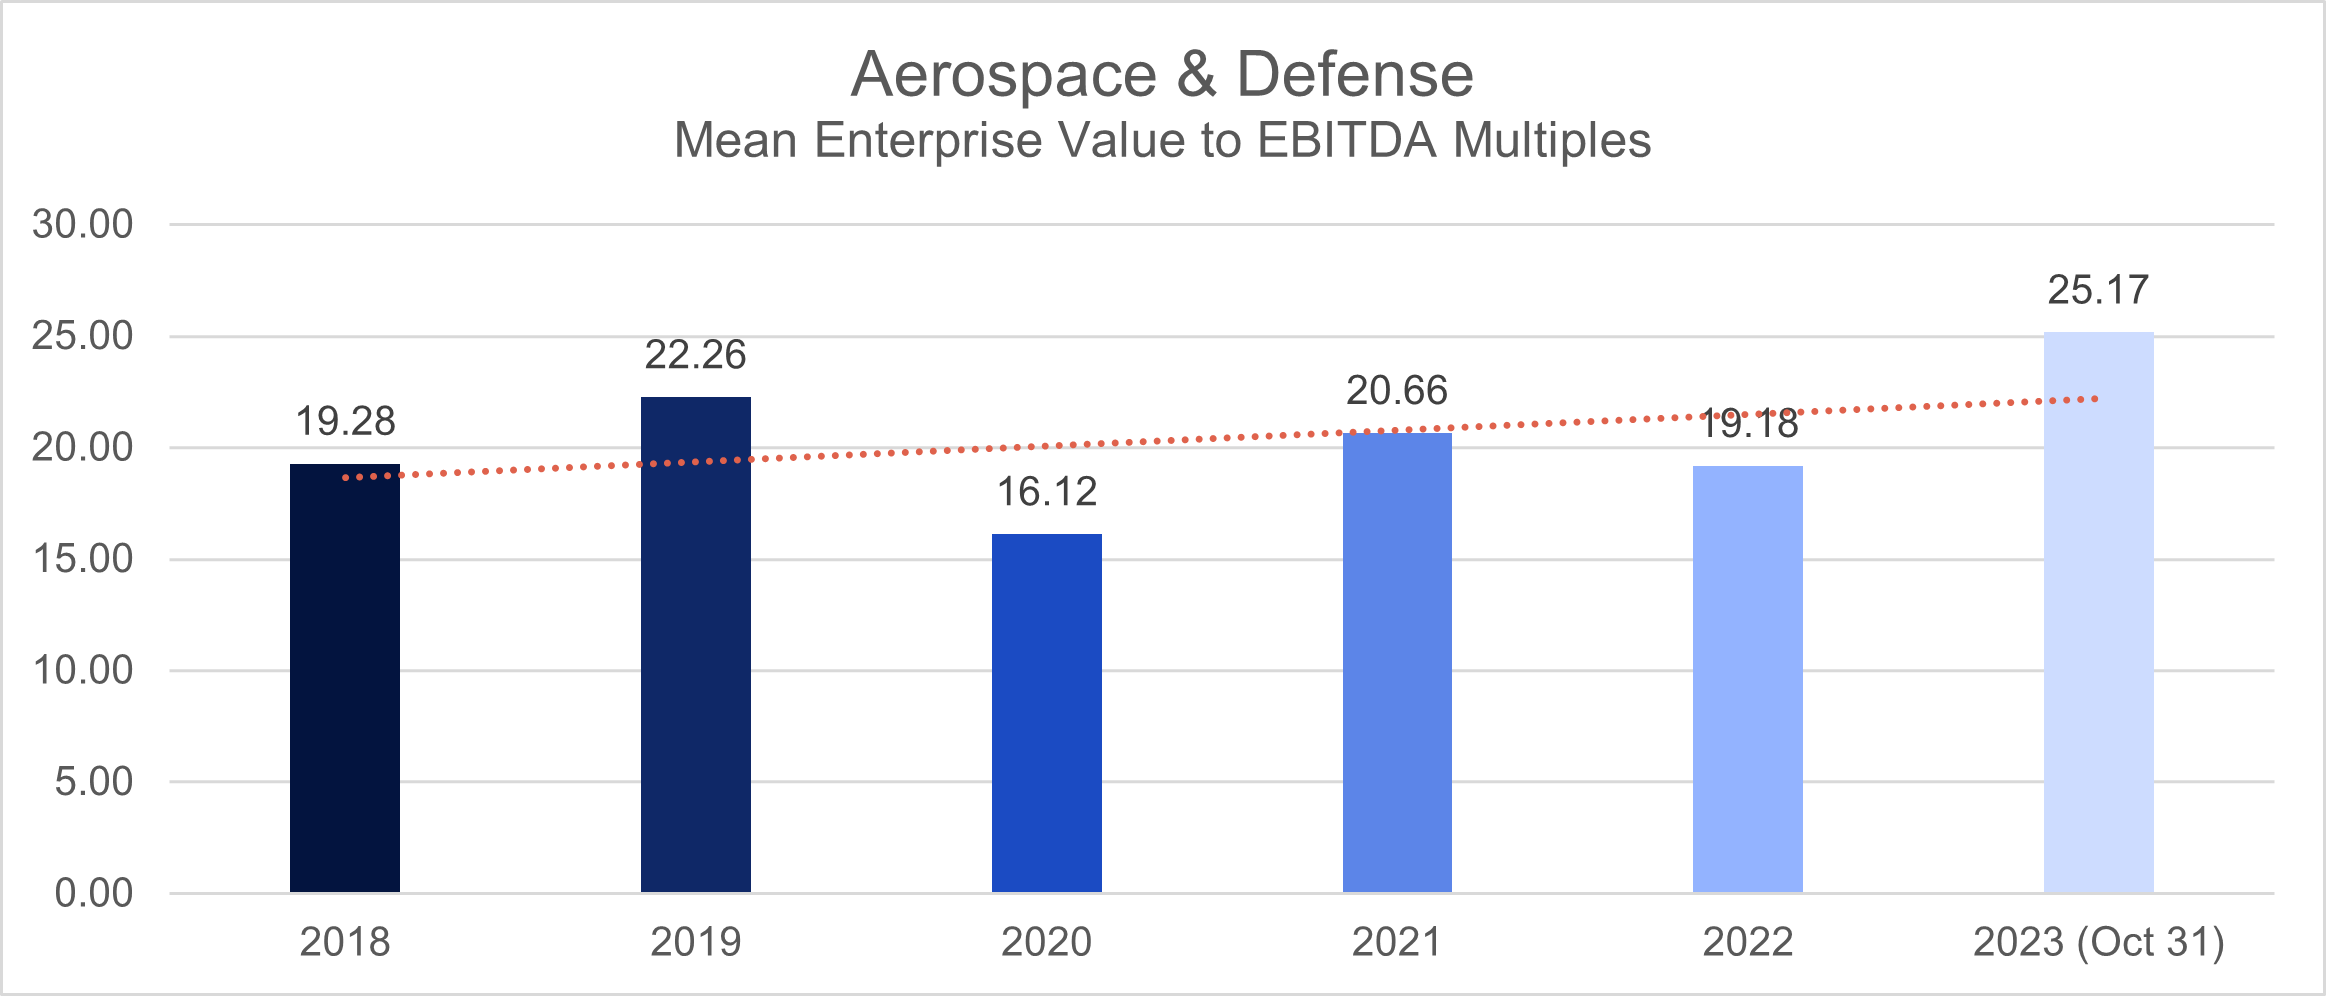
In the period spanning from 2018 to 2019, the Aerospace & Defense sector consistently showcased an ascending mean deal multiple, escalating from 19.3 to 22.3, as measured by the EV/EBITDA metric.
However, the industry faced a downturn in multiples during the challenging landscape of the pandemic in 2020, leading to a notable decline in deal multiples to 16. Nevertheless, it rebounded in 2021, with deal multiples mean surging to 20.7.
In the aftermath of the pandemic in 2022, the deal multiple mean for the Aerospace & Defense sector dipped to 19. As of October 2023, the multiple has surged to 25, indicating a noteworthy recovery and surpassing pre-pandemic levels.
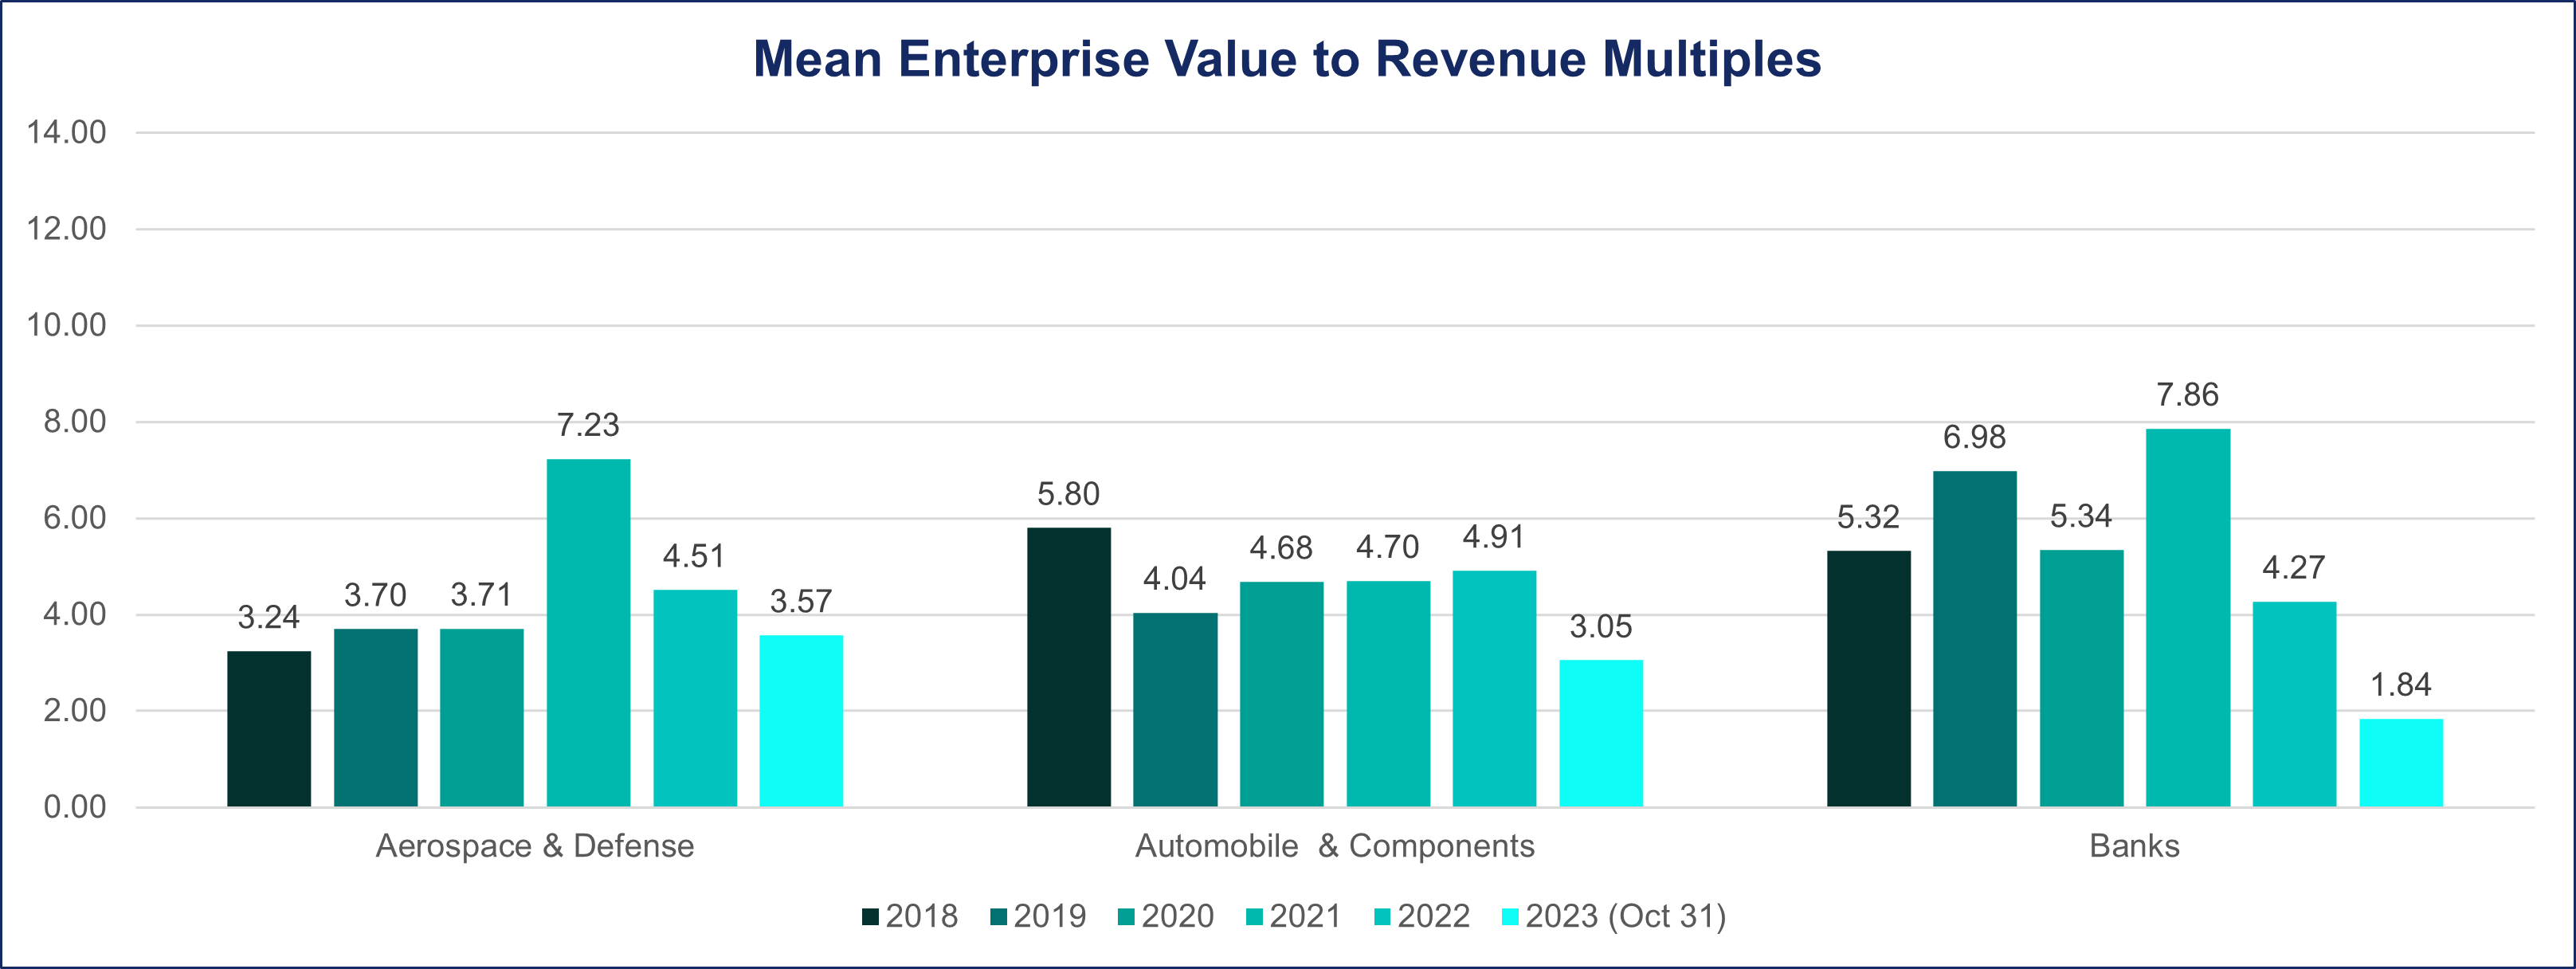
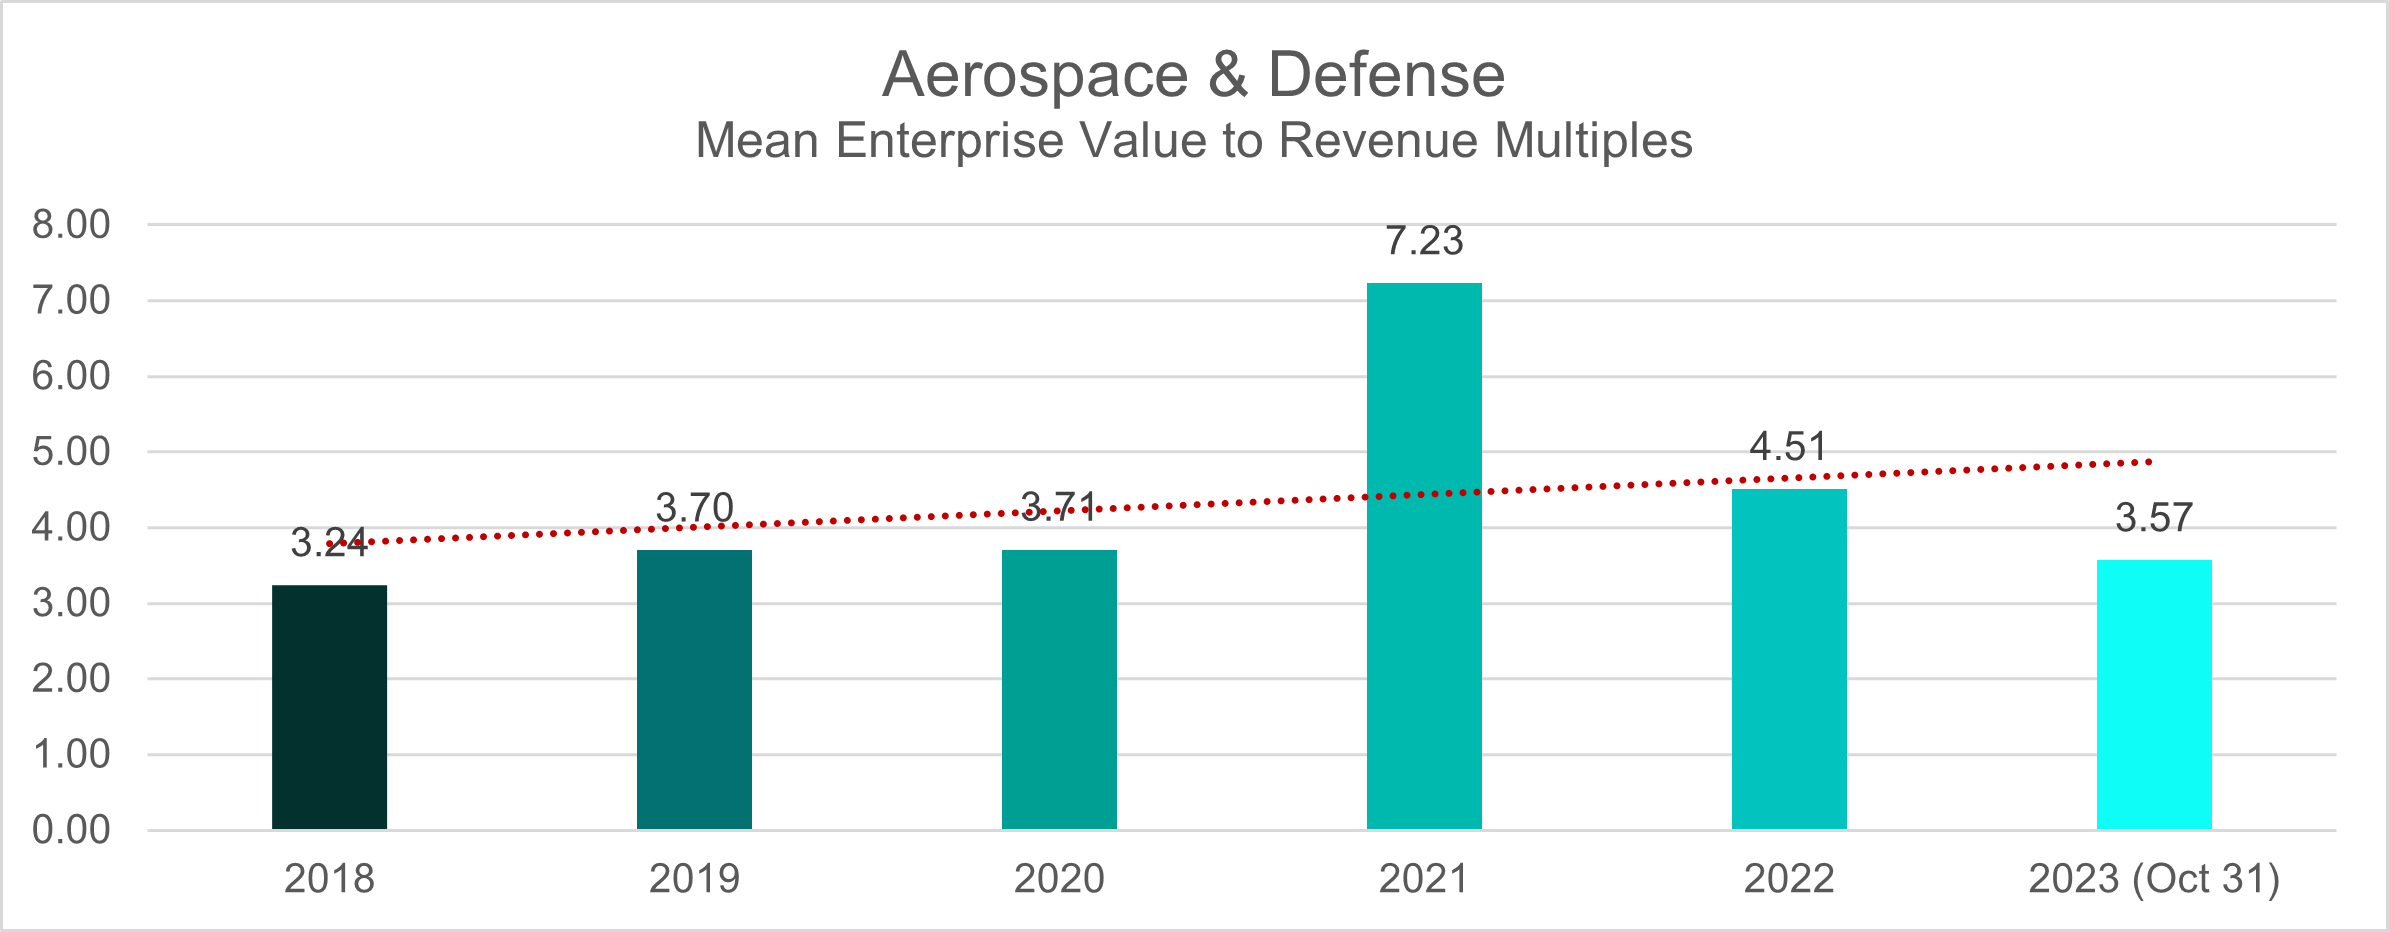
Employing the EV/Revenue ratio as a key metric, the Aerospace & Defense industry consistently exhibited a deal multiple mean within the 3-4 range throughout the years 2018 and 2019.
In 2020, this ratio held steady at 3.7, but a notable uptick occurred in 2021, elevating the deal multiple mean to 7.2.
In the aftermath of the pandemic in 2022, there was a decline, bringing the deal multiple mean down to 4.5. As of October 2023, the industry has witnessed a further adjustment, with the deal multiple mean settling at 3.6.
Automobile & Components
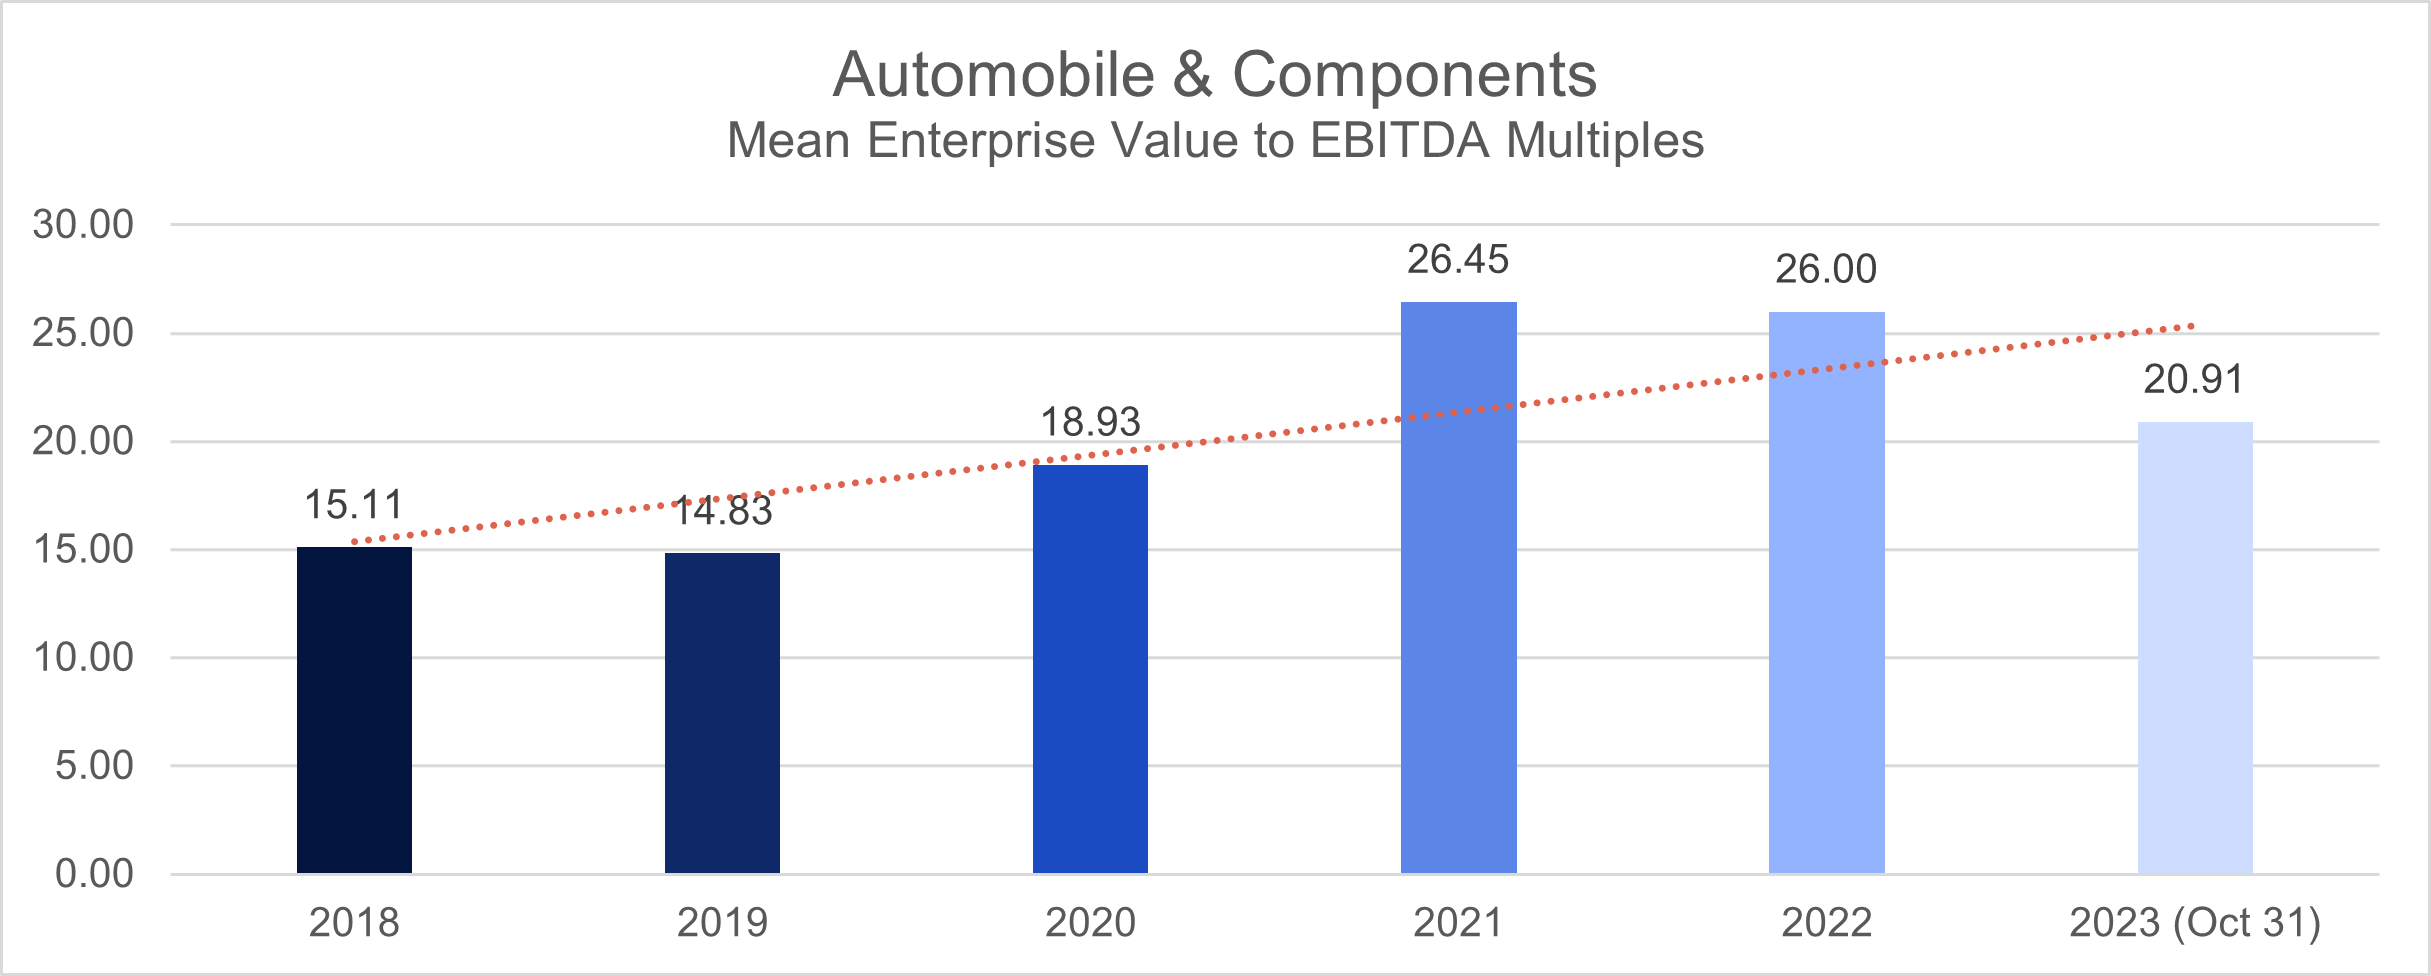
In the pre-pandemic era (2018-2019), the Automobile & Components industry exhibited an average deal multiple of 15, as evaluated through the EV/EBITDA metric.
Throughout the pandemic (2020-2021), there was a discernible escalation in deal multiples, surging to 18.9 in 2020 and peaking at 26.4 in 2021. This surge reflects a noteworthy shift in the industry’s valuation dynamics.
As we navigated the post-pandemic landscape from 2022 to October 2023, the median multiple adhered to the upward trajectory, with the deal multiple mean remaining consistent at 26. However, as of October 2023, there has been a discernible contraction, with the deal multiple dropping to 21.
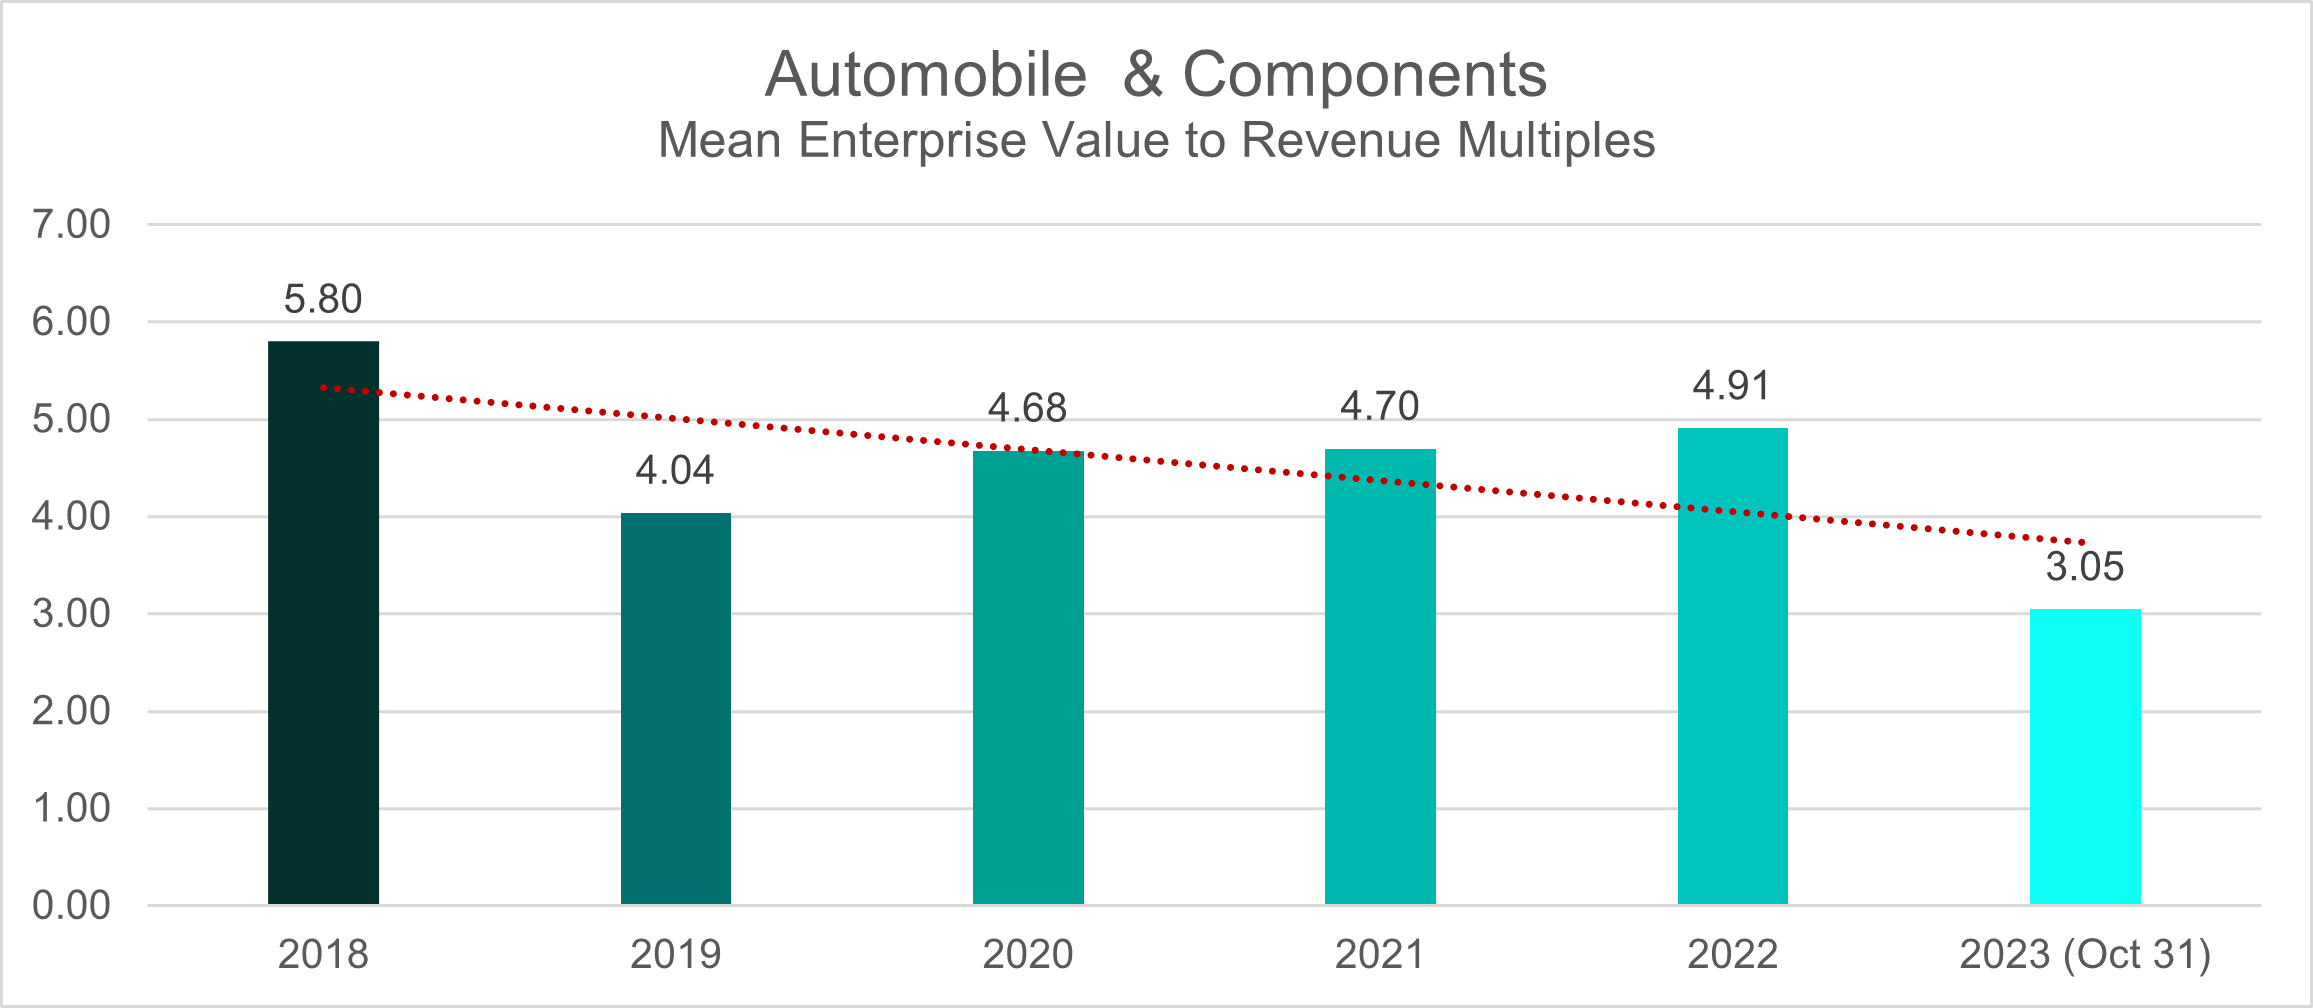
Analyzing using the EV/Revenue ratio reveals noteworthy trends in deal multiples. In the pre-pandemic period, particularly in 2018, the mean stood at 5.8, only to decline to 4 in 2019.
Subsequently, amidst the challenges of 2020-2021, there was a modest uptick in the deal multiples mean, reaching 4.7. This positive trajectory extended into 2022, where the mean reached 4.9. However, the trend took an unexpected turn as of October 2023, witnessing a dip to 3.
Banks
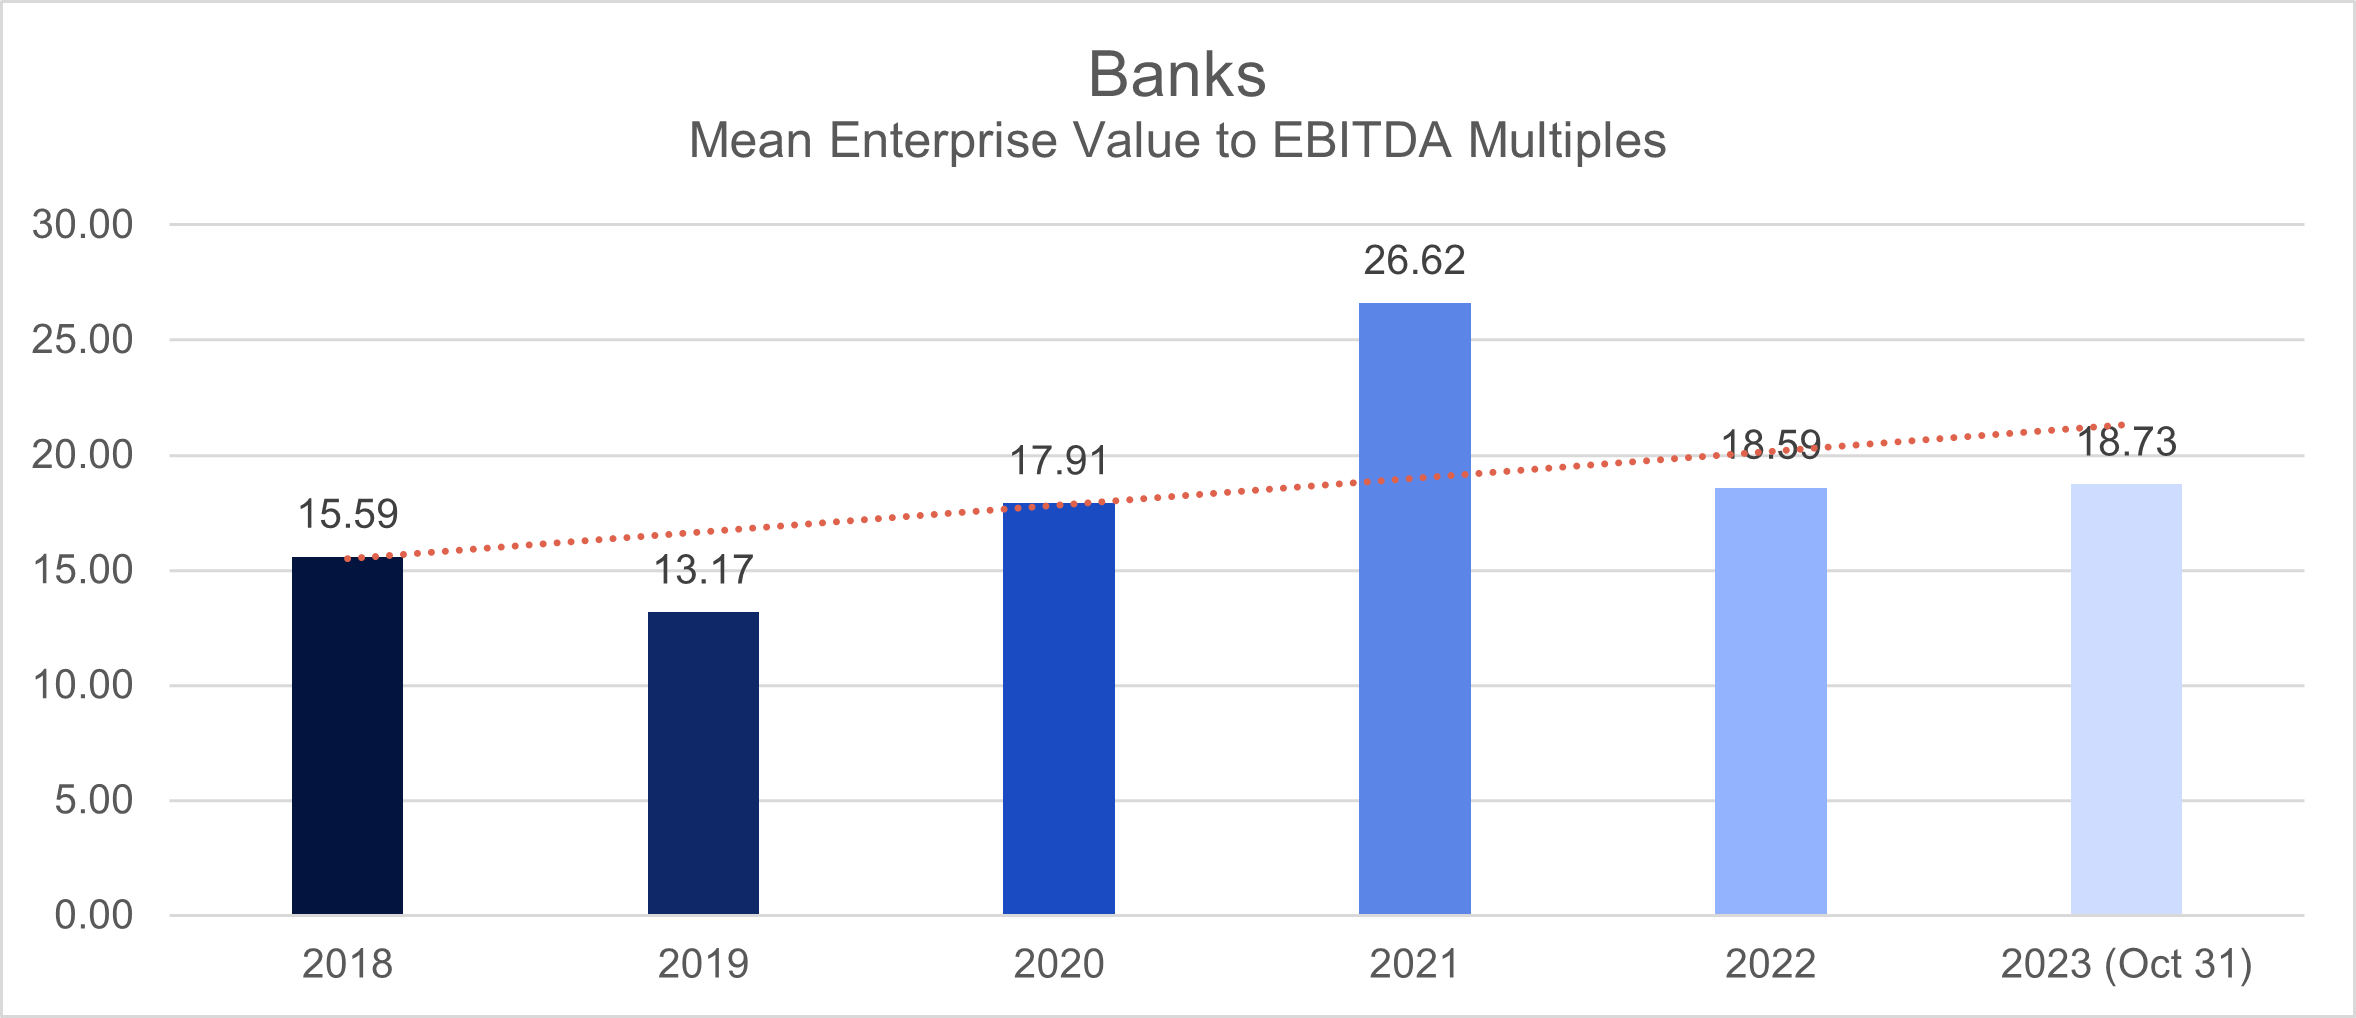
In the fiscal years 2018-2019, the Banking sector displayed median deal multiples, as measured by the EV/EBITDA metric, at 15.6 and 13, respectively.
The onset of the pandemic brought about a noticeable upward trend in deal multiples. By 2020, the median multiples rose to 18, indicating an apparent surge in valuations within the Banking sector. This trend extended into 2021, with deal multiples further increasing to 26.6, pointing towards a robust market and heightened investor confidence during this period.
However, post-pandemic, there was a subsequent decline in deal multiples from 2022 to October 2023, settling at 18.6.
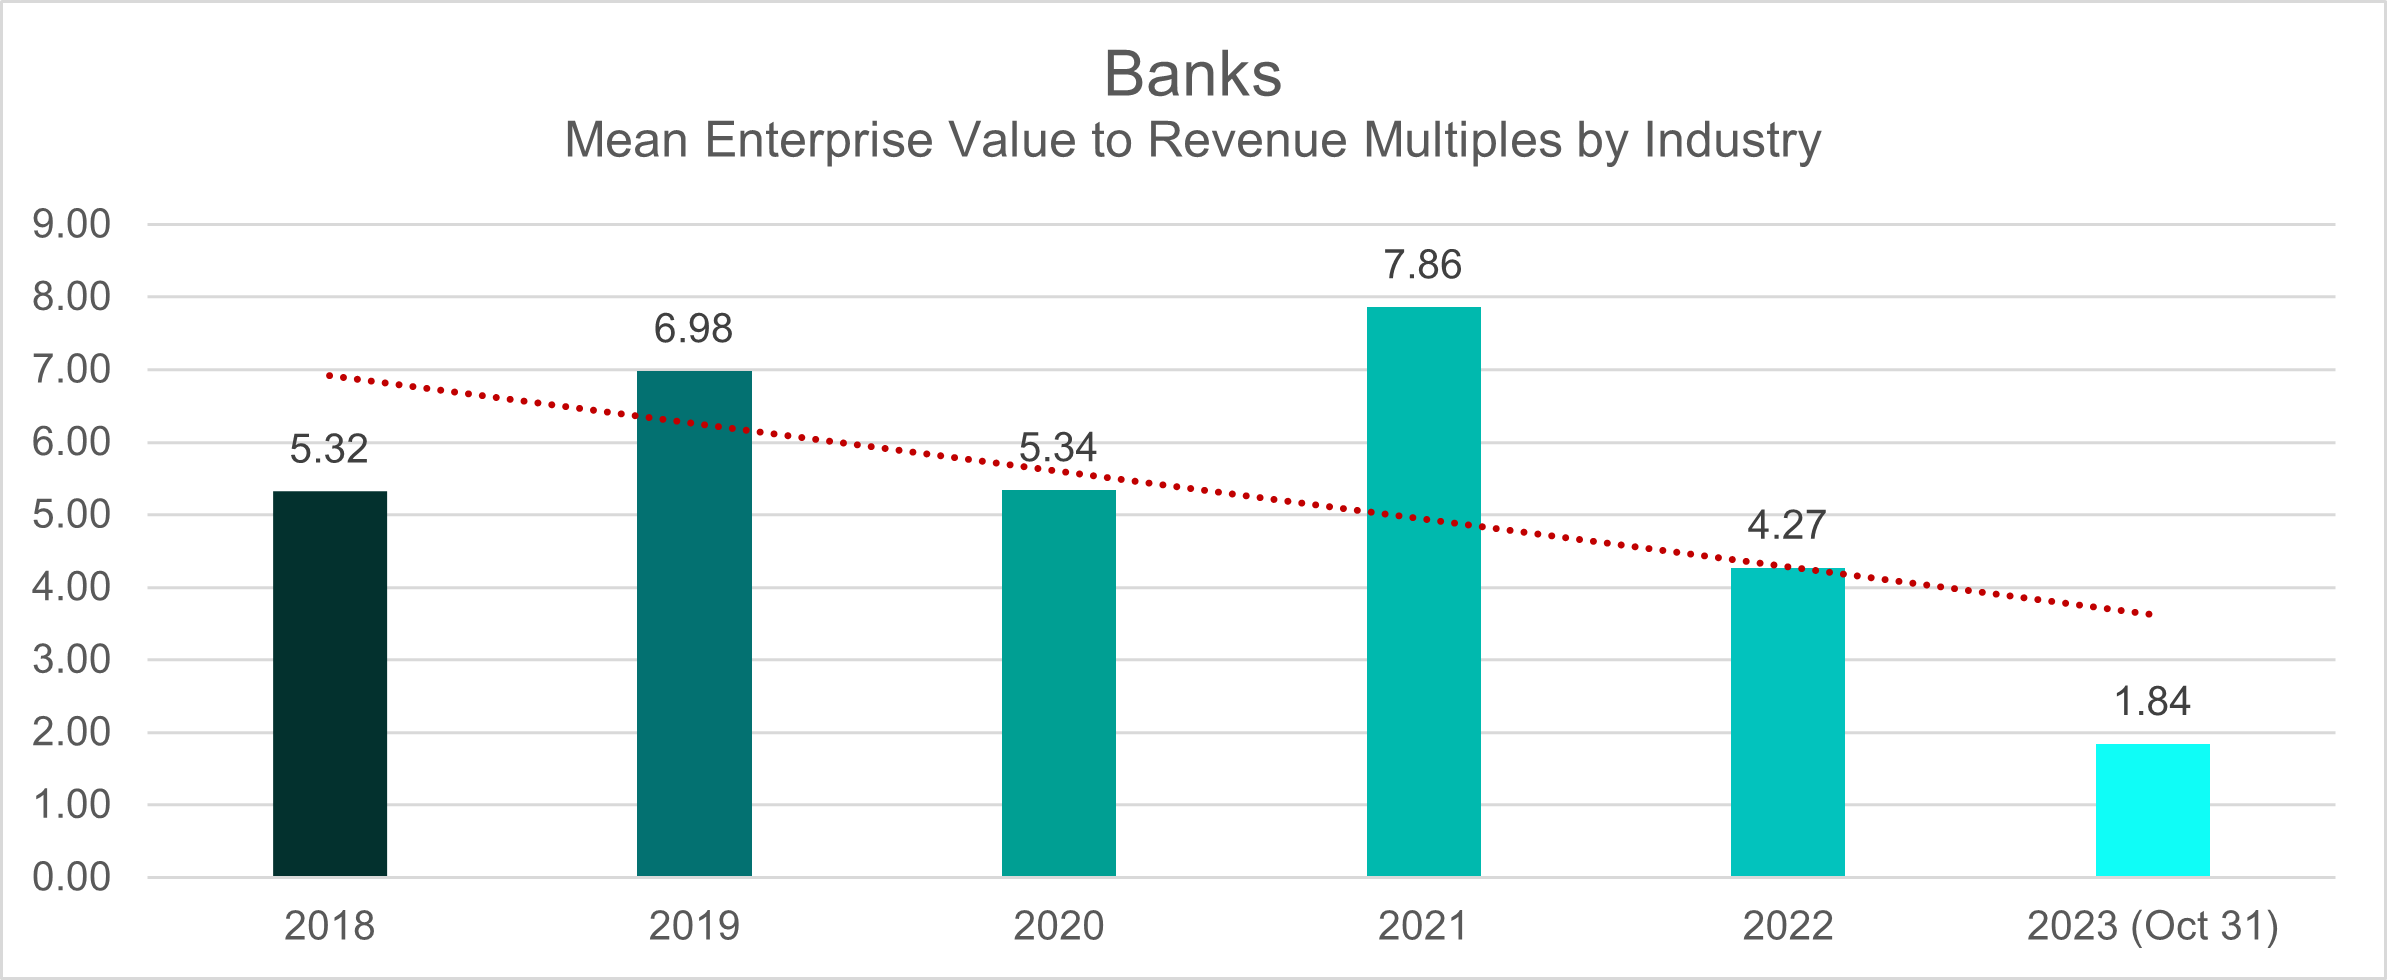
The EV/Revenue multiples for the Banking industry displayed a discernible trend during the pre-pandemic era. In 2018, the mean multiple stood at 5.3, experiencing an upward trajectory to 7 in 2019.
This trend continued into the turbulent years of 2020-2021, witnessing a dip to 5.3 in 2020 before surging to 7.7. However, post-pandemic recovery manifested a notable decline, with the mean multiple retracting to 4.2 in 2022.
As of October 2023, a substantial deviation is evident, with the EV/Revenue multiple currently registering at 1.8.
Biotech & Pharma
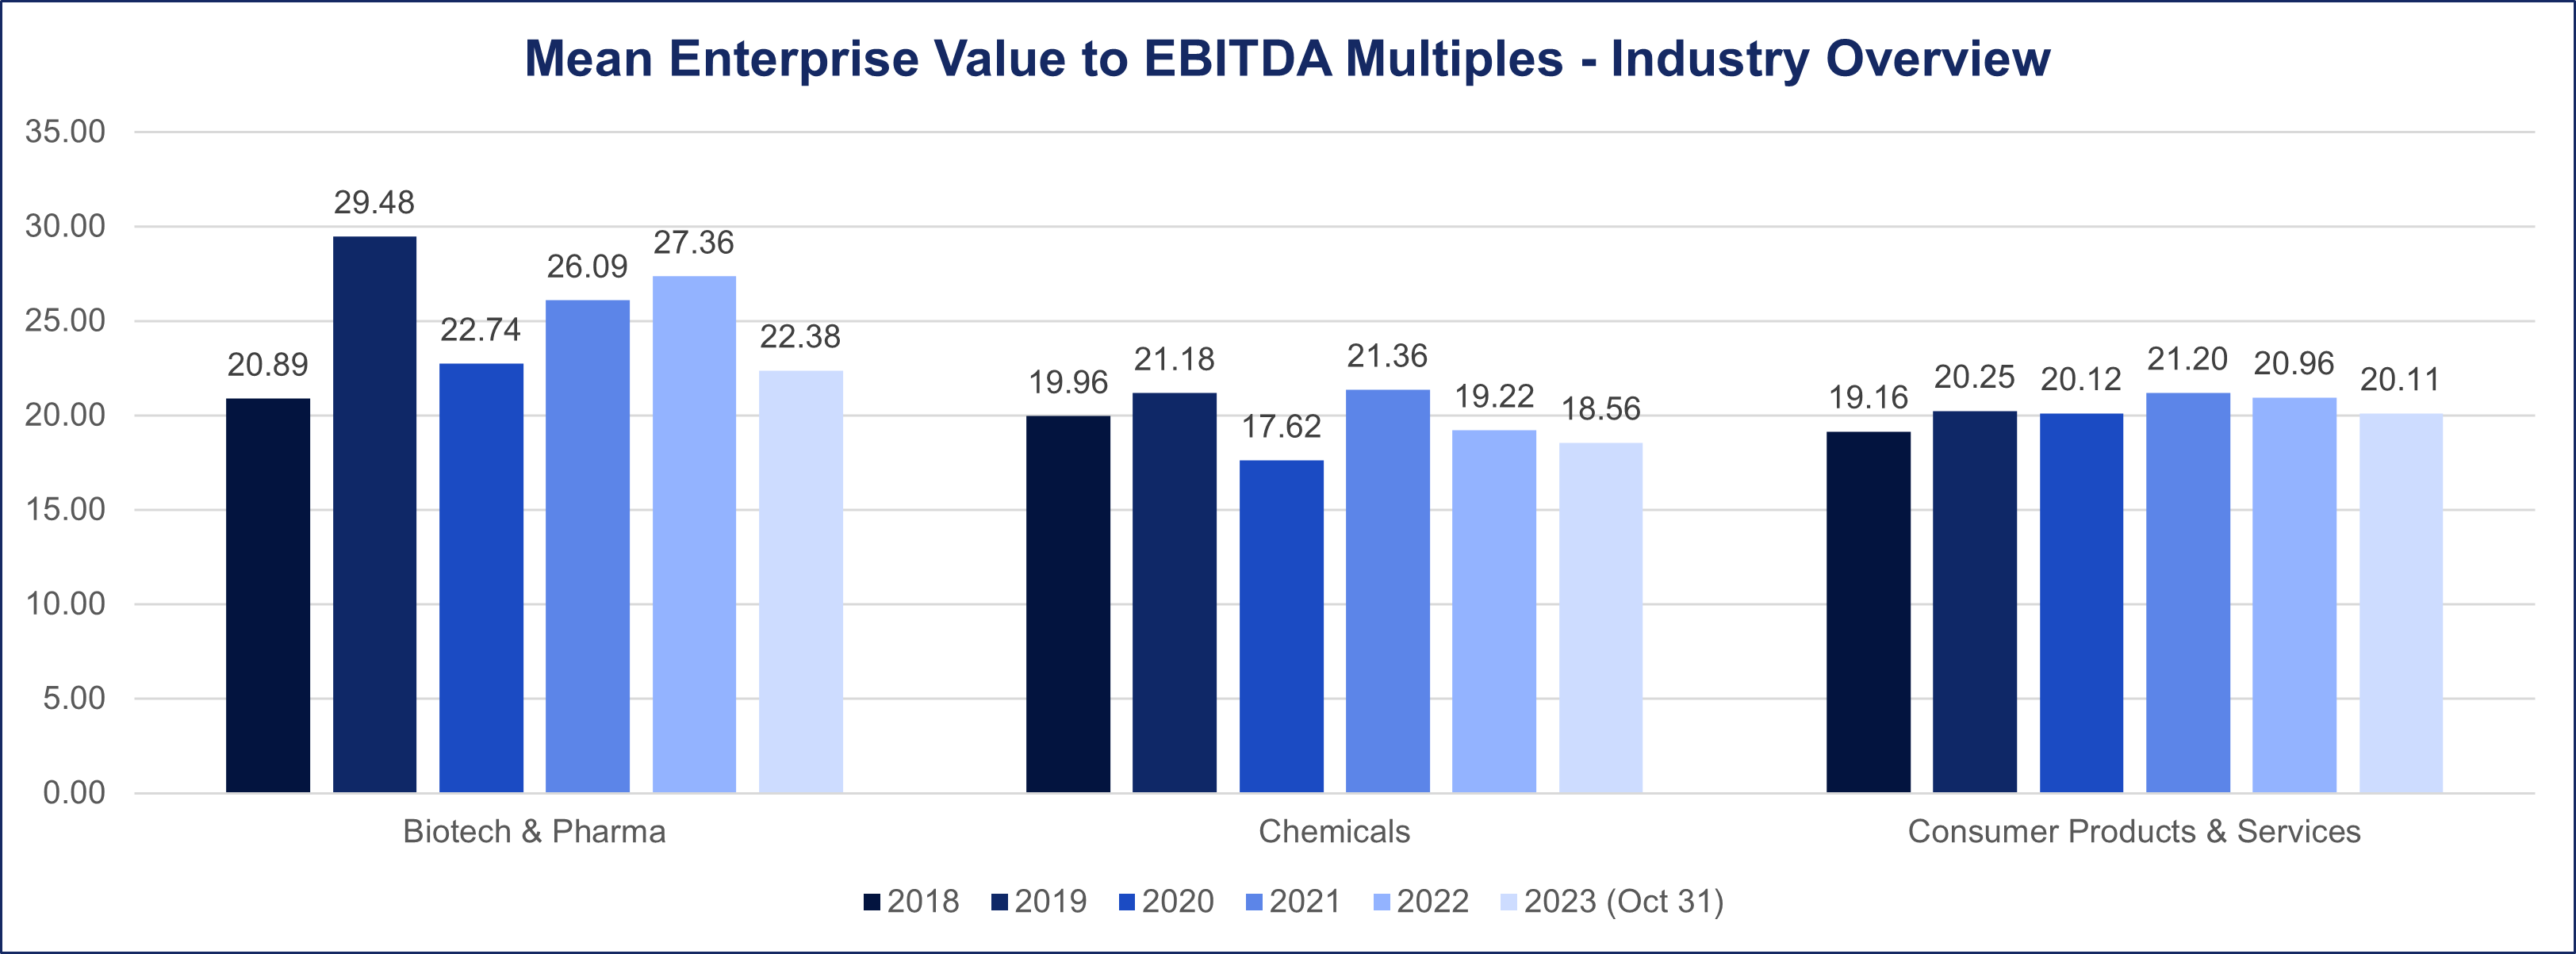
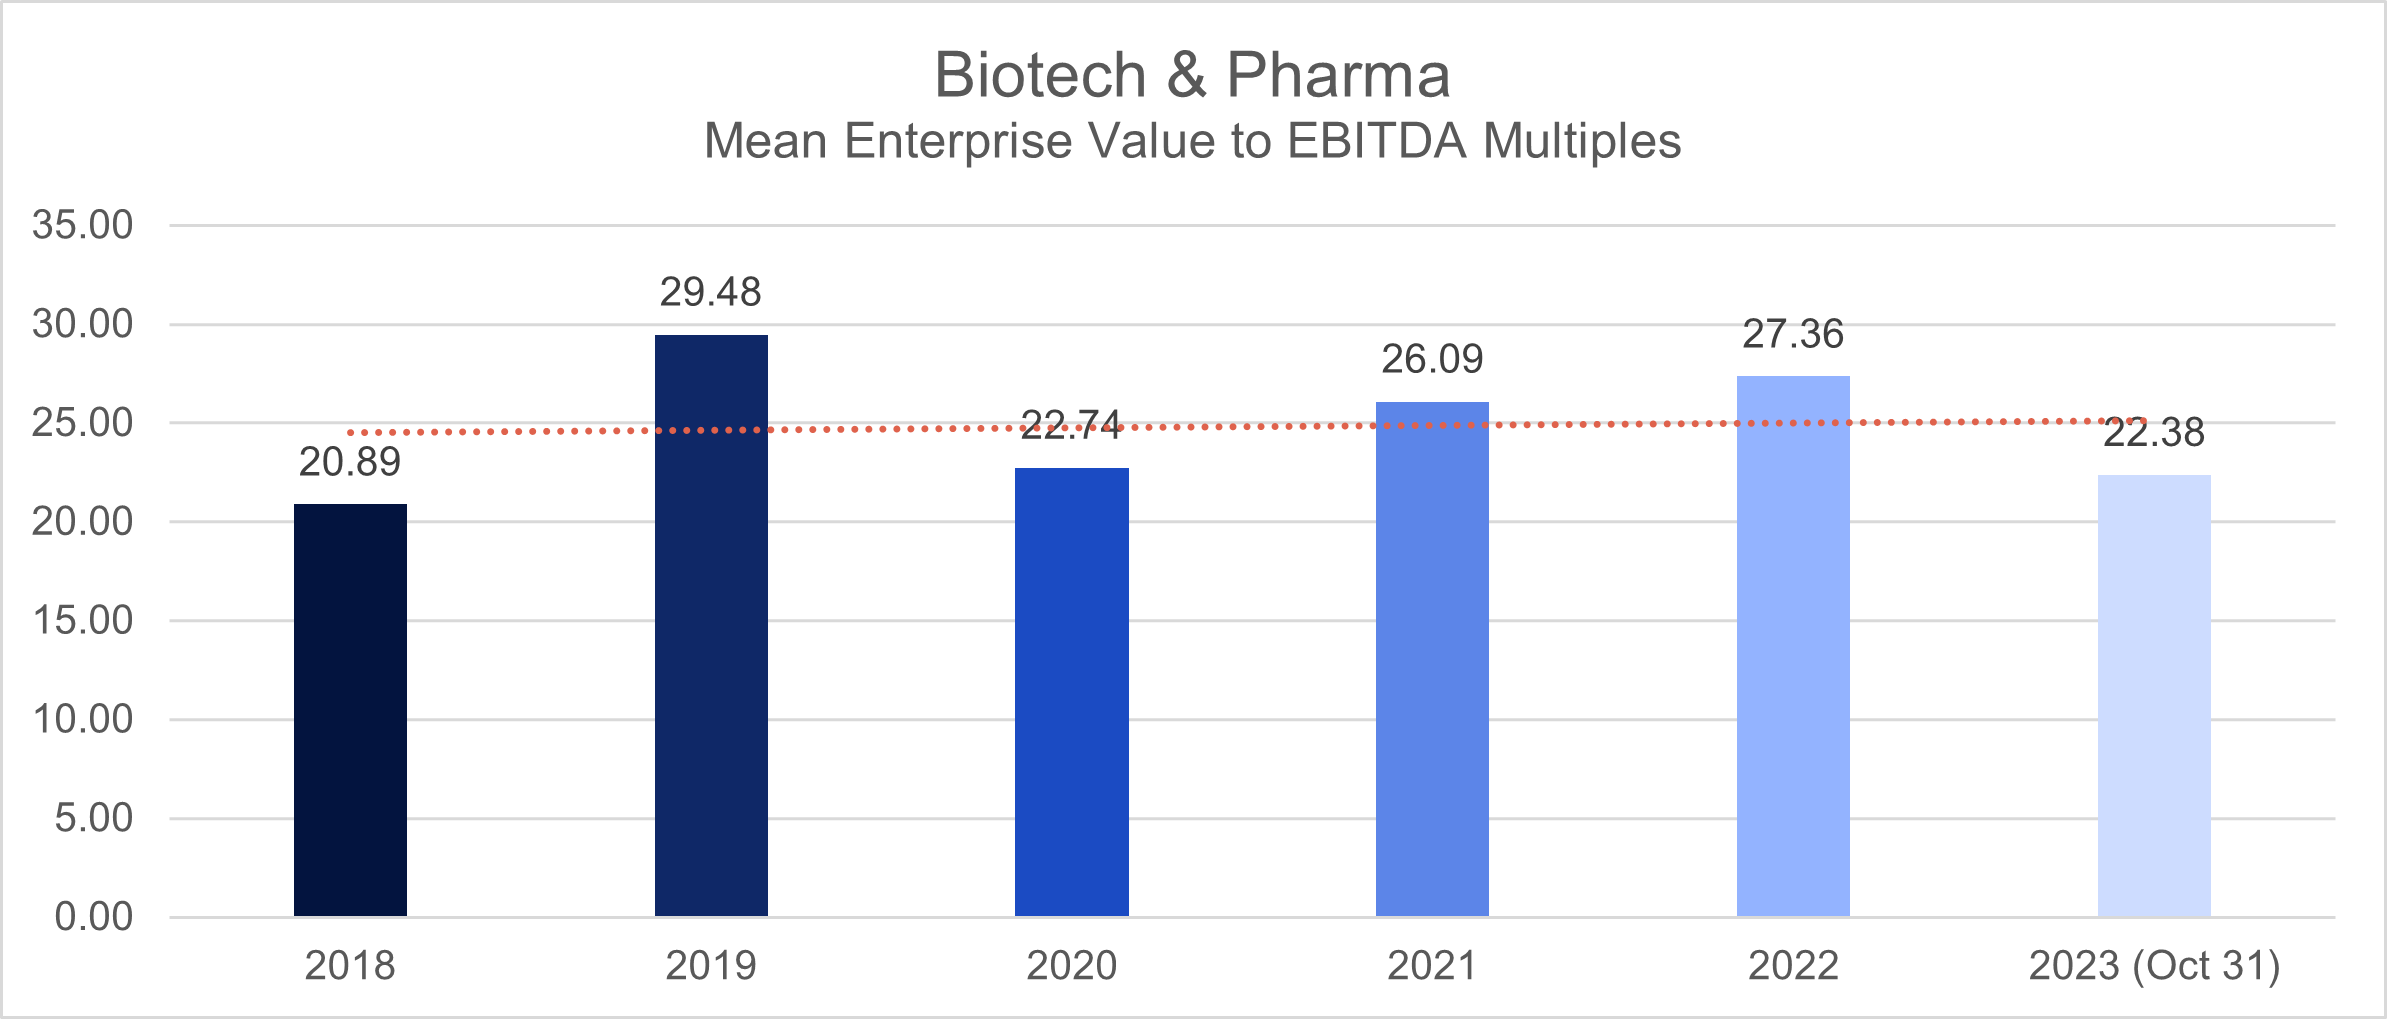
During the 2018-2019 period, the Biotech and Pharma industry exhibited strong deal multiples, averaging 21 and 29, respectively, as measured by the EV/EBITDA metric.
In response to the challenges posed by the Pandemic Period, there was a noticeable decline in deal multiples, dropping to 22.7 in 2020. However, a significant recovery took place the following year, with the mean deal multiple rising to 26.
This upward trend persisted in 2022, recording a deal multiple of 27.3. As of October 2023, the industry’s deal multiples average stands at 22.4, highlighting the dynamic nature of valuation trends.
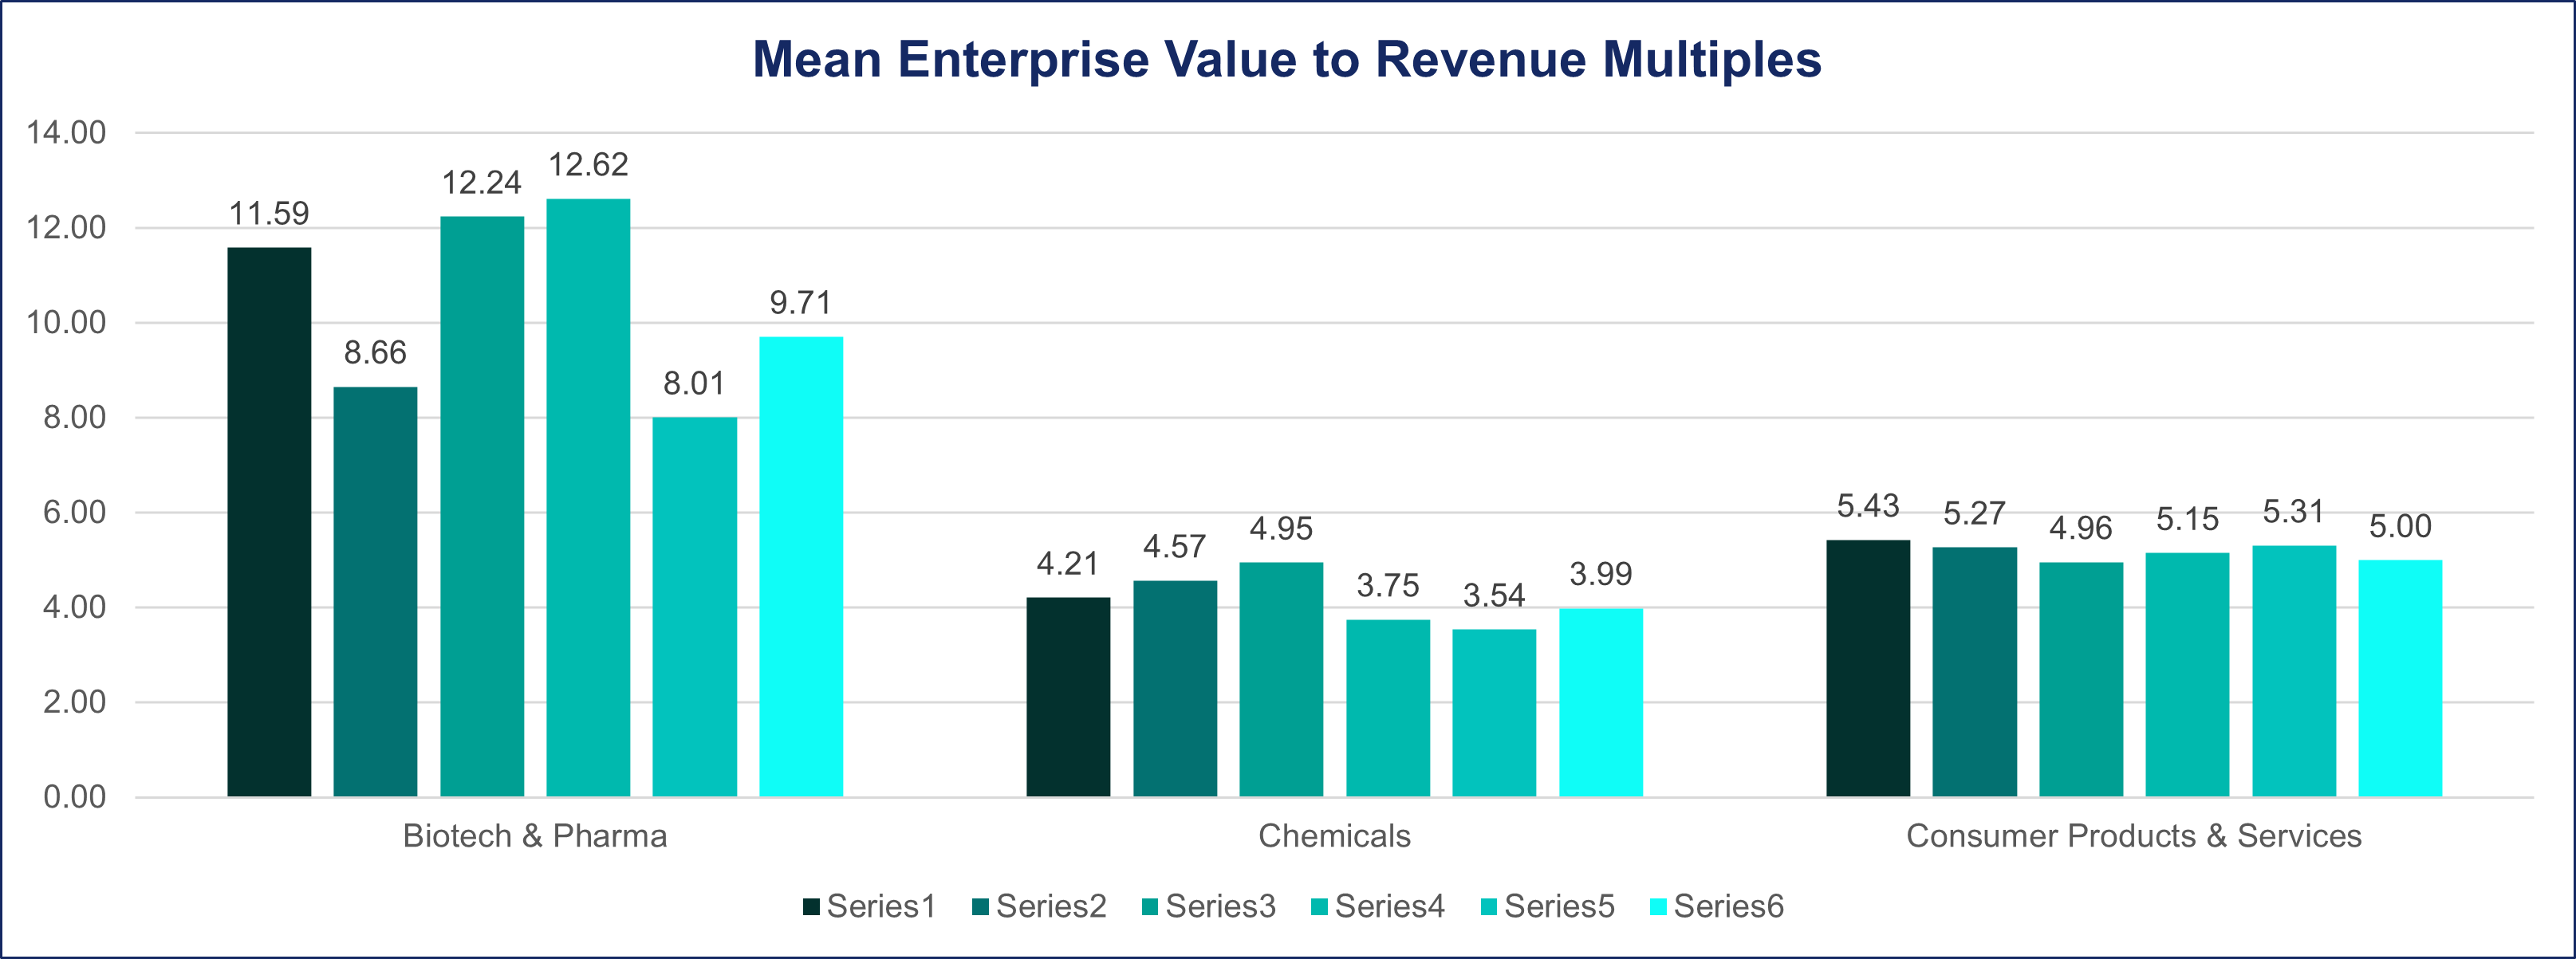
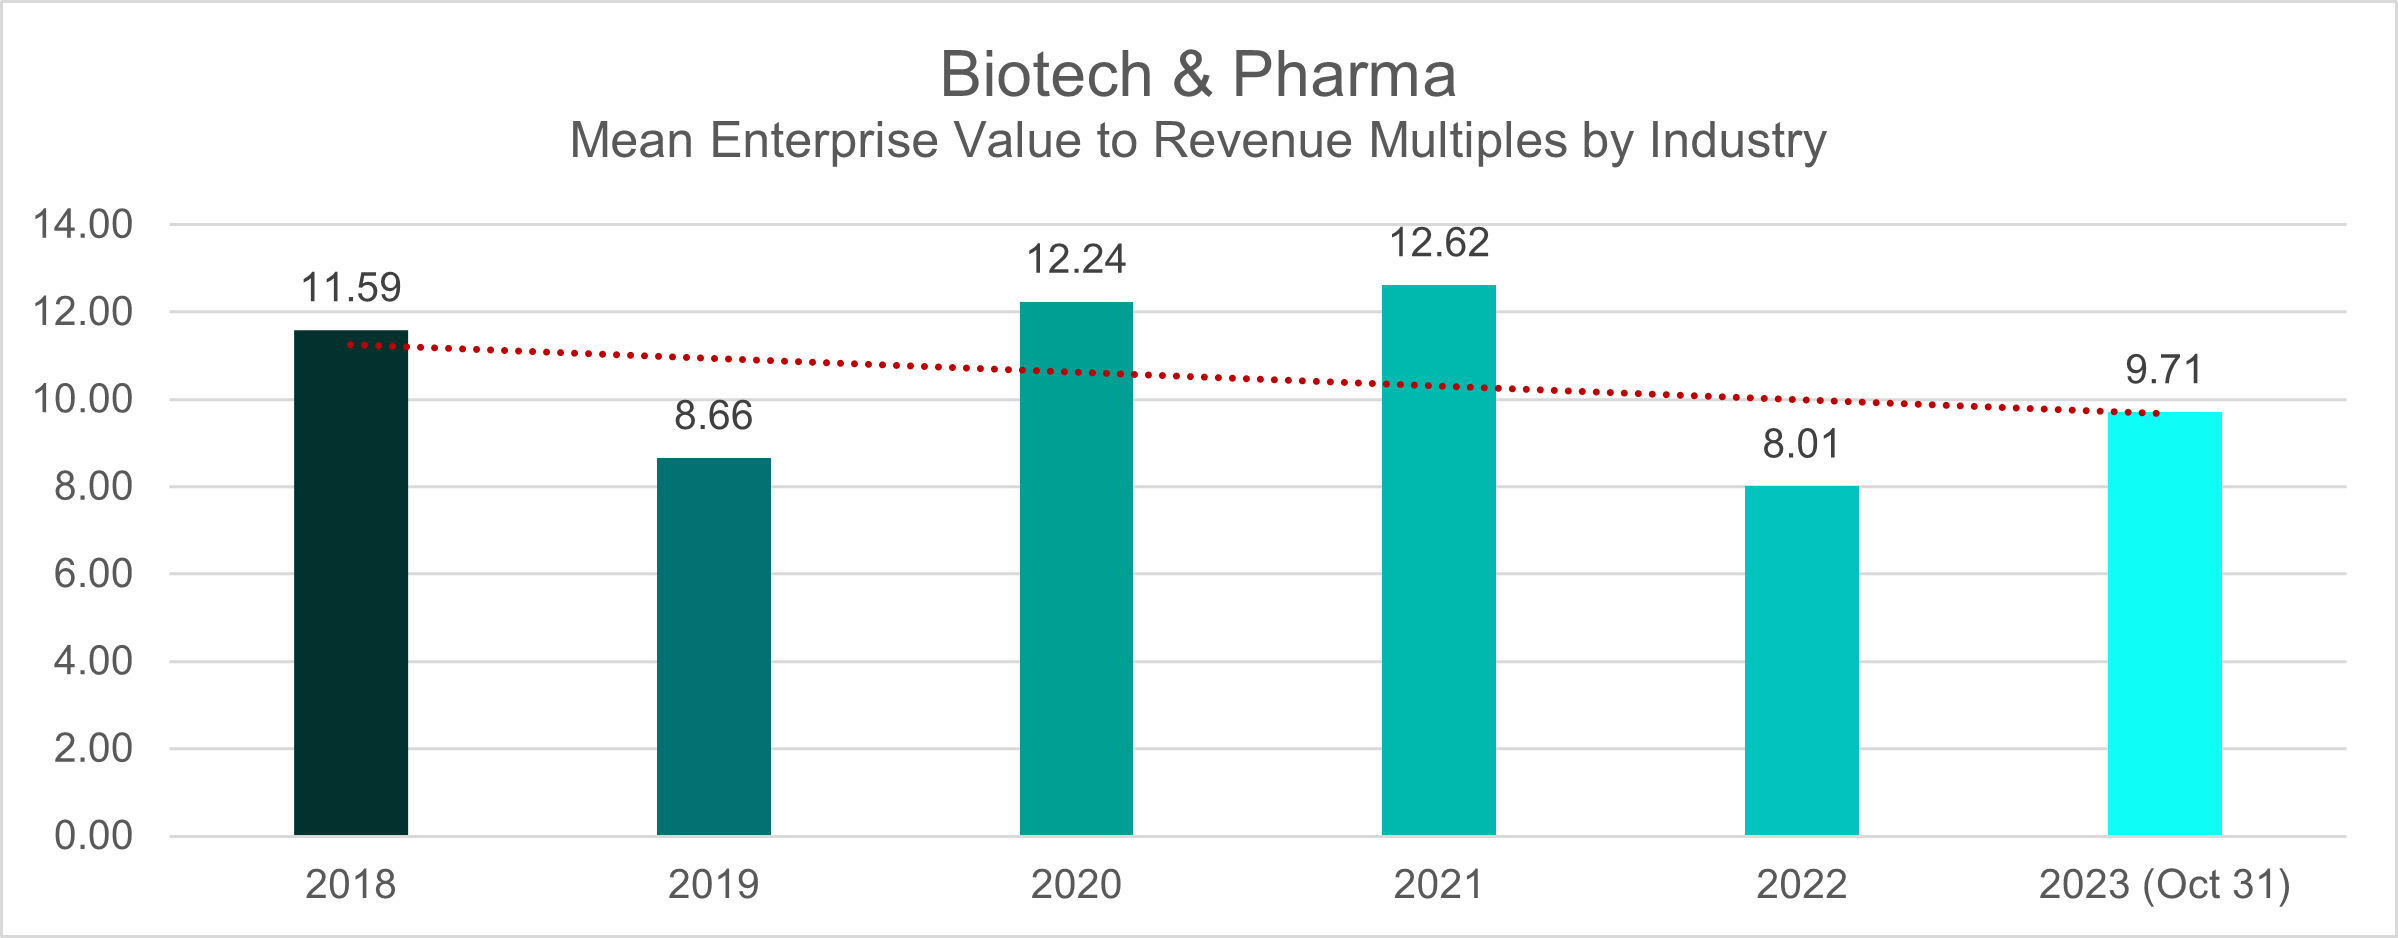
In the pre-pandemic period of 2018-2019, the ratio stood at 11.6 and 8.7, respectively using EV/Revenue ratio. Throughout the challenging years of 2020-2021, deal multiples mean consistently in the 12 range. However, there was a notable dip in this valuation metric, dropping to 8 in 2022. As of October 2023, the average EV/Revenue multiple for the Biotech & Pharma sectors has stabilized at 9.7, indicating a nuanced landscape in deal valuations within these industries.
Chemicals
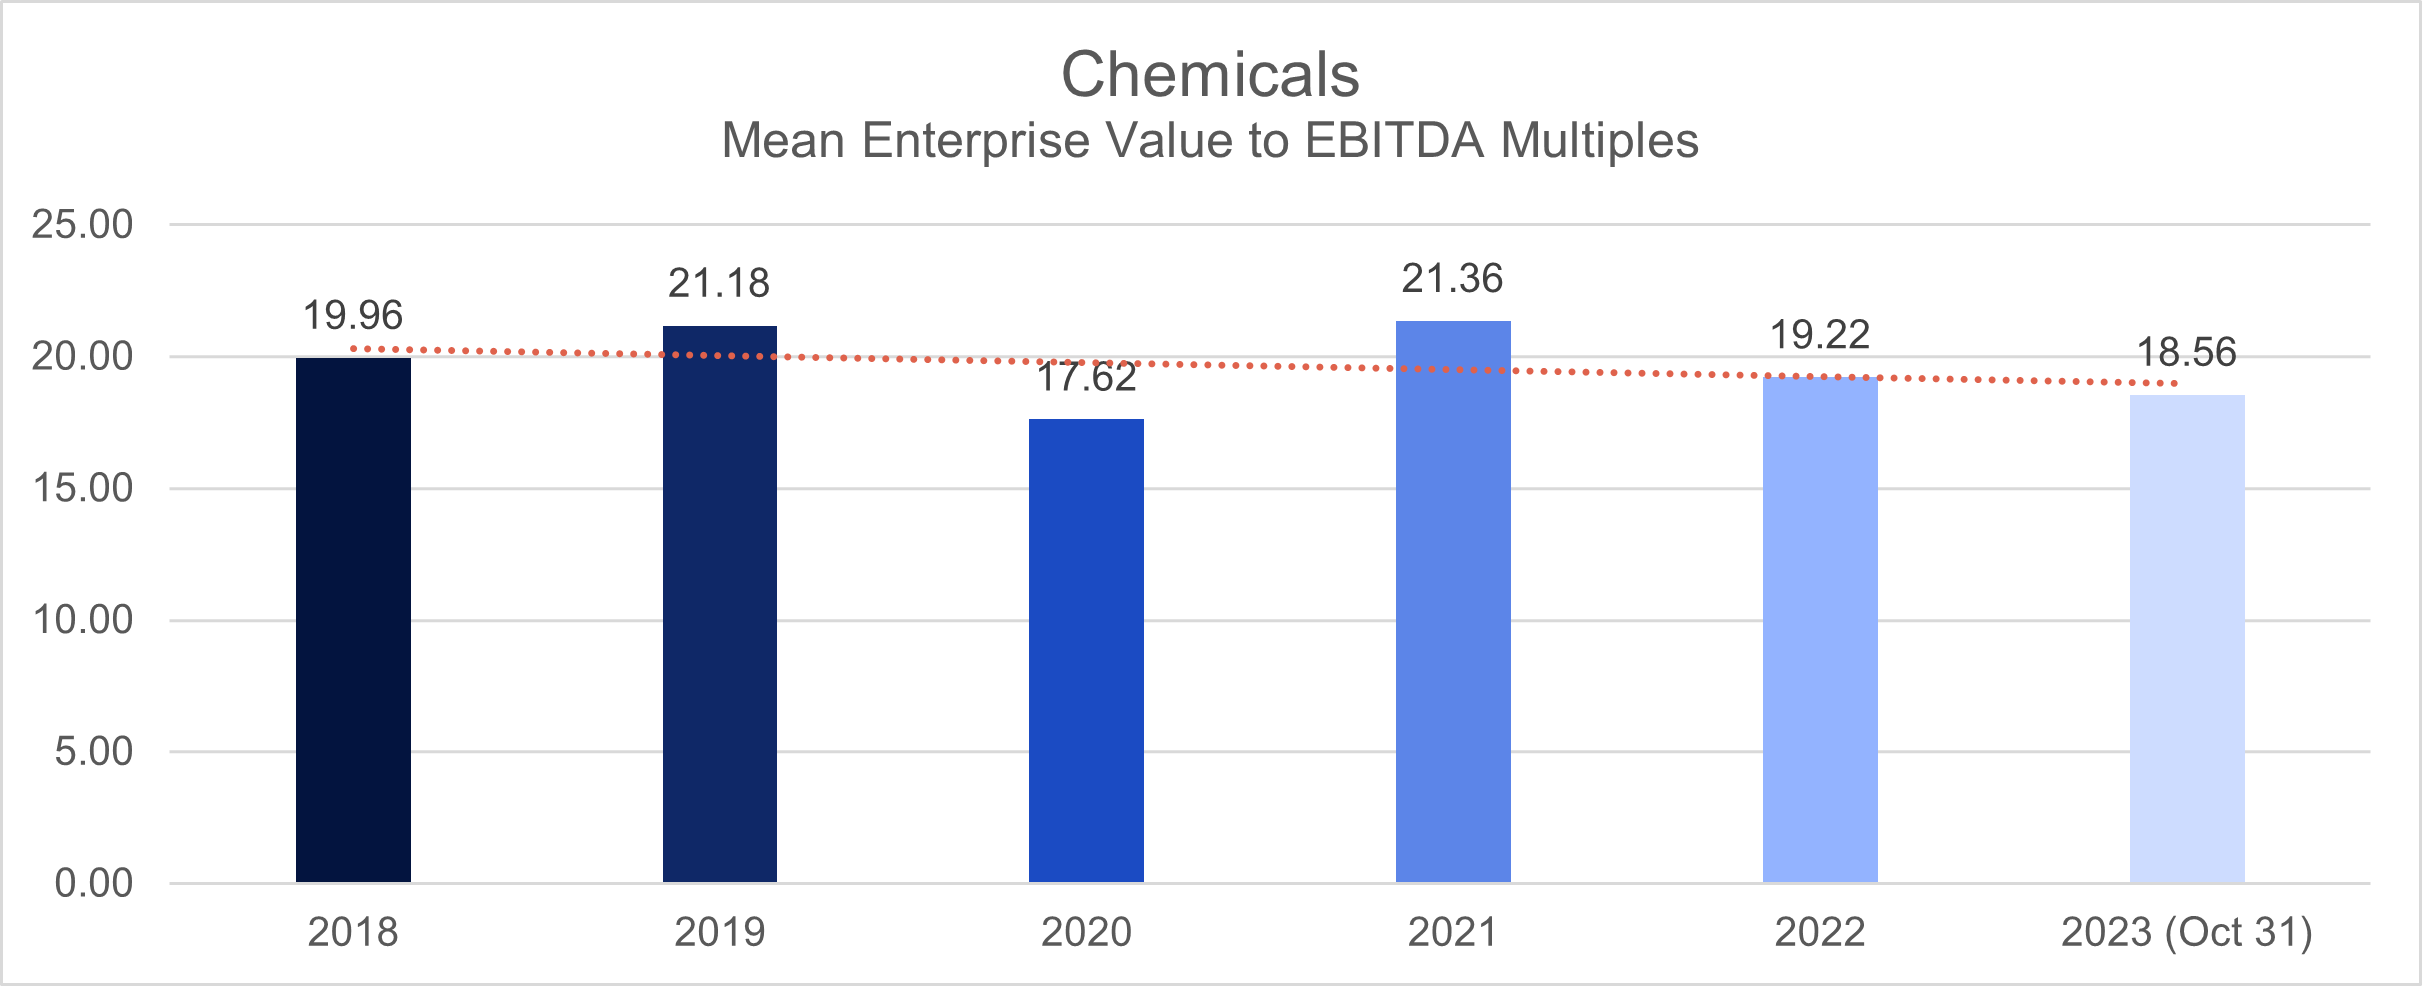
Between 2018 and 2019, the Chemical Industry demonstrated an average deal multiple range of 20-21, measured by the Enterprise Value to Earnings Before Interest, Taxes, Depreciation, and Amortization (EV/EBITDA) metric.
During global pandemic from 2020 to 2021, the industry exhibited a decrease in deal multiples mean to 17.6 (2020) but recovering the next year with 21.
However, the post-pandemic recovery period, from 2022 to October 2023, witnessed a shift in the deal landscape. During this time, there was a discernible downturn in deal multiples, dropping to 19.
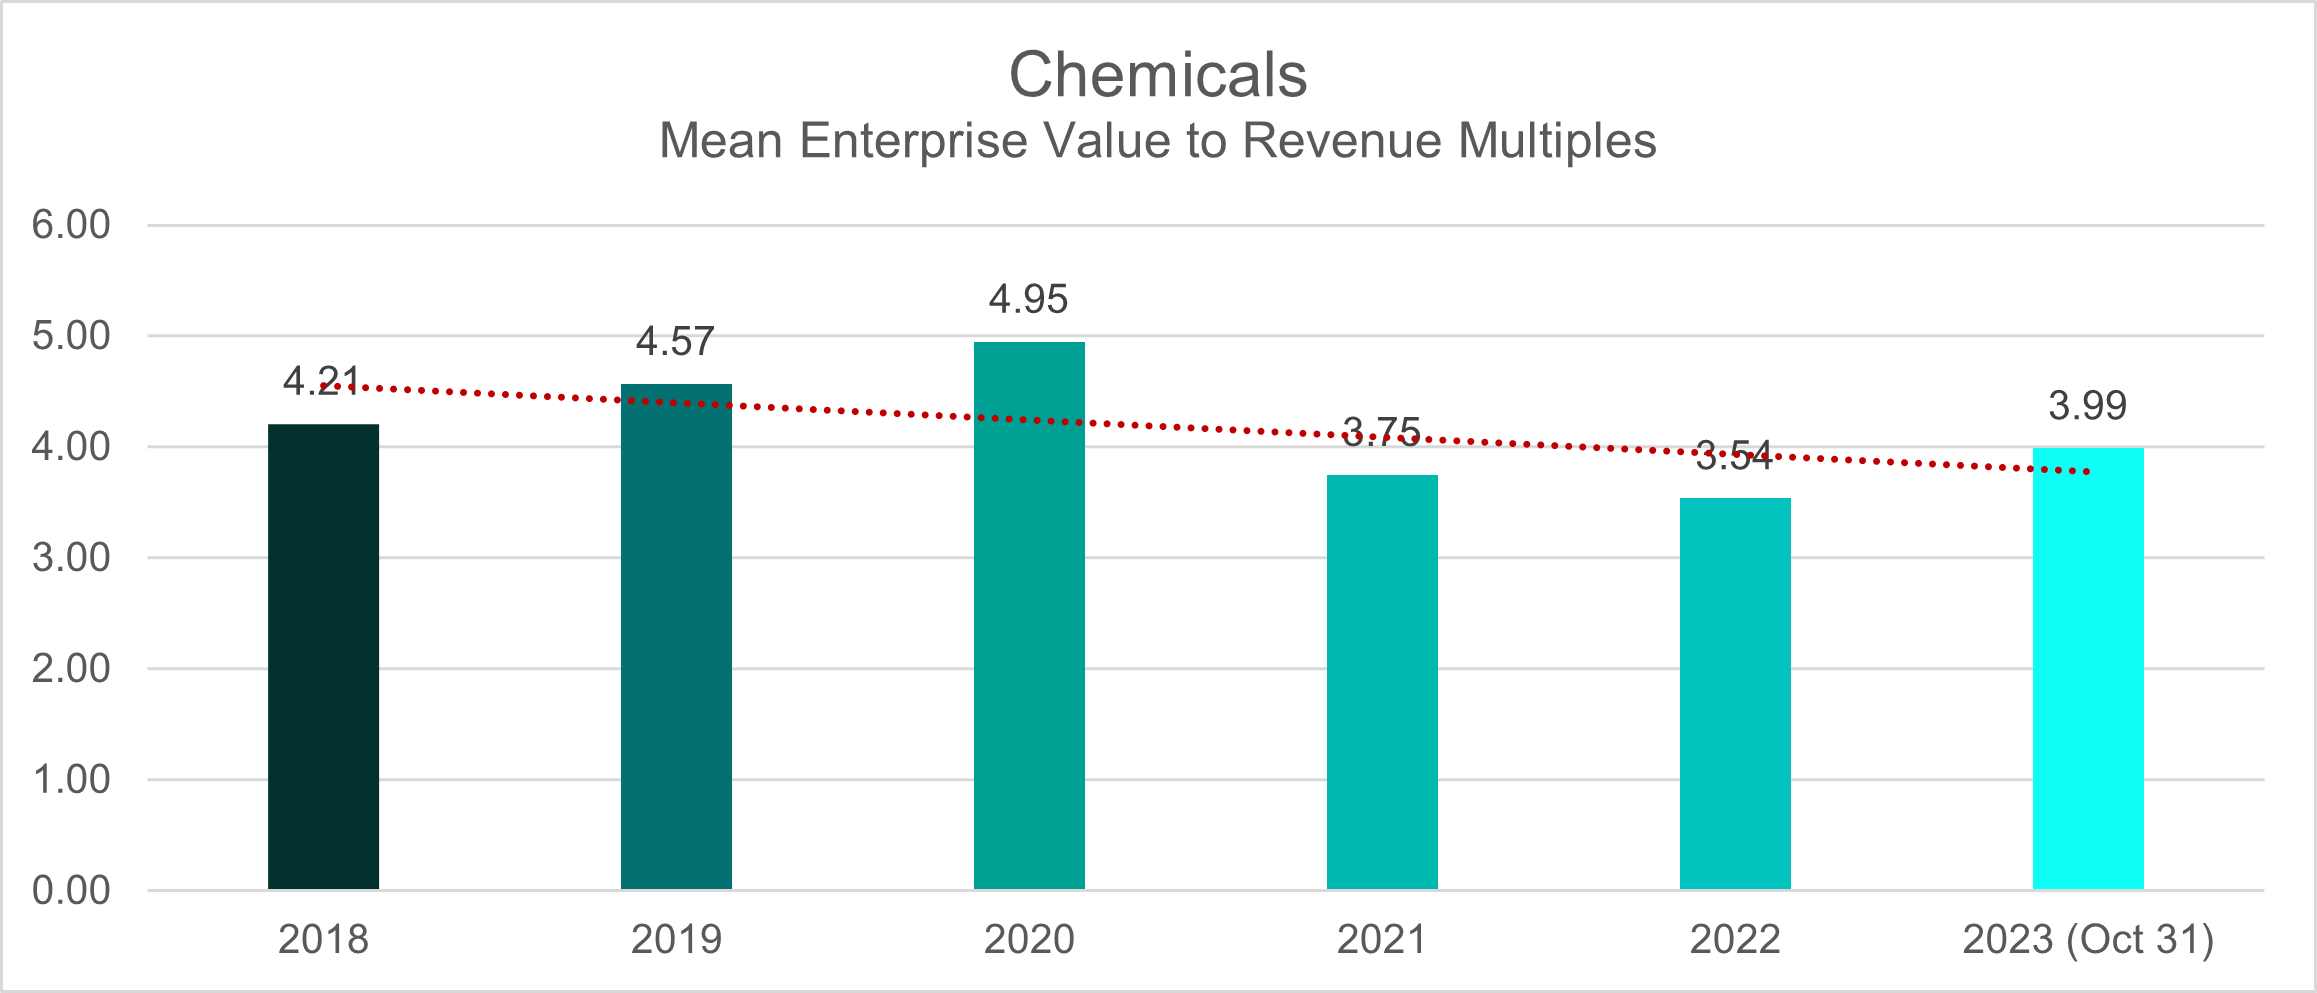
Utilizing the EV/Revenue metric, we observe a nuanced trajectory in deal multiples over distinct time periods. In the pre-pandemic years of 2018-2019, the average deal multiple held steady at 4. However, a discernible shift occurred in 2020, with the mean multiple experiencing a slight uptick to 4.9, only to subsequently decline to 3.7 in 2021.
This downward trend persisted into 2022, marking an average deal multiple of 3.5. As of October 2023, the deal multiple stands at 4, reflecting an intriguing reversion to the pre-pandemic levels.
Consumer Products & Services
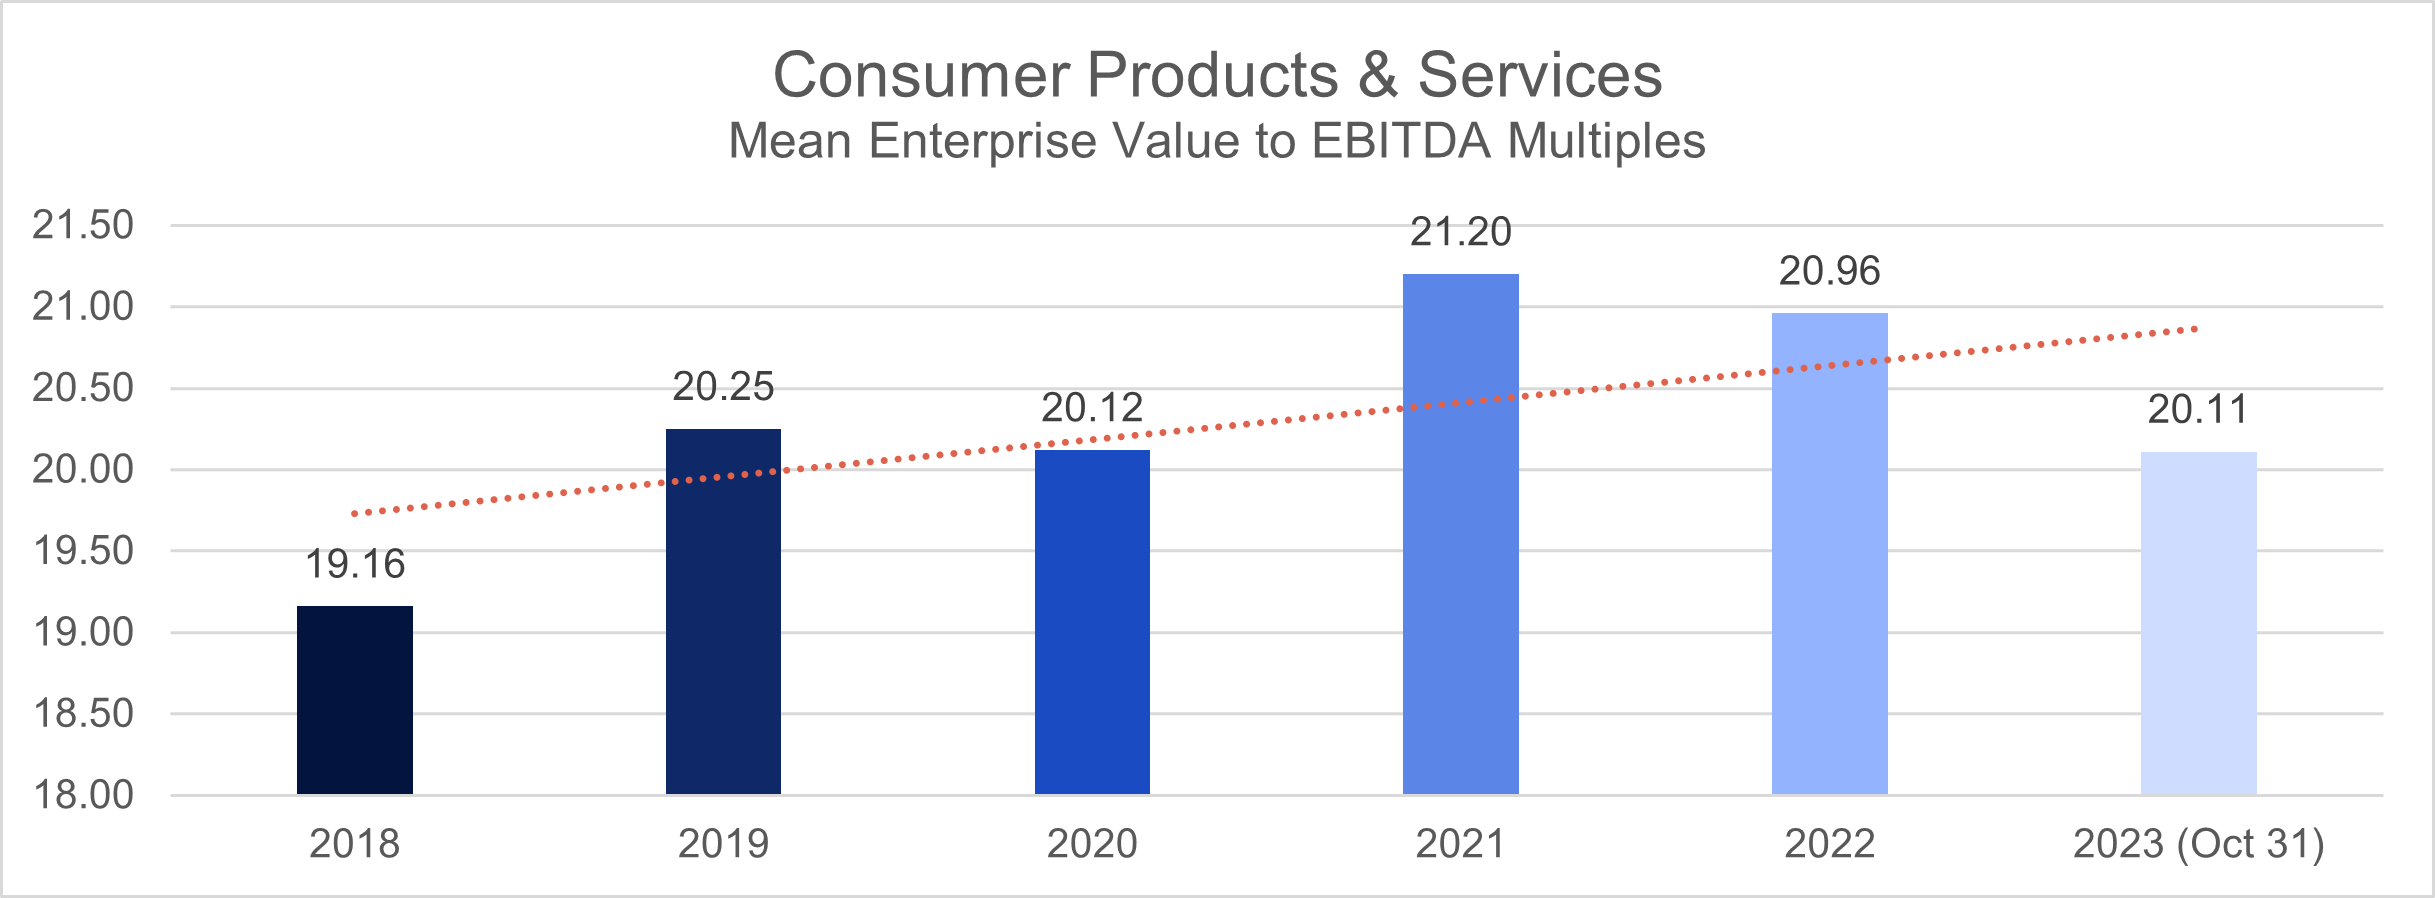
In the pre-pandemic years, specifically 2018 and 2019, the Consumer Products & Services Industry had deal multiples of 19 and 20, respectively, based on the (EV/EBITDA) ratio.
Amid the pandemic’s challenges, spanning from 2020 to 2021, the industry showcased remarkable resilience by sustaining deal multiples within a relatively narrow range of 20 to 21. This steadfast stability during economically turbulent times underscores the sector’s adaptability and financial robustness.
Even in the post-pandemic recovery phase, extending from 2022 until October 2023, the Consumer Products & Services industry continued its trajectory of stability, maintaining deal multiples within the established range of 20 to 21.
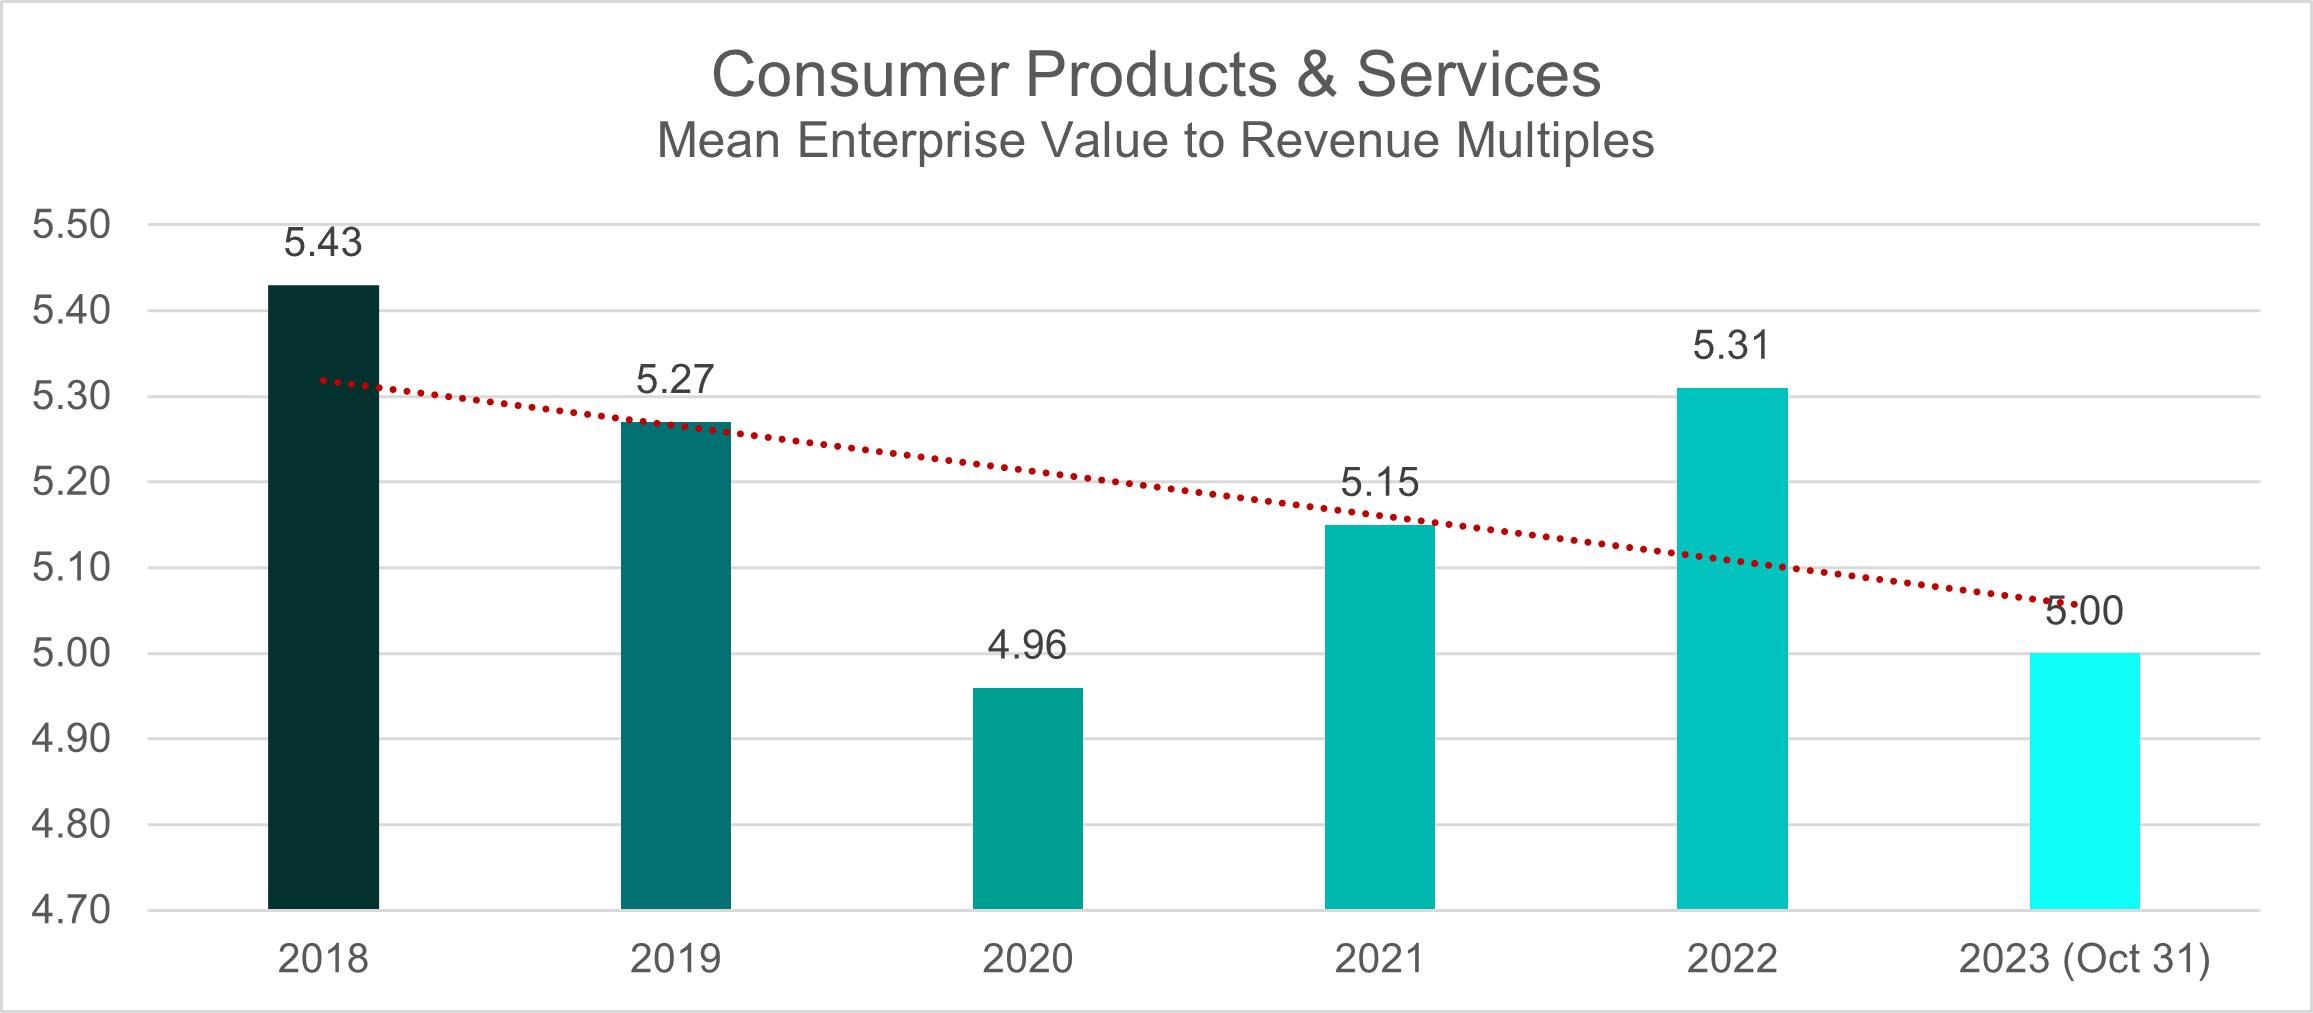
The same consistent trend is observed when considering the EV/Revenue ratio, where the Consumer sector maintained an average deal multiple of 5 throughout the entirety of 2018 up until October 2023.
Containers & Packaging
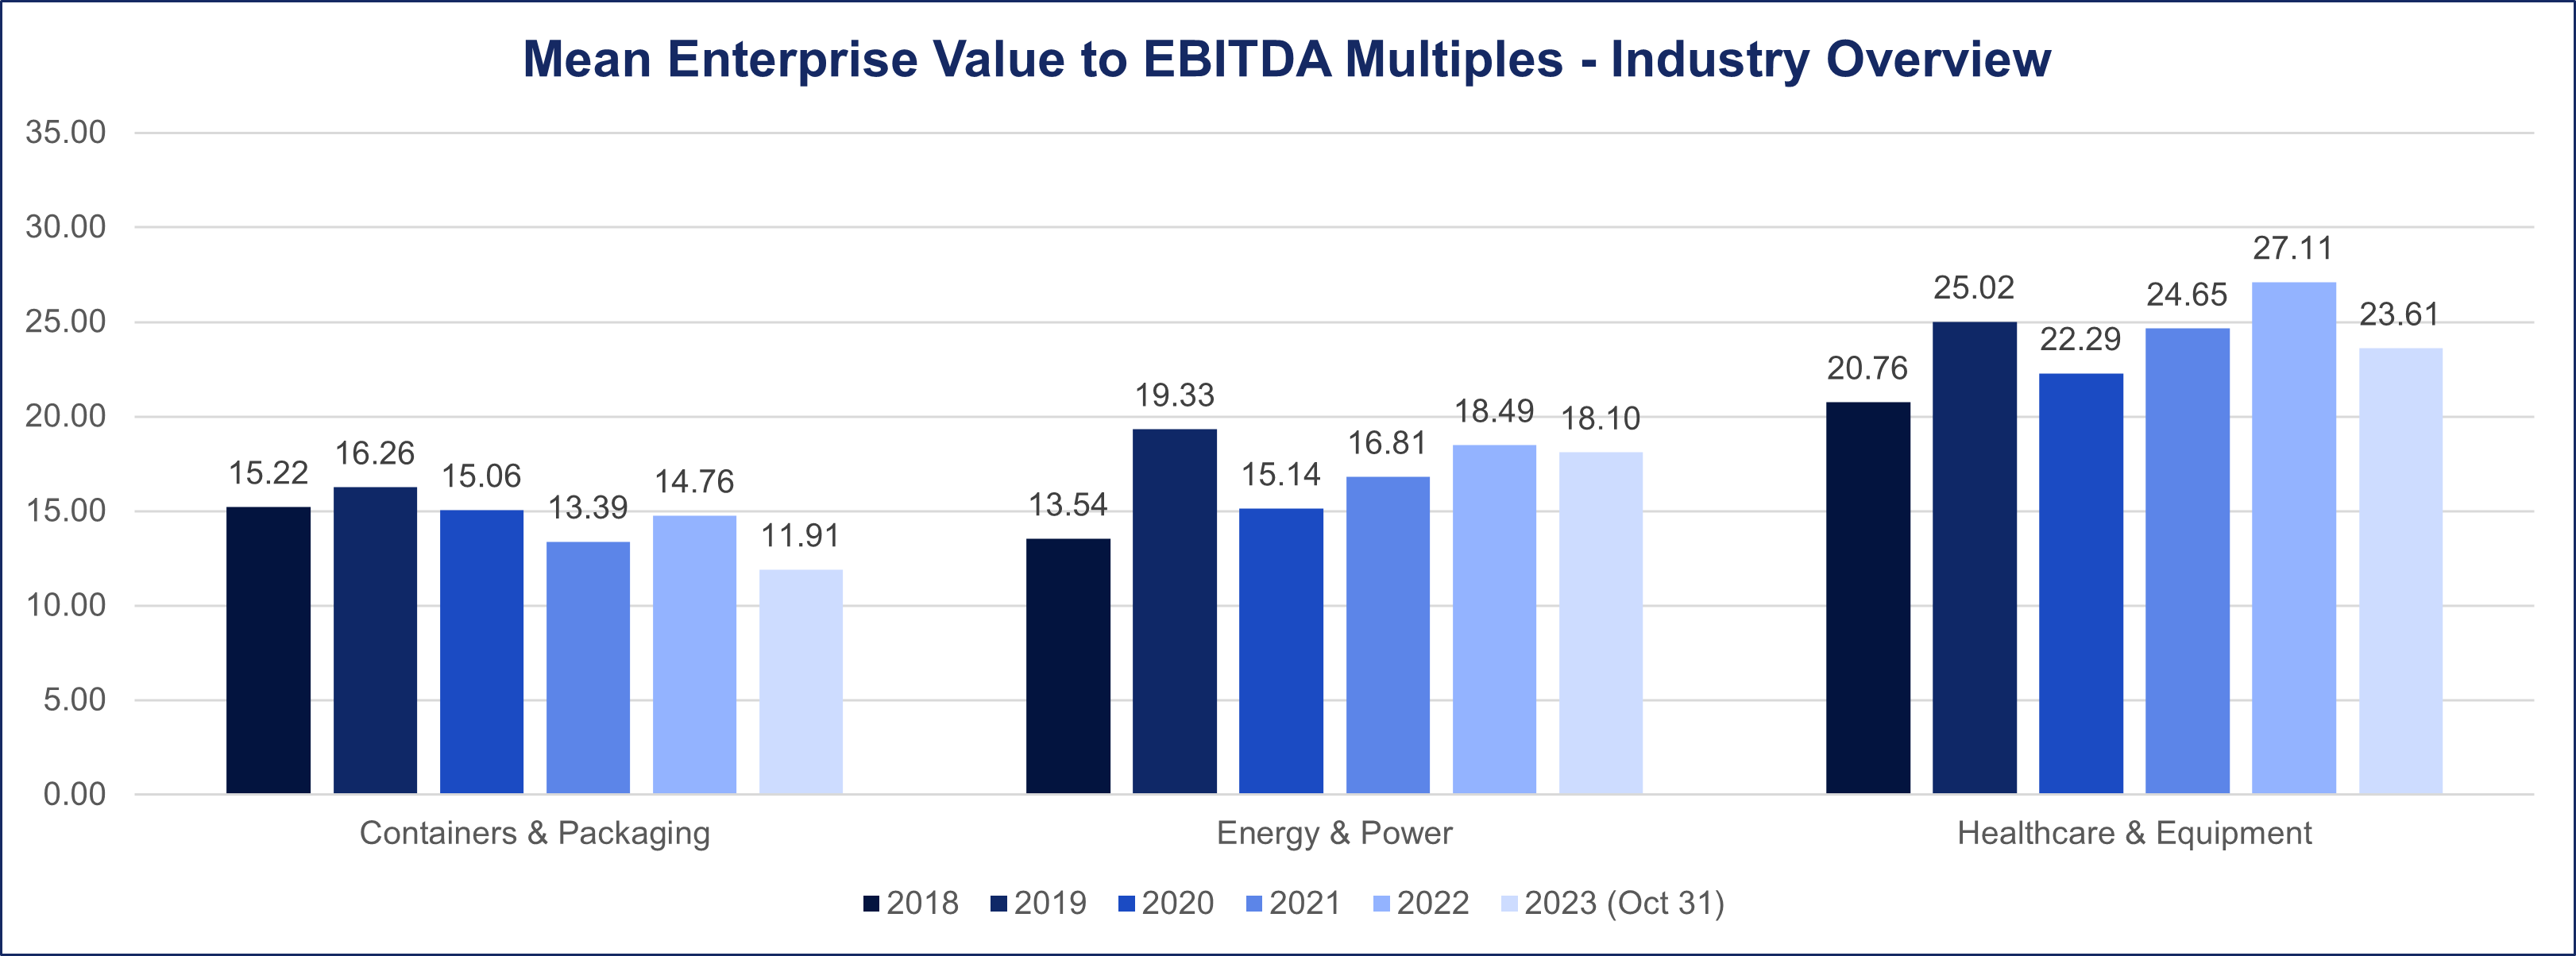
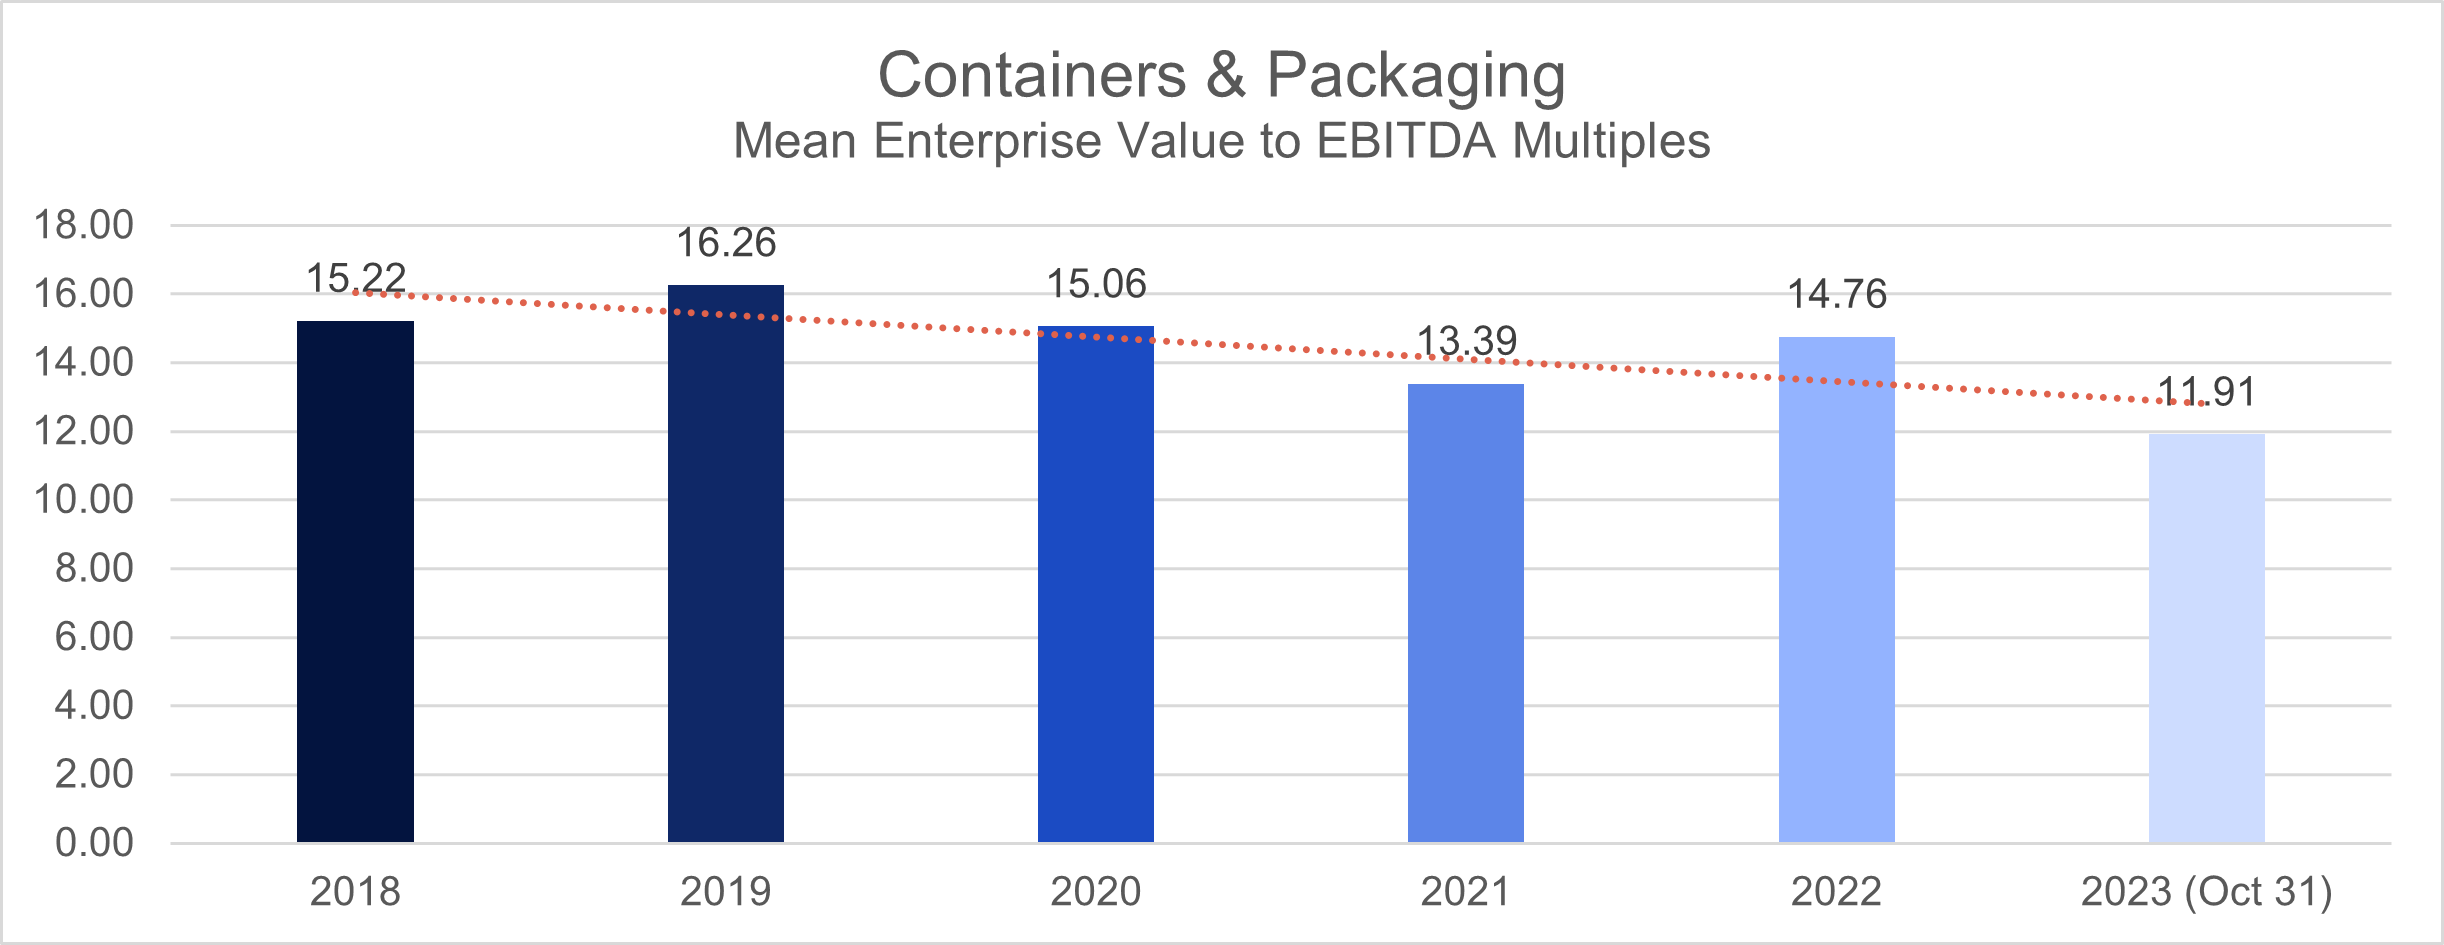
During the pre-pandemic years of 2018 and 2019, the Containers and Packaging sector have deal multiple averages of 15 and 16, respectively, based on the (EV/EBITDA) metric.
The onset of the pandemic triggered a pronounced decline in deal multiples within the industry, decreasing from 15 in 2020 to 13 in 2021.
Subsequently, the post-pandemic landscape in 2022 witnessed a rebound, evidenced by an increase in the deal multiple mean to 15. However, the period spanning January to October 2023 revealed a reversal in this positive trend, as the average deal multiple declined to 12.
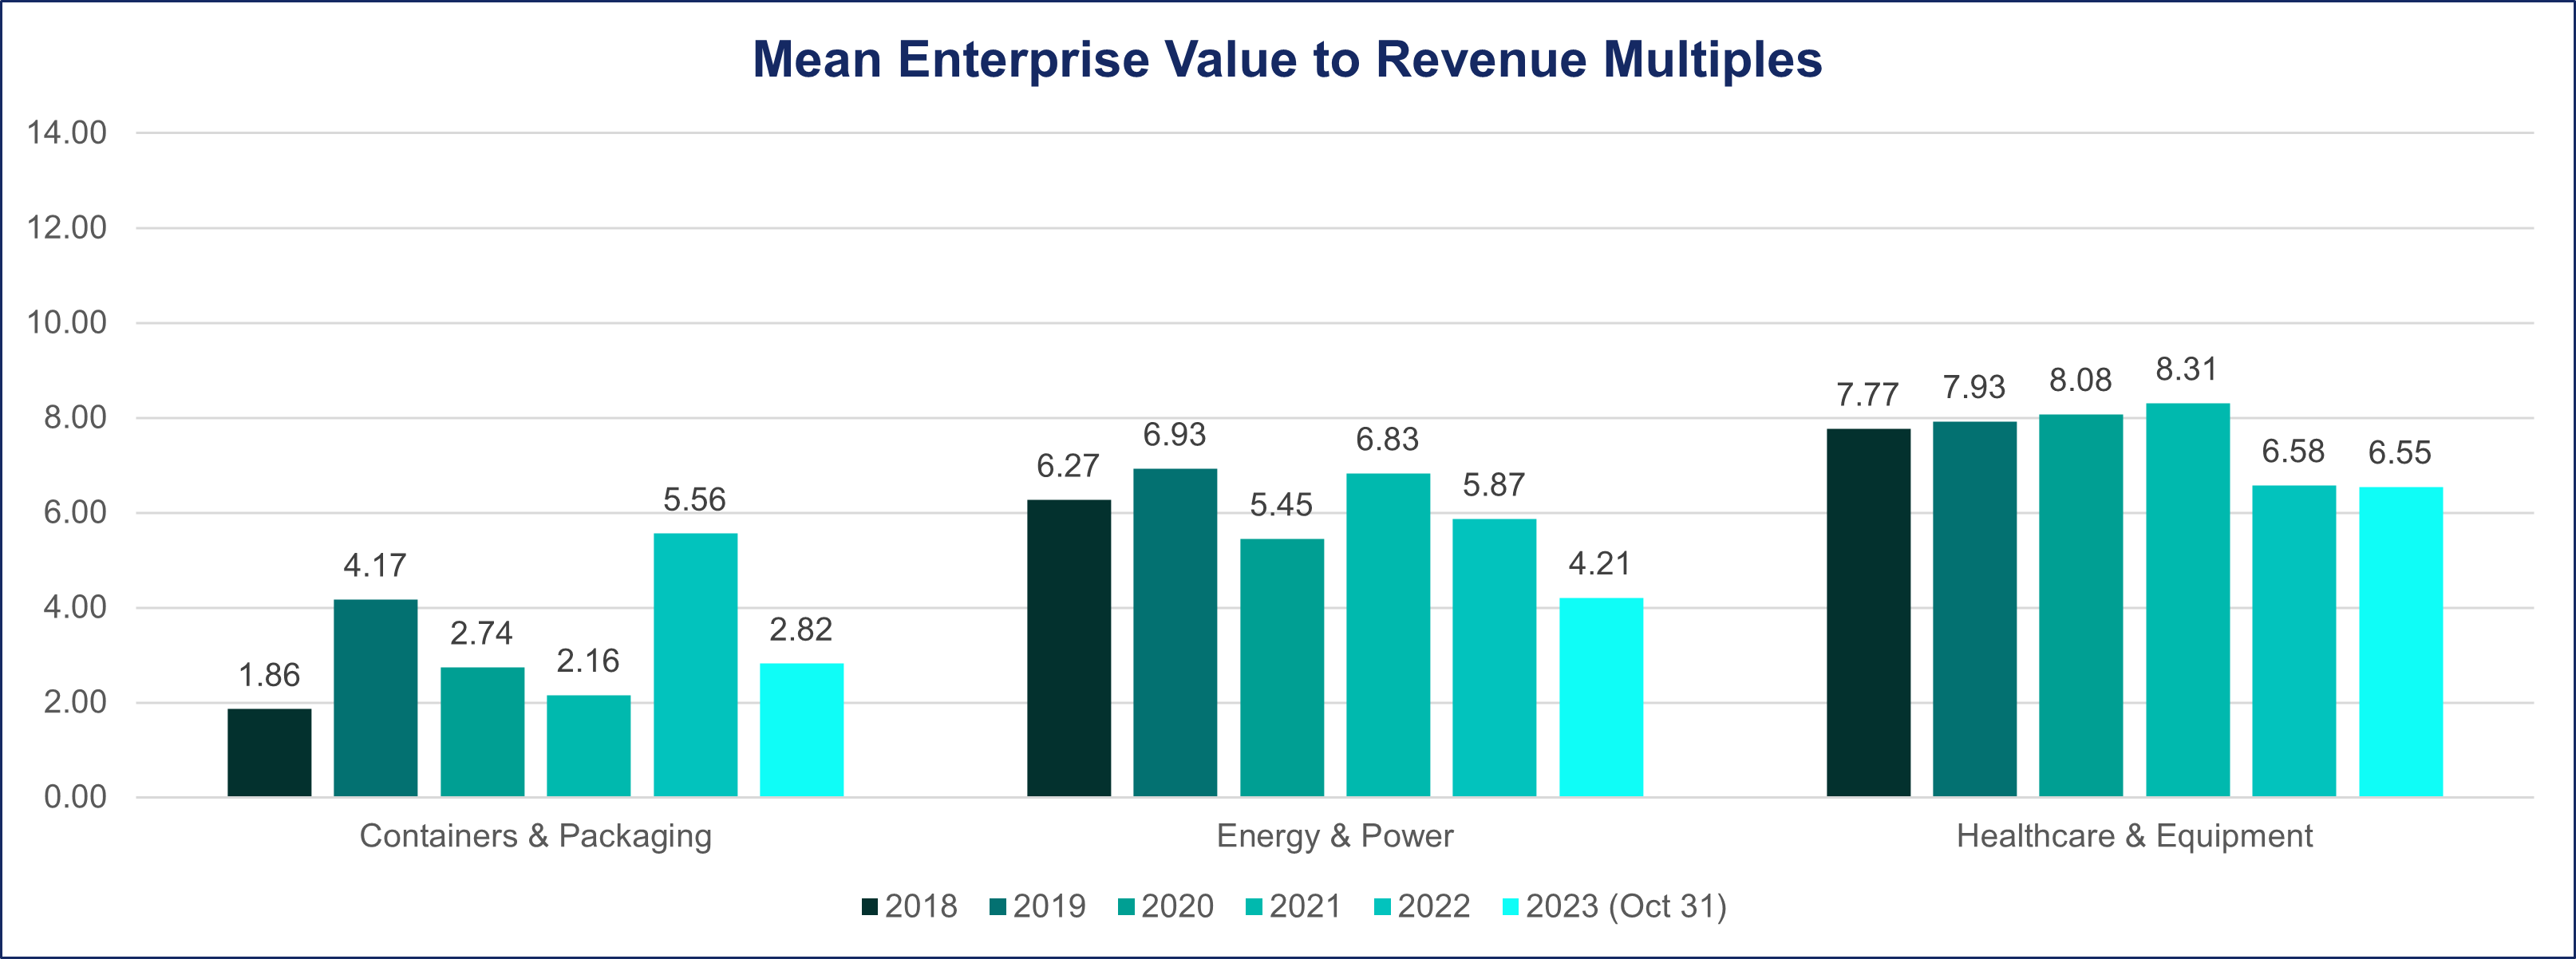
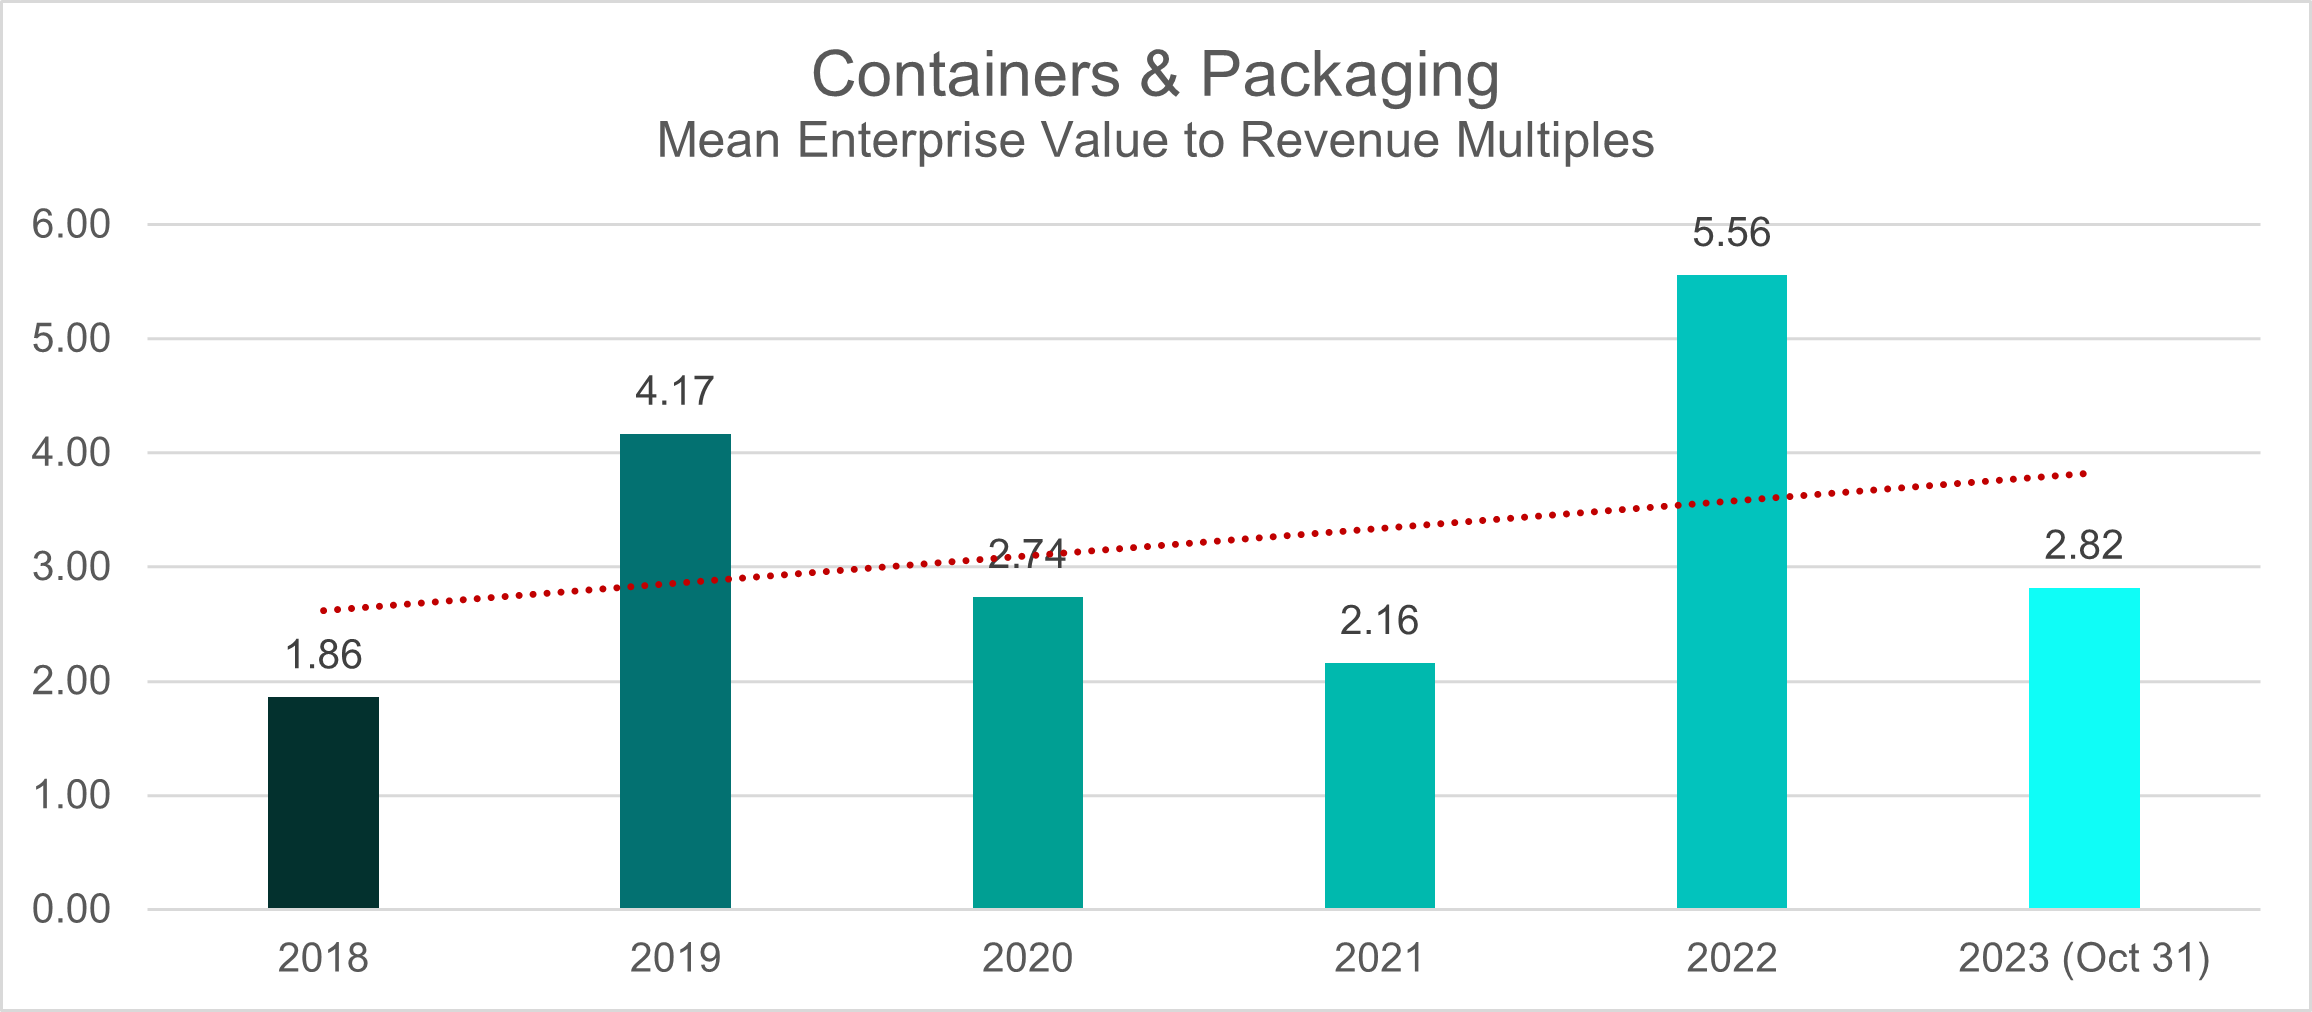
When employing the EV/Revenue metric, the average deal multiple exhibited a notable rise from 2 in 2018 to 4 in 2019. The pandemic era (2020-2021) marked a downturn, with deal multiples plummeting to 2. Post-pandemic recovery in 2022 showcased a rebound as the deal multiple mean reached 5.5; however, this resurgence appears to be transient. As of October 2023, the deal multiple average for the Containers & Packaging industry has settled at 2.8.
Energy & Power
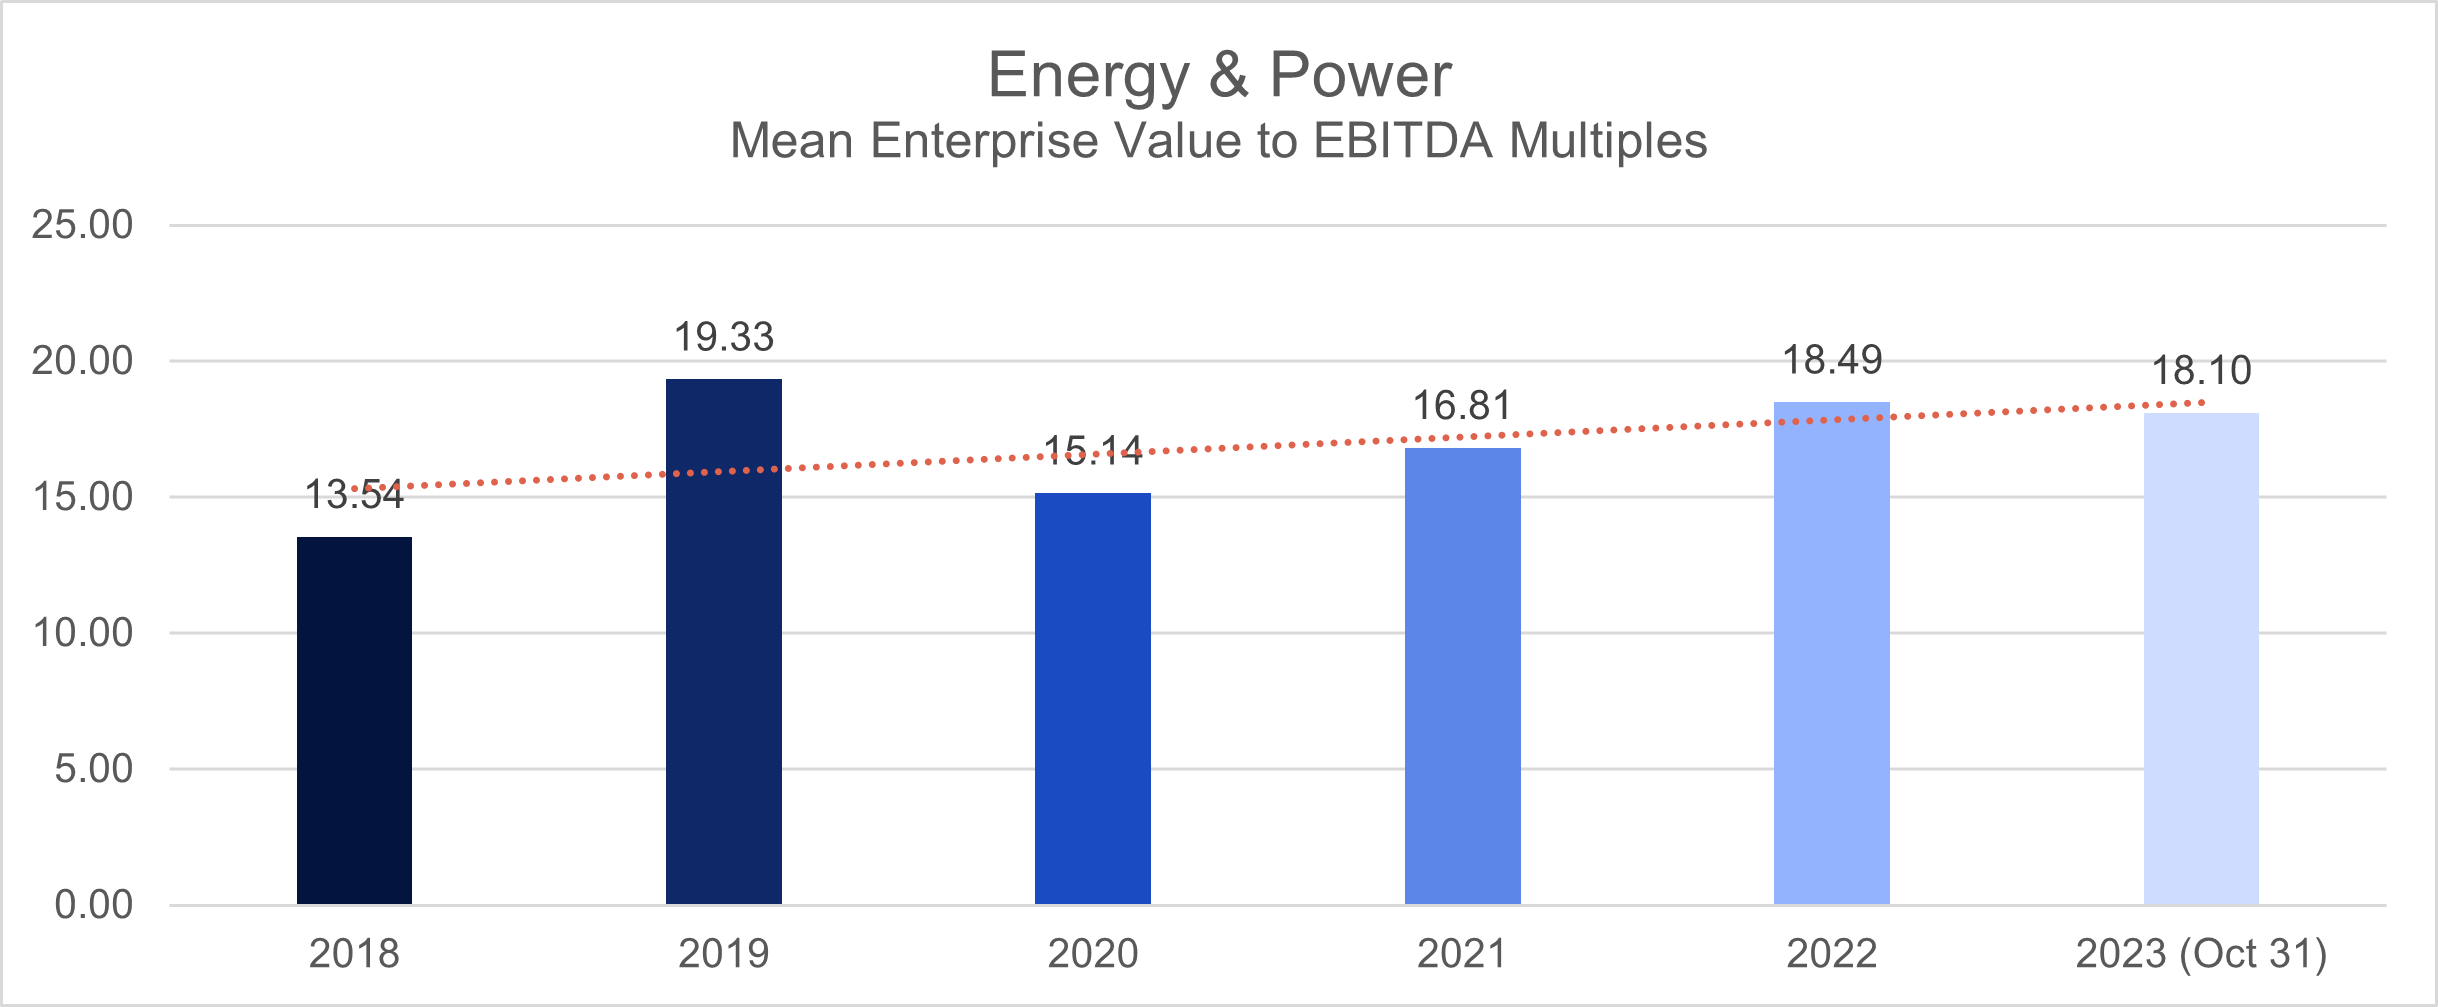
Between 2018 and 2019, the Energy & Power Industry witnessed a significant uptick in deal multiples, based on the (EV/EBITDA) ratio climbing from an average of 13.5 in 2018 to 19 in 2019.
The onset of the pandemic from 2020 to 2021 led to a moderate decline in deal multiples, settling at 15 and 17, respectively.
The post-pandemic recovery from 2022 to October 2023 brought about a distinct shift in the industry’s deal landscape, marked by a noticeable increase in deal multiples to 18.
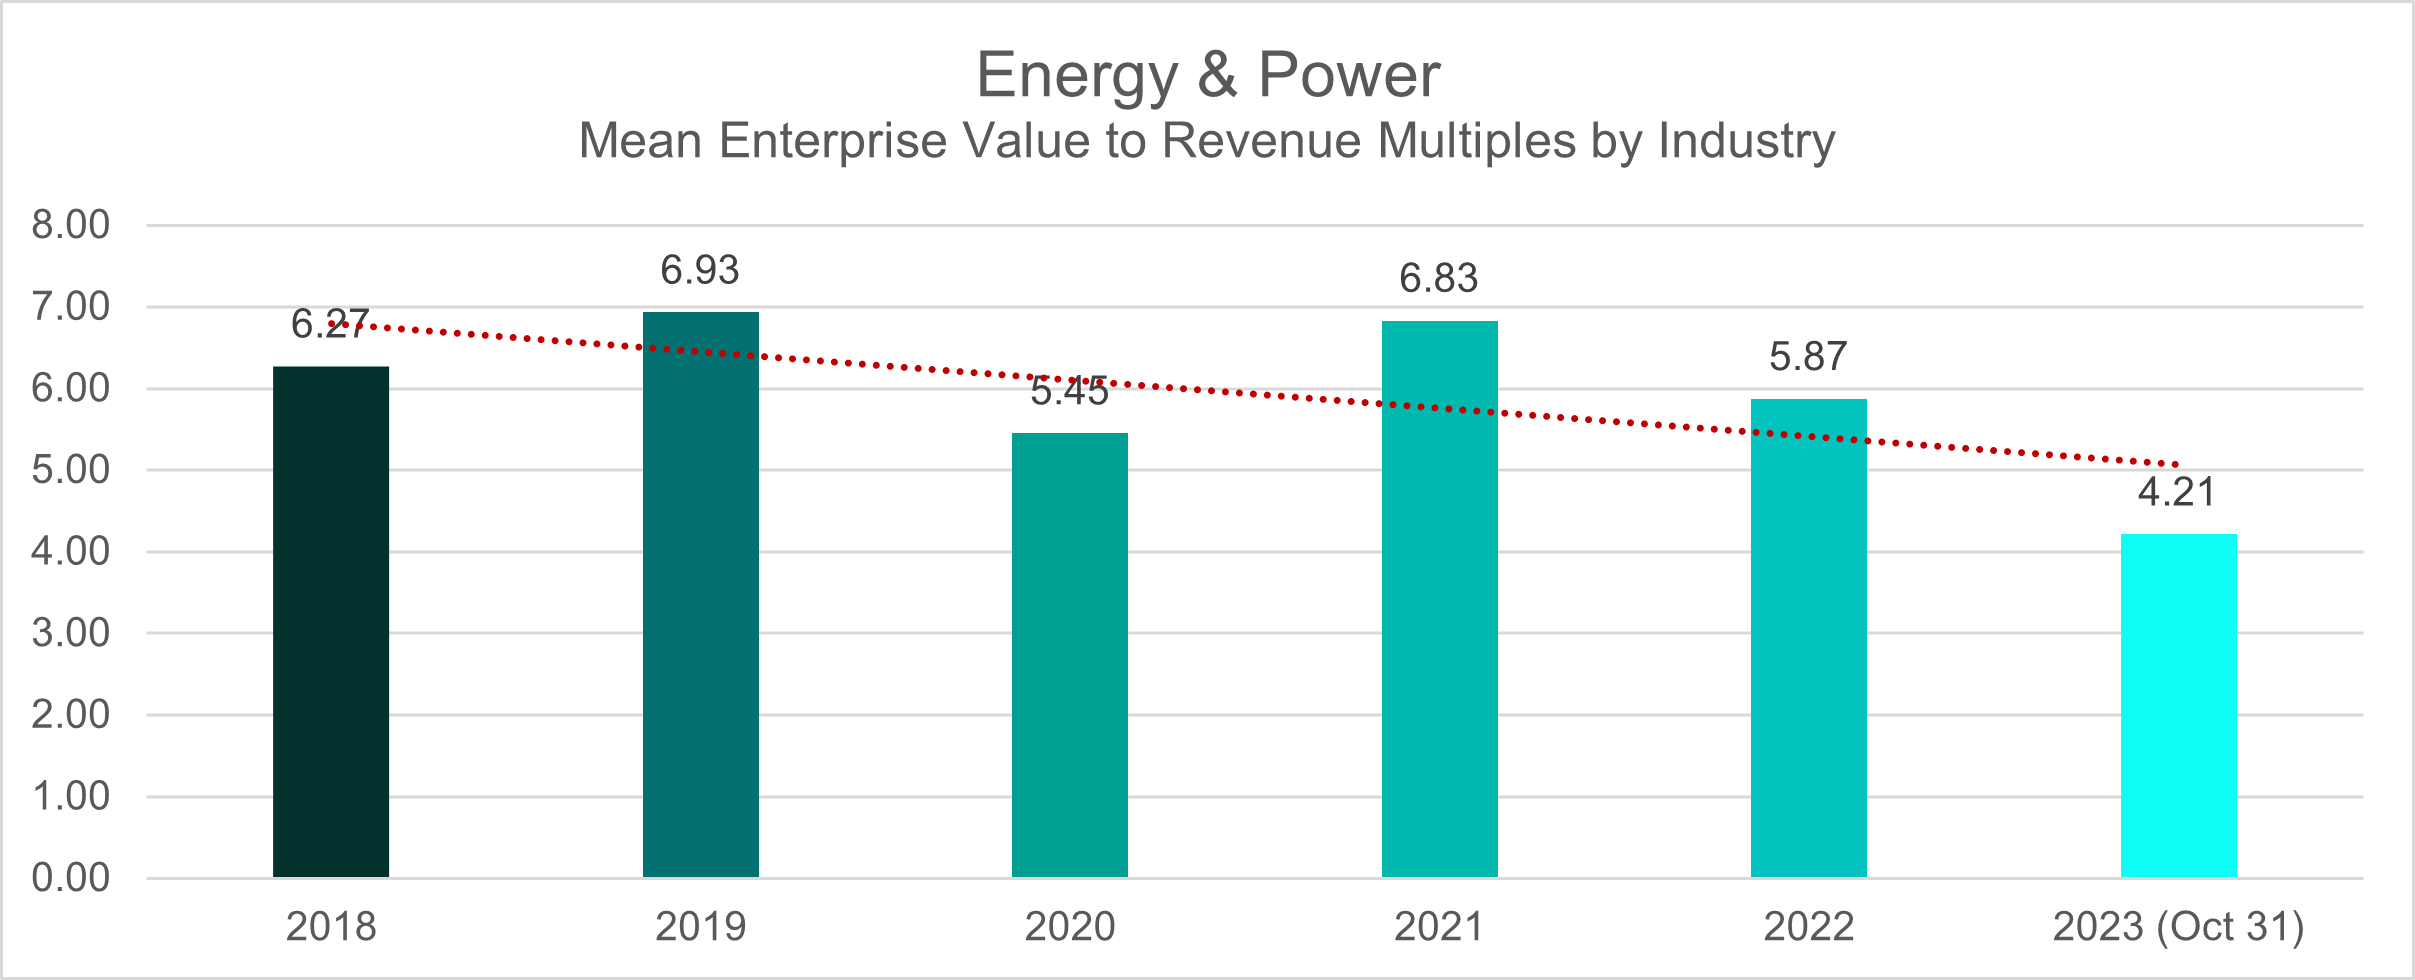
The EV/Revenue ratio within the Energy & Power sector demonstrated a deal multiple average ranging between 6-7 during the pre-pandemic years of 2018-2019. In 2020, amid the pandemic, this metric experienced a temporary drop to 5 but rebounded significantly the following year, achieving a notable 6.8. This resilience underscores the sector’s capacity to endure adverse conditions.
However, in the post-pandemic period, a consistent decline is observed, with deal multiple averages decreasing to 5.8 in 2022 and further to 4.2 as of October 2023. This indicates persistent challenges and evolving market dynamics within the Energy & Power sector, extending beyond the initial impact of the pandemic.
Healthcare & Equipment
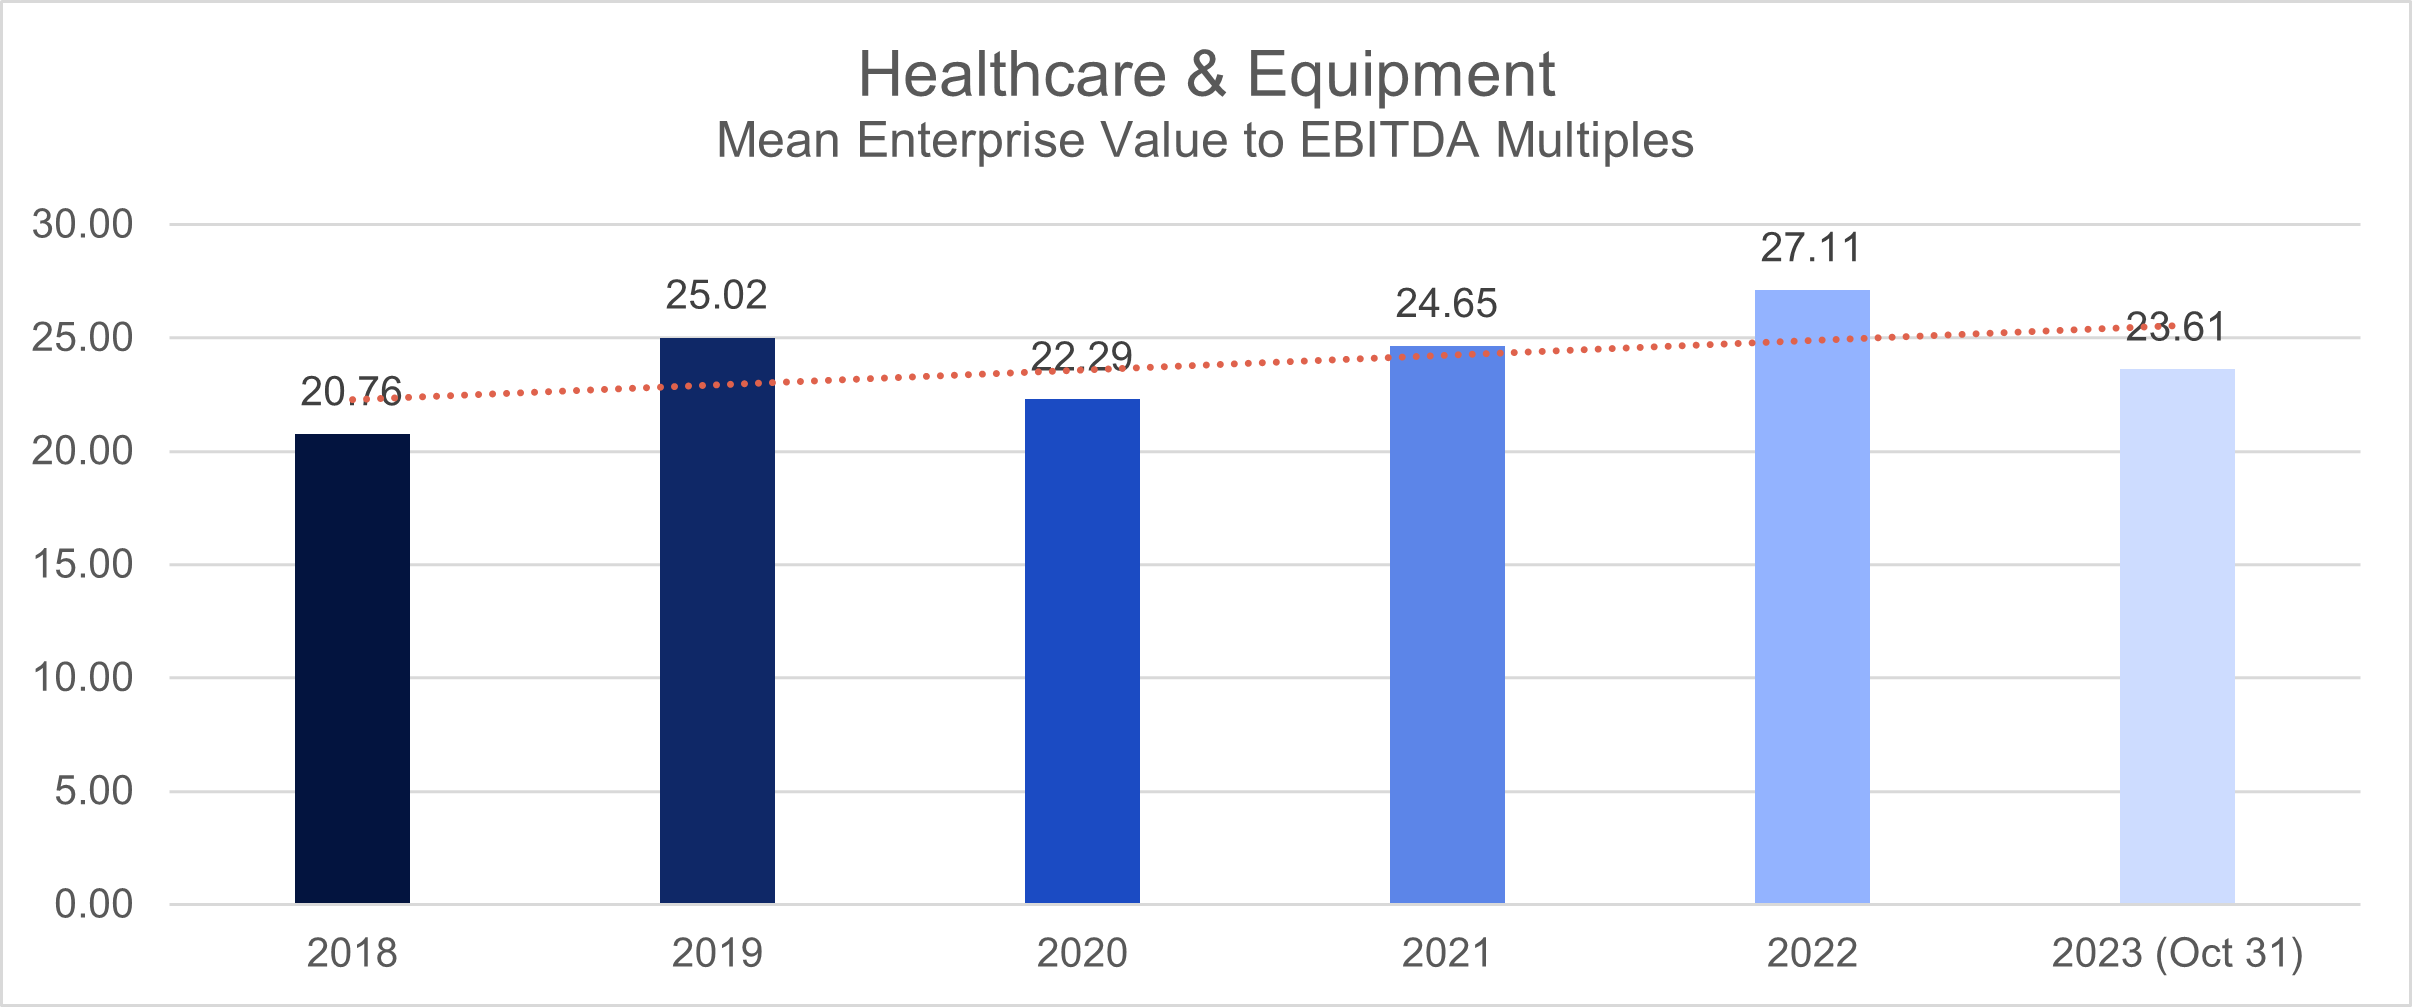
In 2018, the Healthcare Equipment & Supplies sector showcased a mean deal multiple of 21, which surged to 25 in 2019, as gauged by the Enterprise Value to EBITDA (EV/EBITDA) metric.
Throughout the pandemic spanning 2020 to 2021, the industry witnessed a decline in deal multiples, plummeting to 22 in 2021 but rebounding to 25 in 2021. This ratio has consistently hovered in the 20 range since the pre-pandemic era.
The positive trend in deal multiples persisted in the post-pandemic landscape, notably in 2022, when the metric rose to 27. As of October 2023, the Healthcare Equipment & Supplies sector maintains a stable average deal multiple of 24, suggesting continued resilience and growth in the industry.
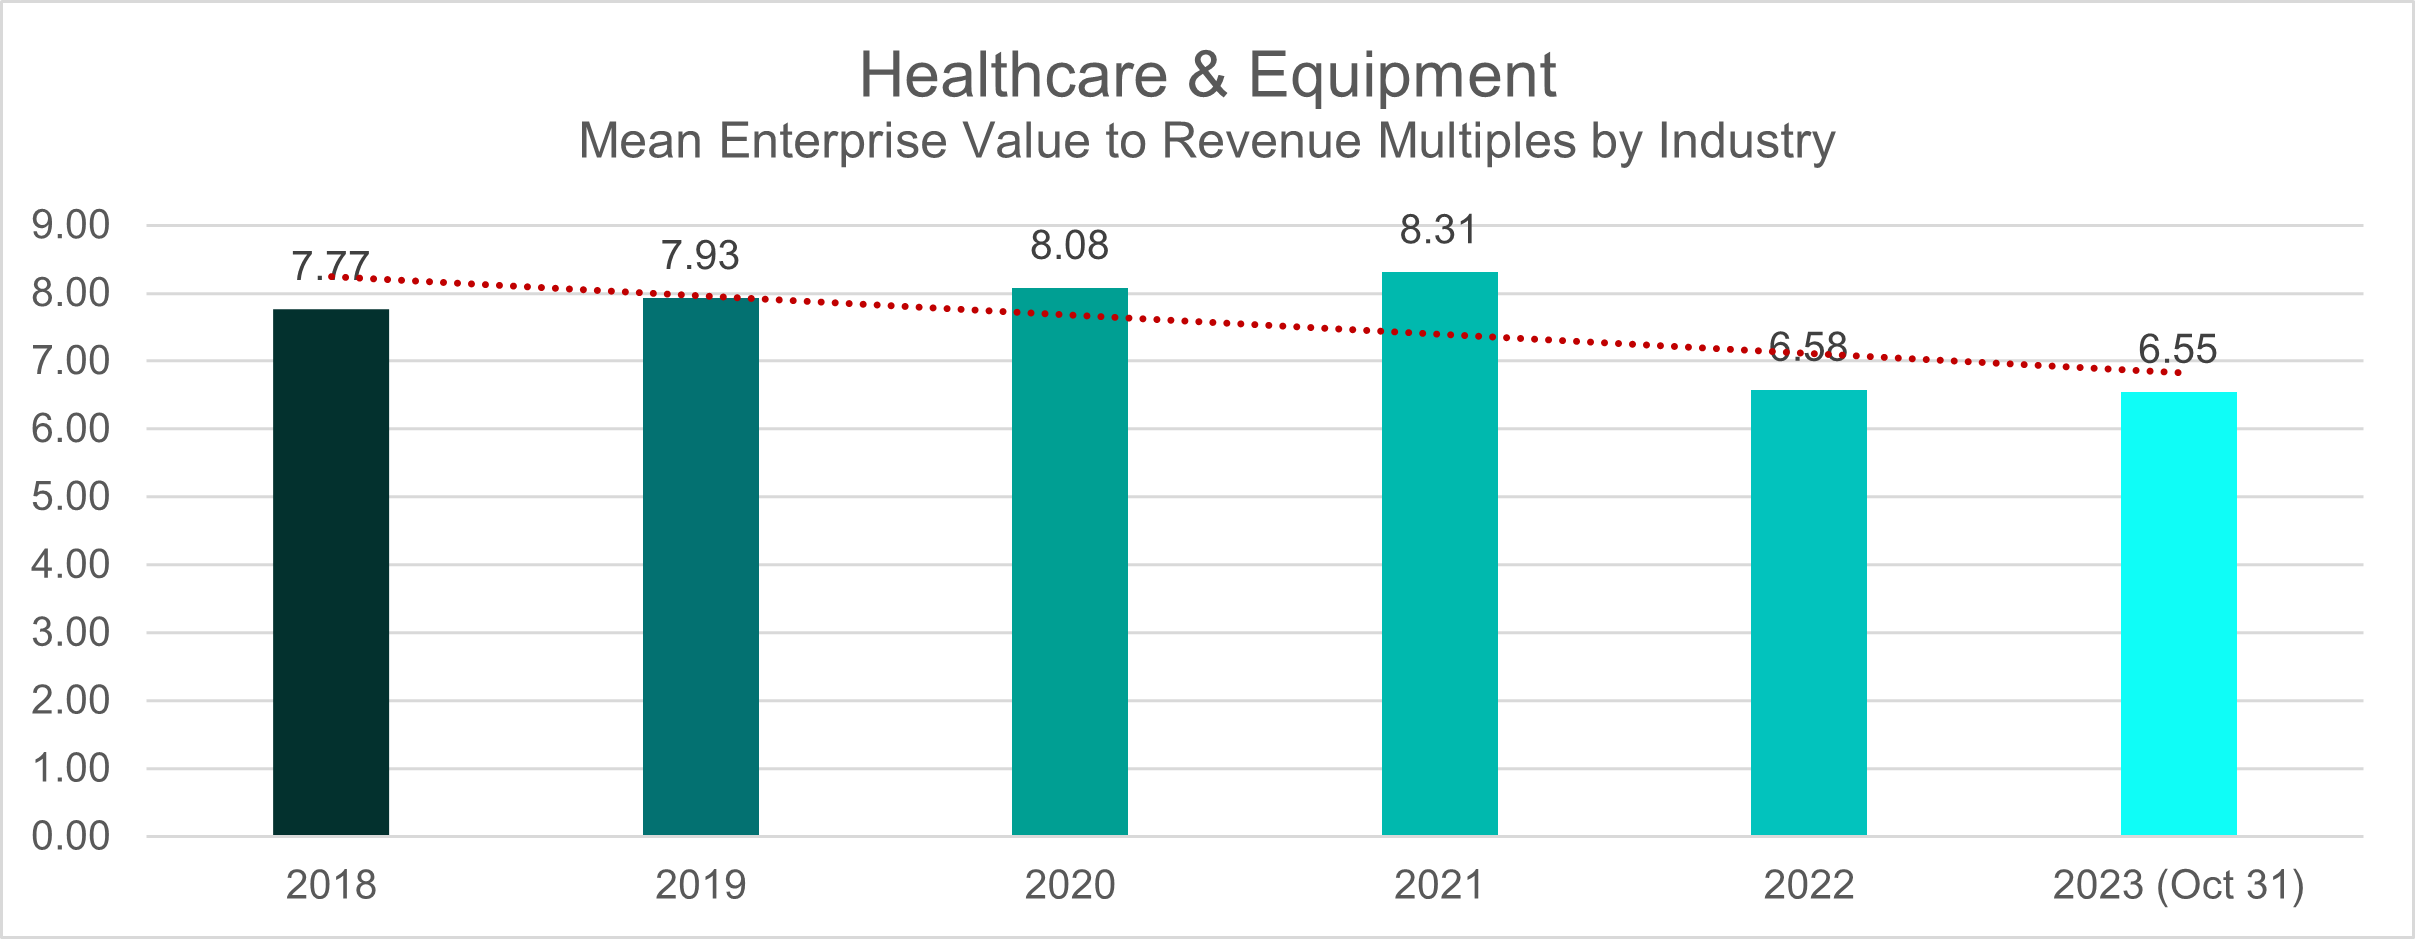
Analyzing the deal multiples using EV/Revenue ratio trend reveals noteworthy insights. In the pre-pandemic years (2018-2019), the average deal multiple consistently fluctuated within the range of 7.7 to 7.9, maintaining notable stability. This trend persisted through the pandemic years of 2020-2021, reaching a high of 8.3. However, a discernible shift occurred in the post-pandemic period (2020 to Oct 2023) as the average multiple declined to 6.5, signaling a noteworthy transformation in market dynamics.
Insurances
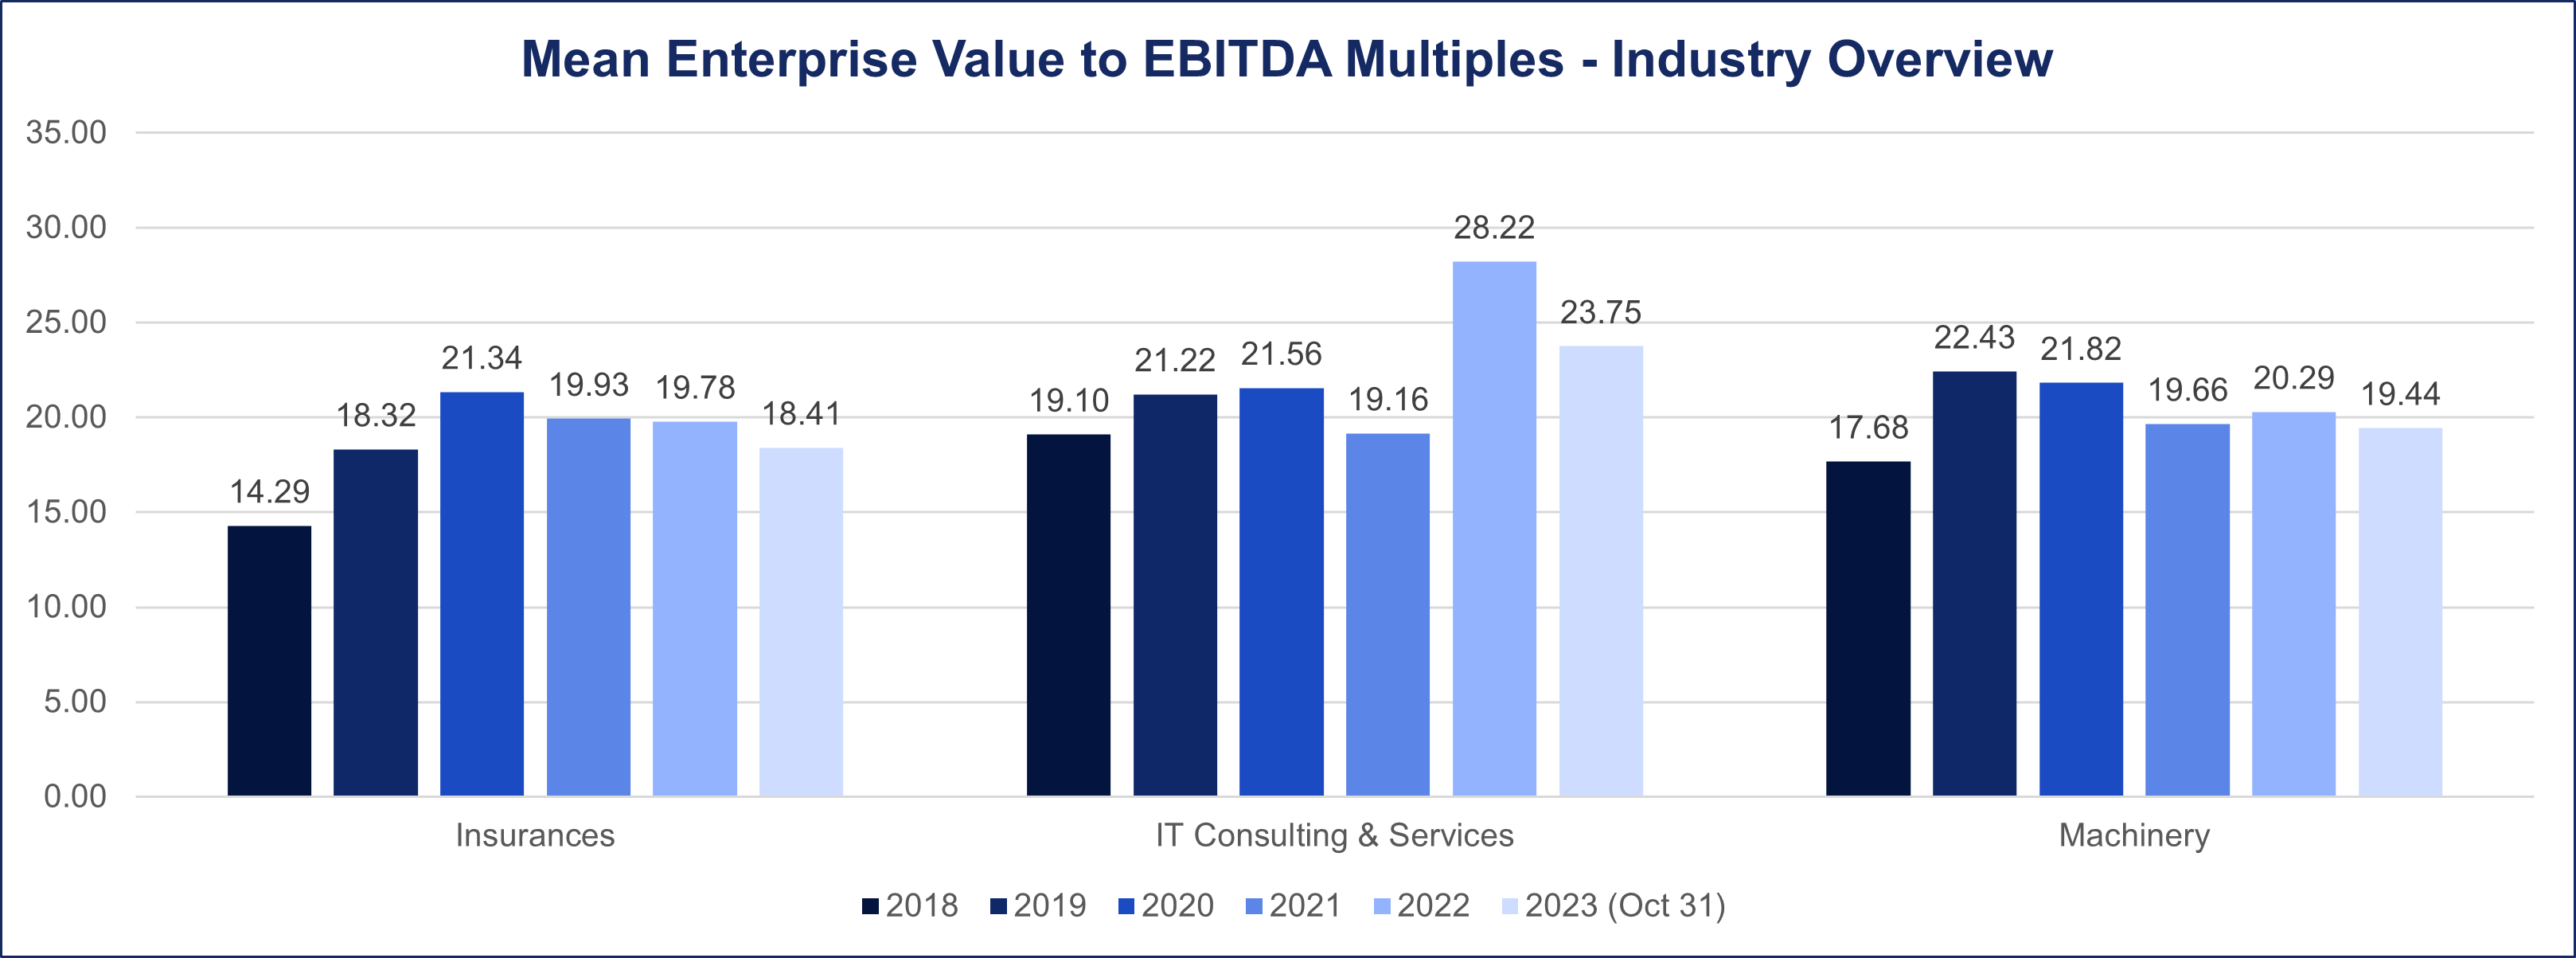
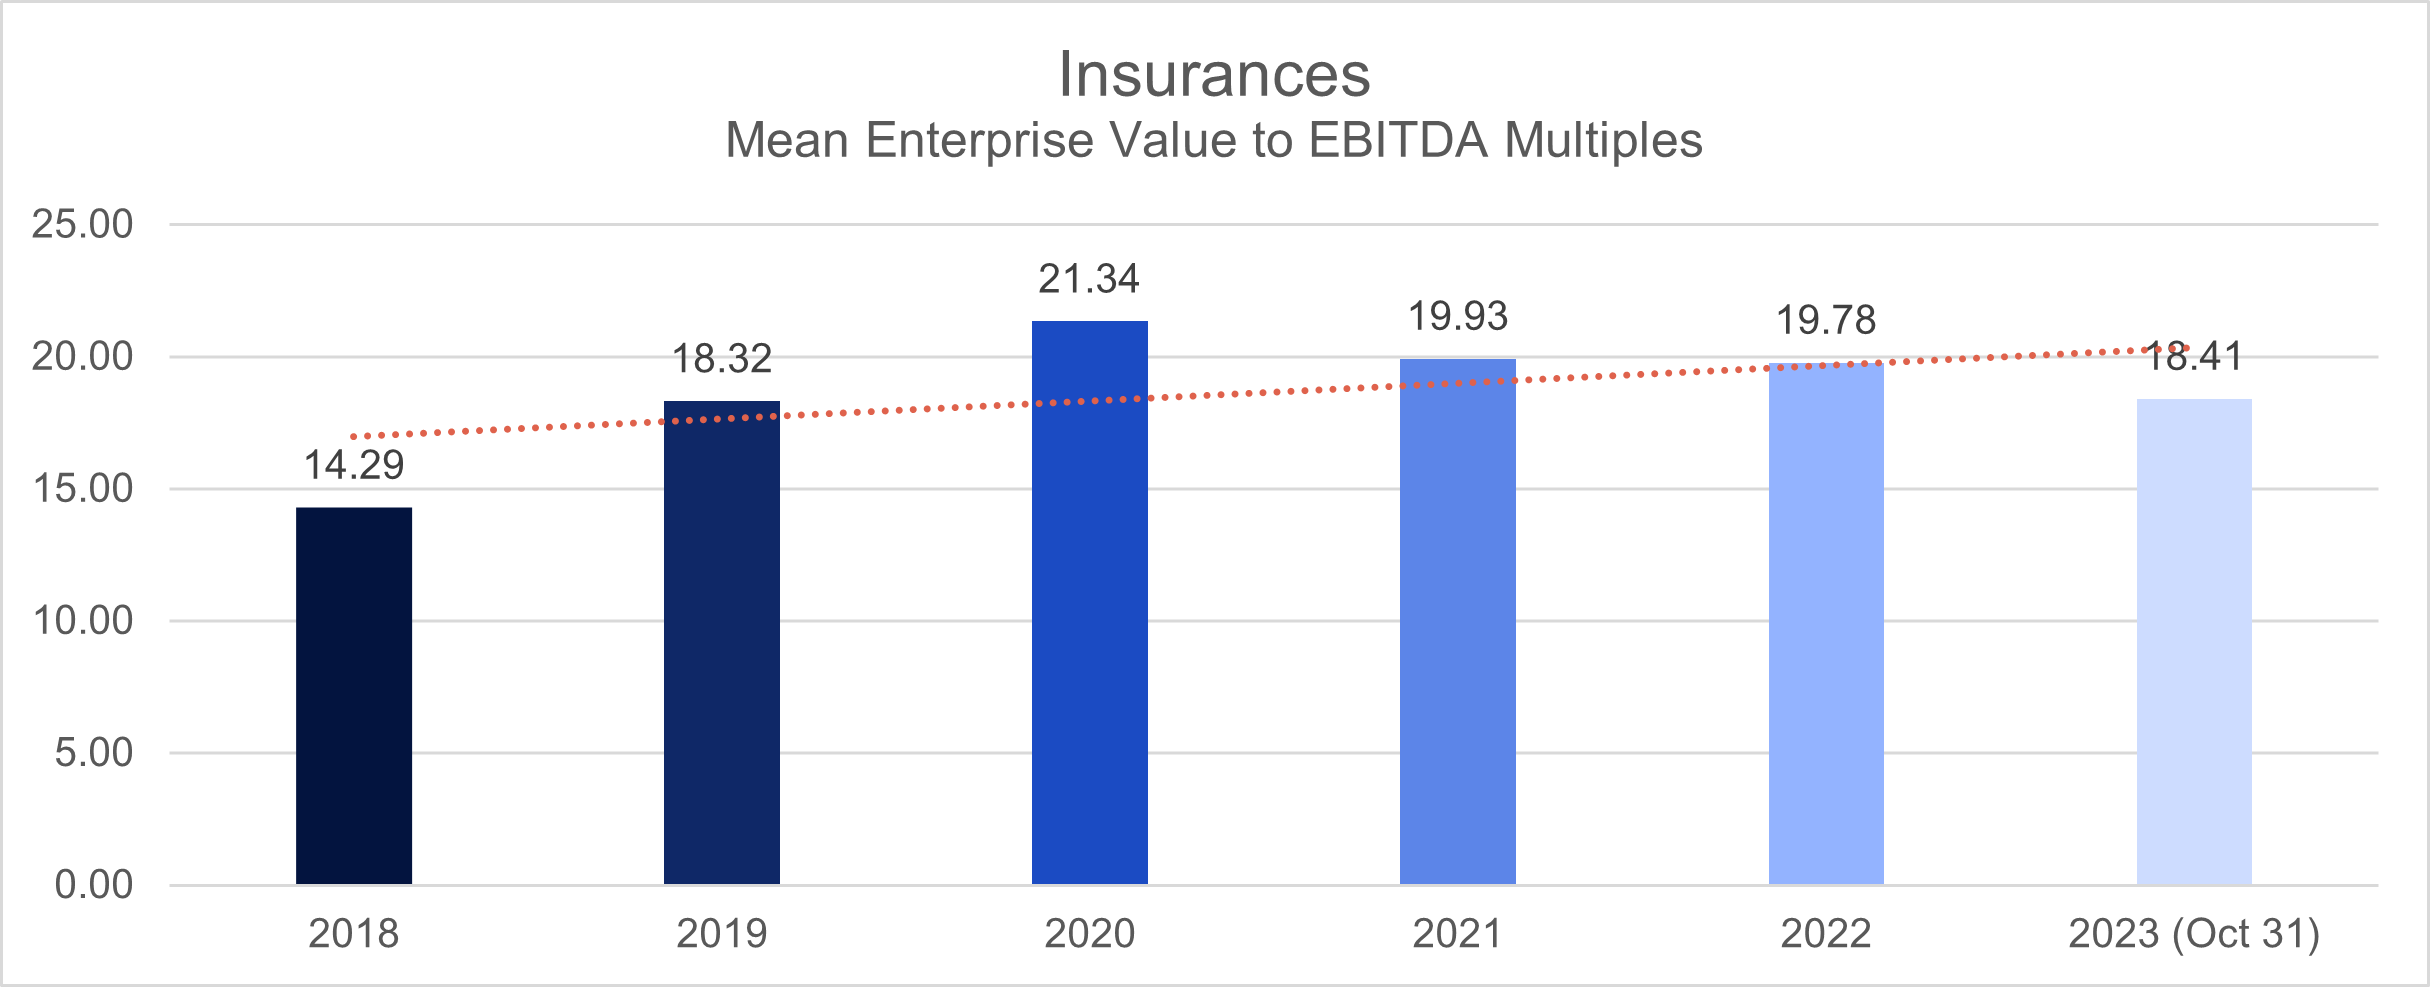
Between 2018 and 2019, the Insurance Industry maintained an average deal multiple ranging from 14 to 18, revealing an ascending trajectory as assessed through the Enterprise Value to EBITDA (EV to EBITDA) metric.
The advent of the pandemic marked a significant departure from this trend. In 2020, the industry experienced a notable surge in the mean deal multiple, peaking at 21, only to marginally decrease to 19.9 in 2021.
In the post-pandemic landscape, specifically in 2022, the deal multiple average for the Insurance sector held steady at 19.8. However, by October 2023, the recorded deal multiple for the industry had slightly receded to 18.4.
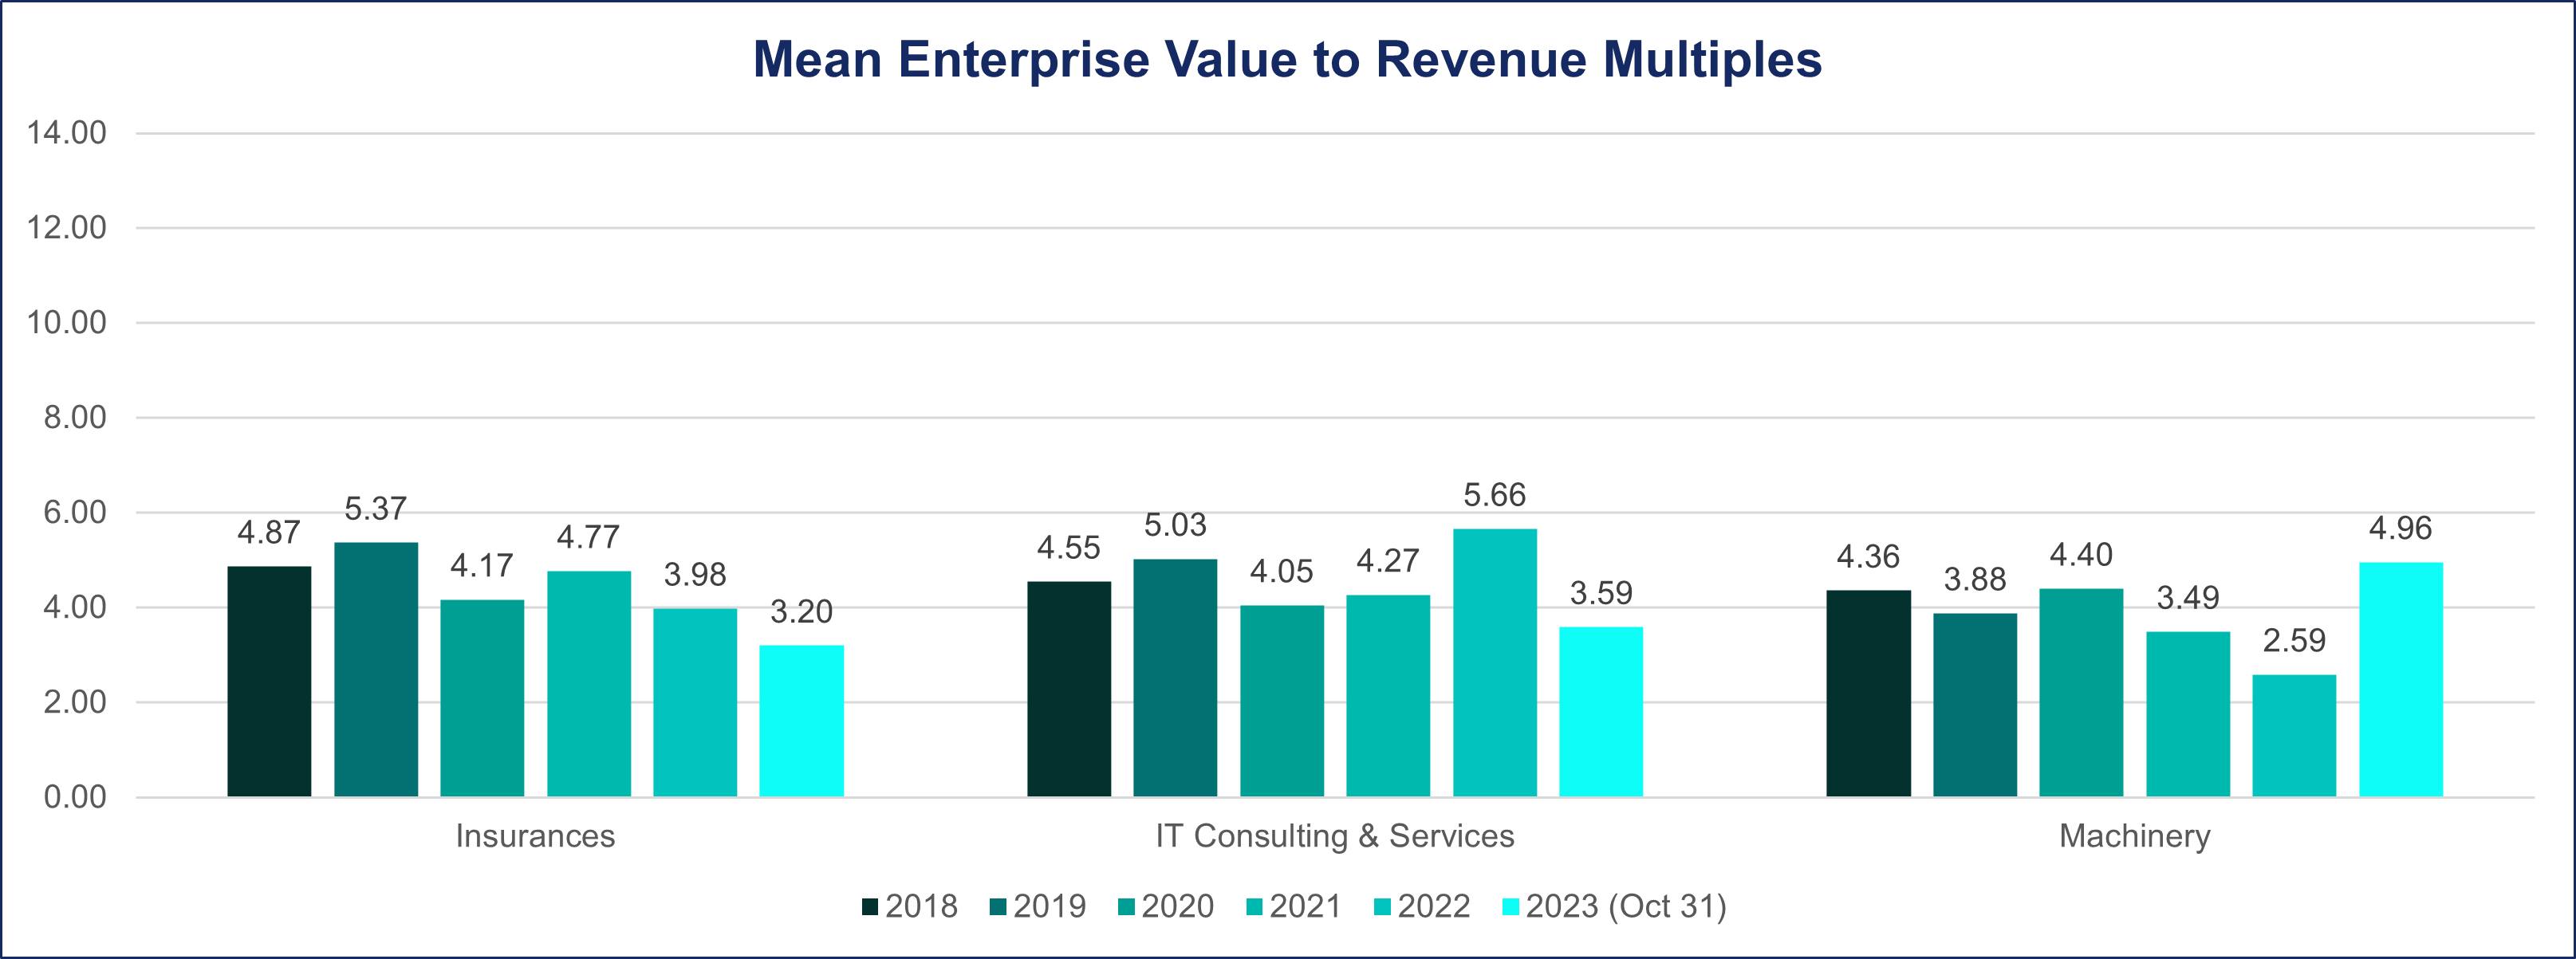
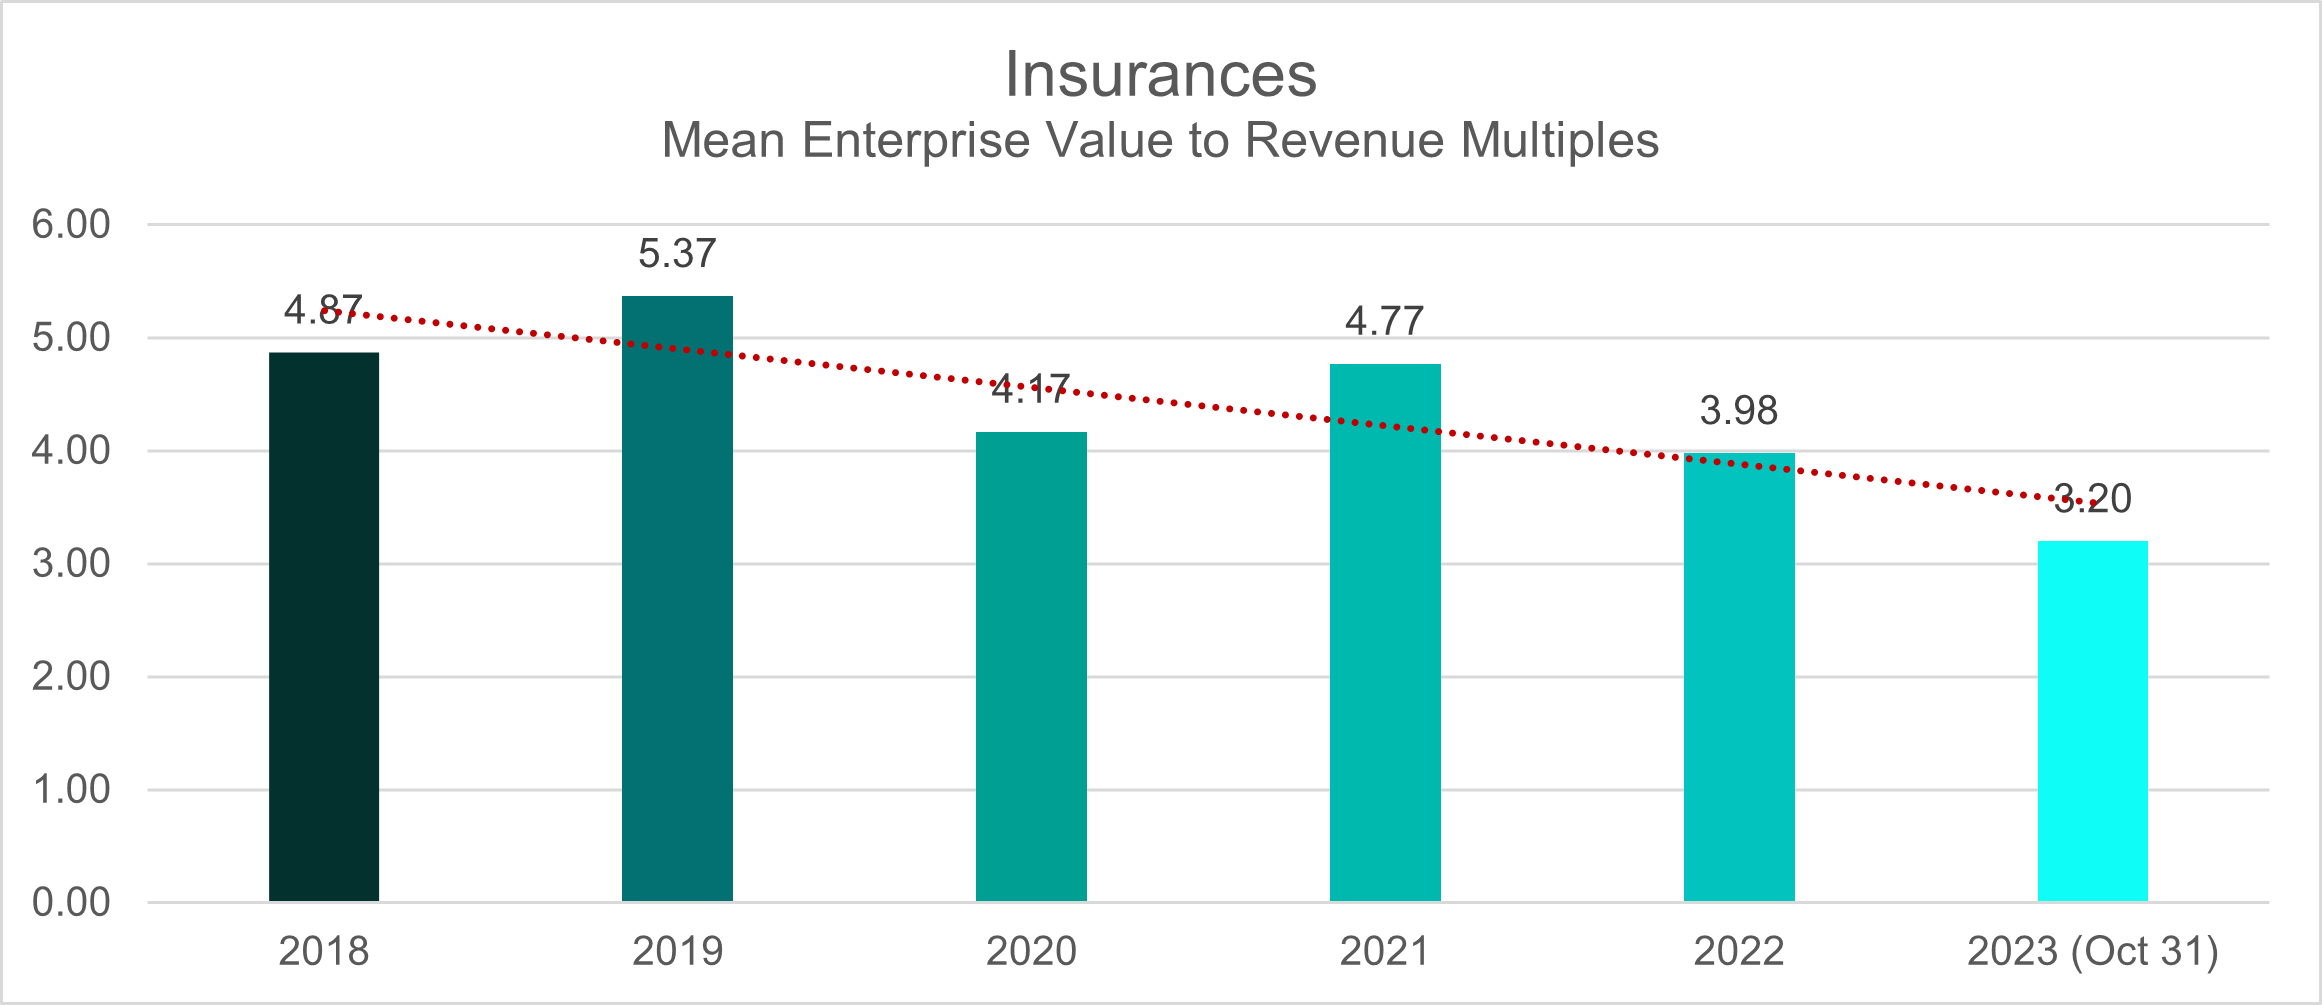
An analysis of the deal multiples average trend utilizing the EV/Revenue ratio reveals that in the pre-pandemic years of 2018-2019, the deal multiples were 4.9 and 5.4, respectively.
Subsequently, during the tumultuous period of 2020-2021, they maintained a range of 4.2-4.8. Nevertheless, a discernible decline ensued in the post-pandemic phase, culminating in a deal multiple average of 3.2 as of October 2023.
IT Consulting & Services
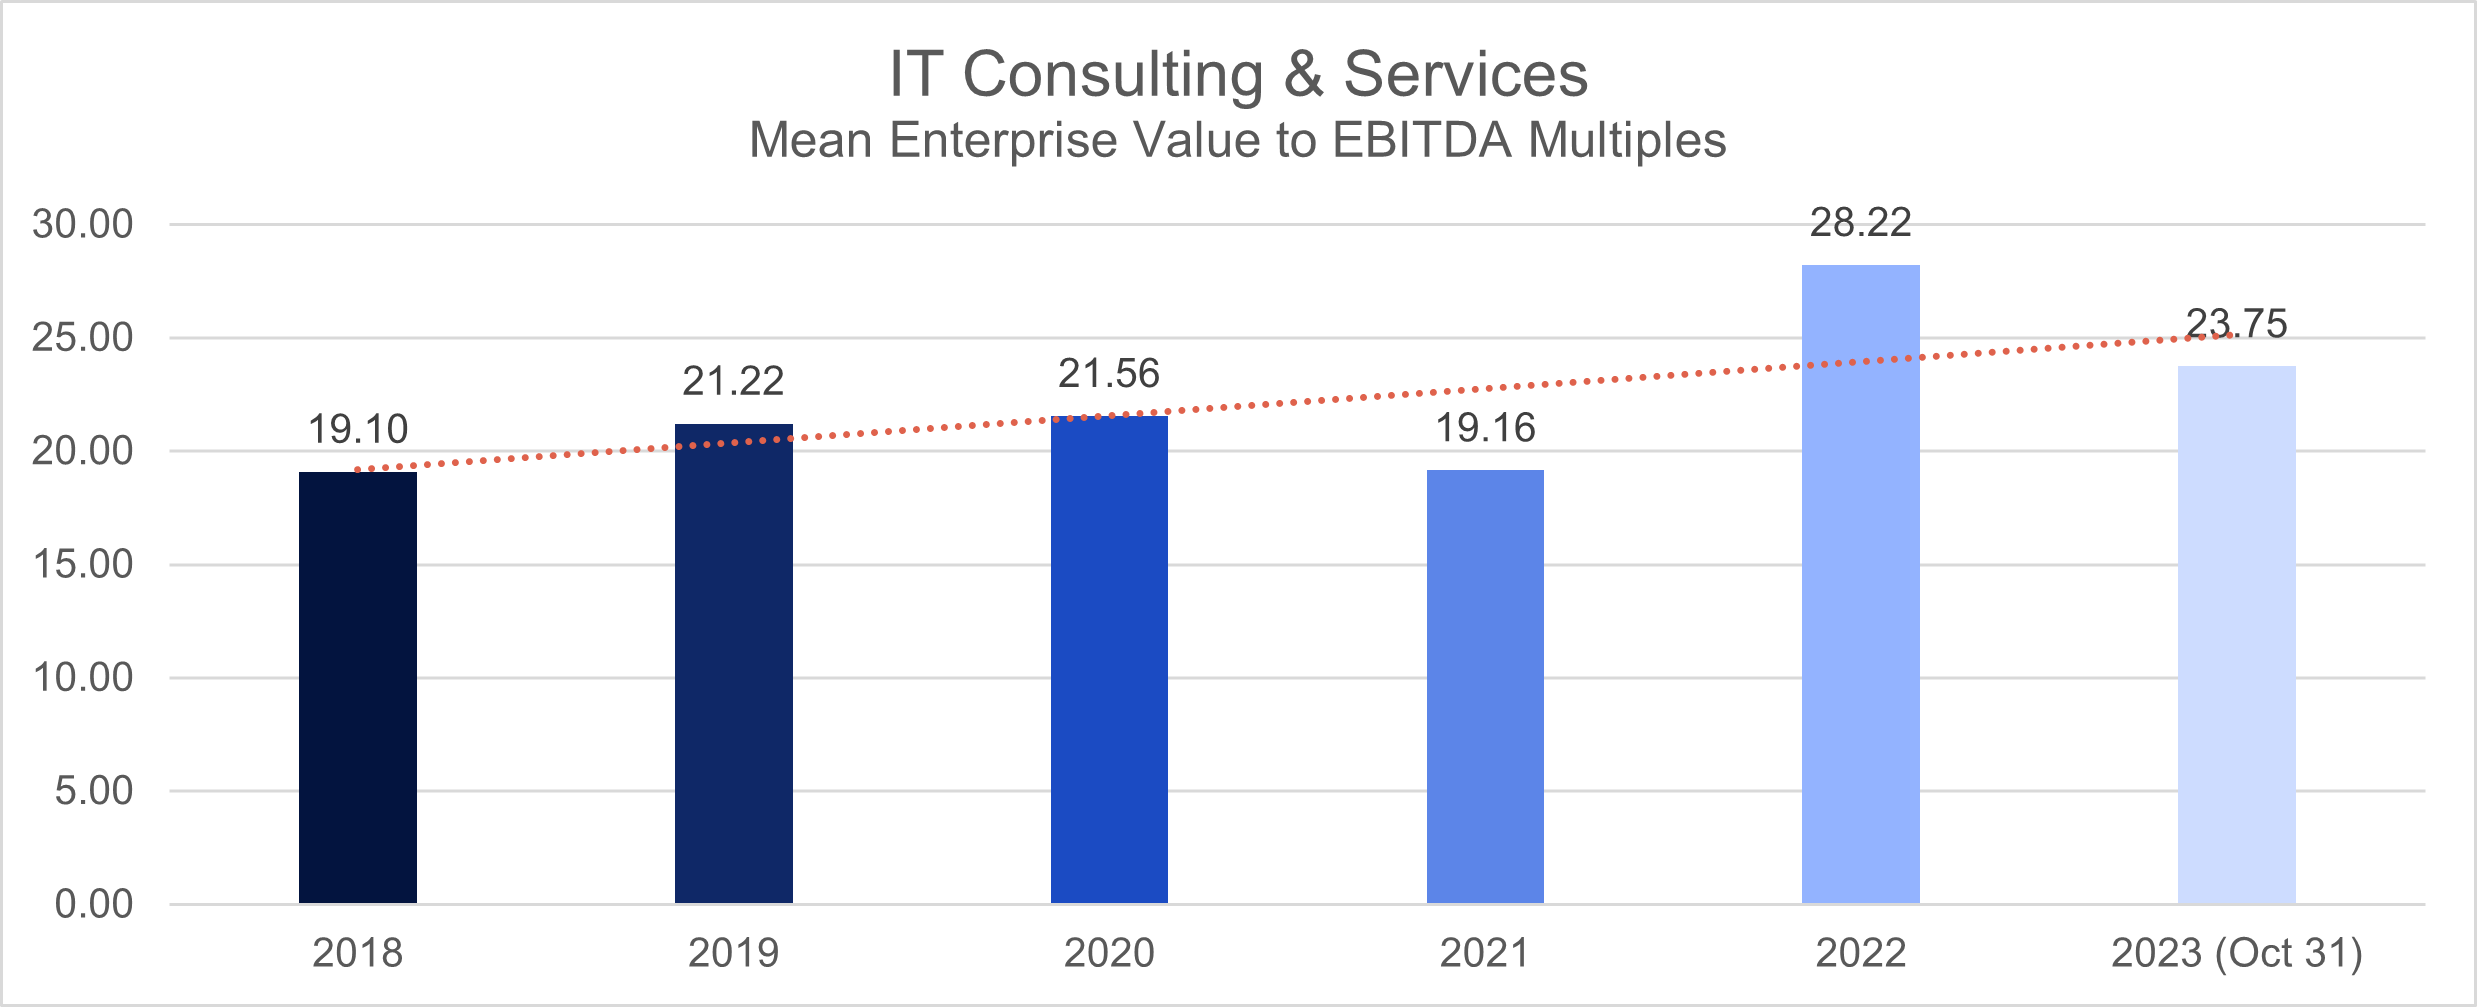
In the years prior to the pandemic, specifically in 2018 and 2019, the IT Consulting & Services Industry exhibited mean deal multiples of 19 and 21.2, respectively, determined by the (EV/EBITDA) ratio.
However, during the pandemic, spanning from 2020 to 2021, there was a reversal in this trend, with the sector’s deal multiple average dropping from 21.5 to 19.
In a noteworthy shift, 2022 saw a resurgence as the deal multiples average for the IT Consulting and Services sector increased to 28. Nevertheless, as of October 2023, there was a slight moderation, with deal multiples settling at 24.
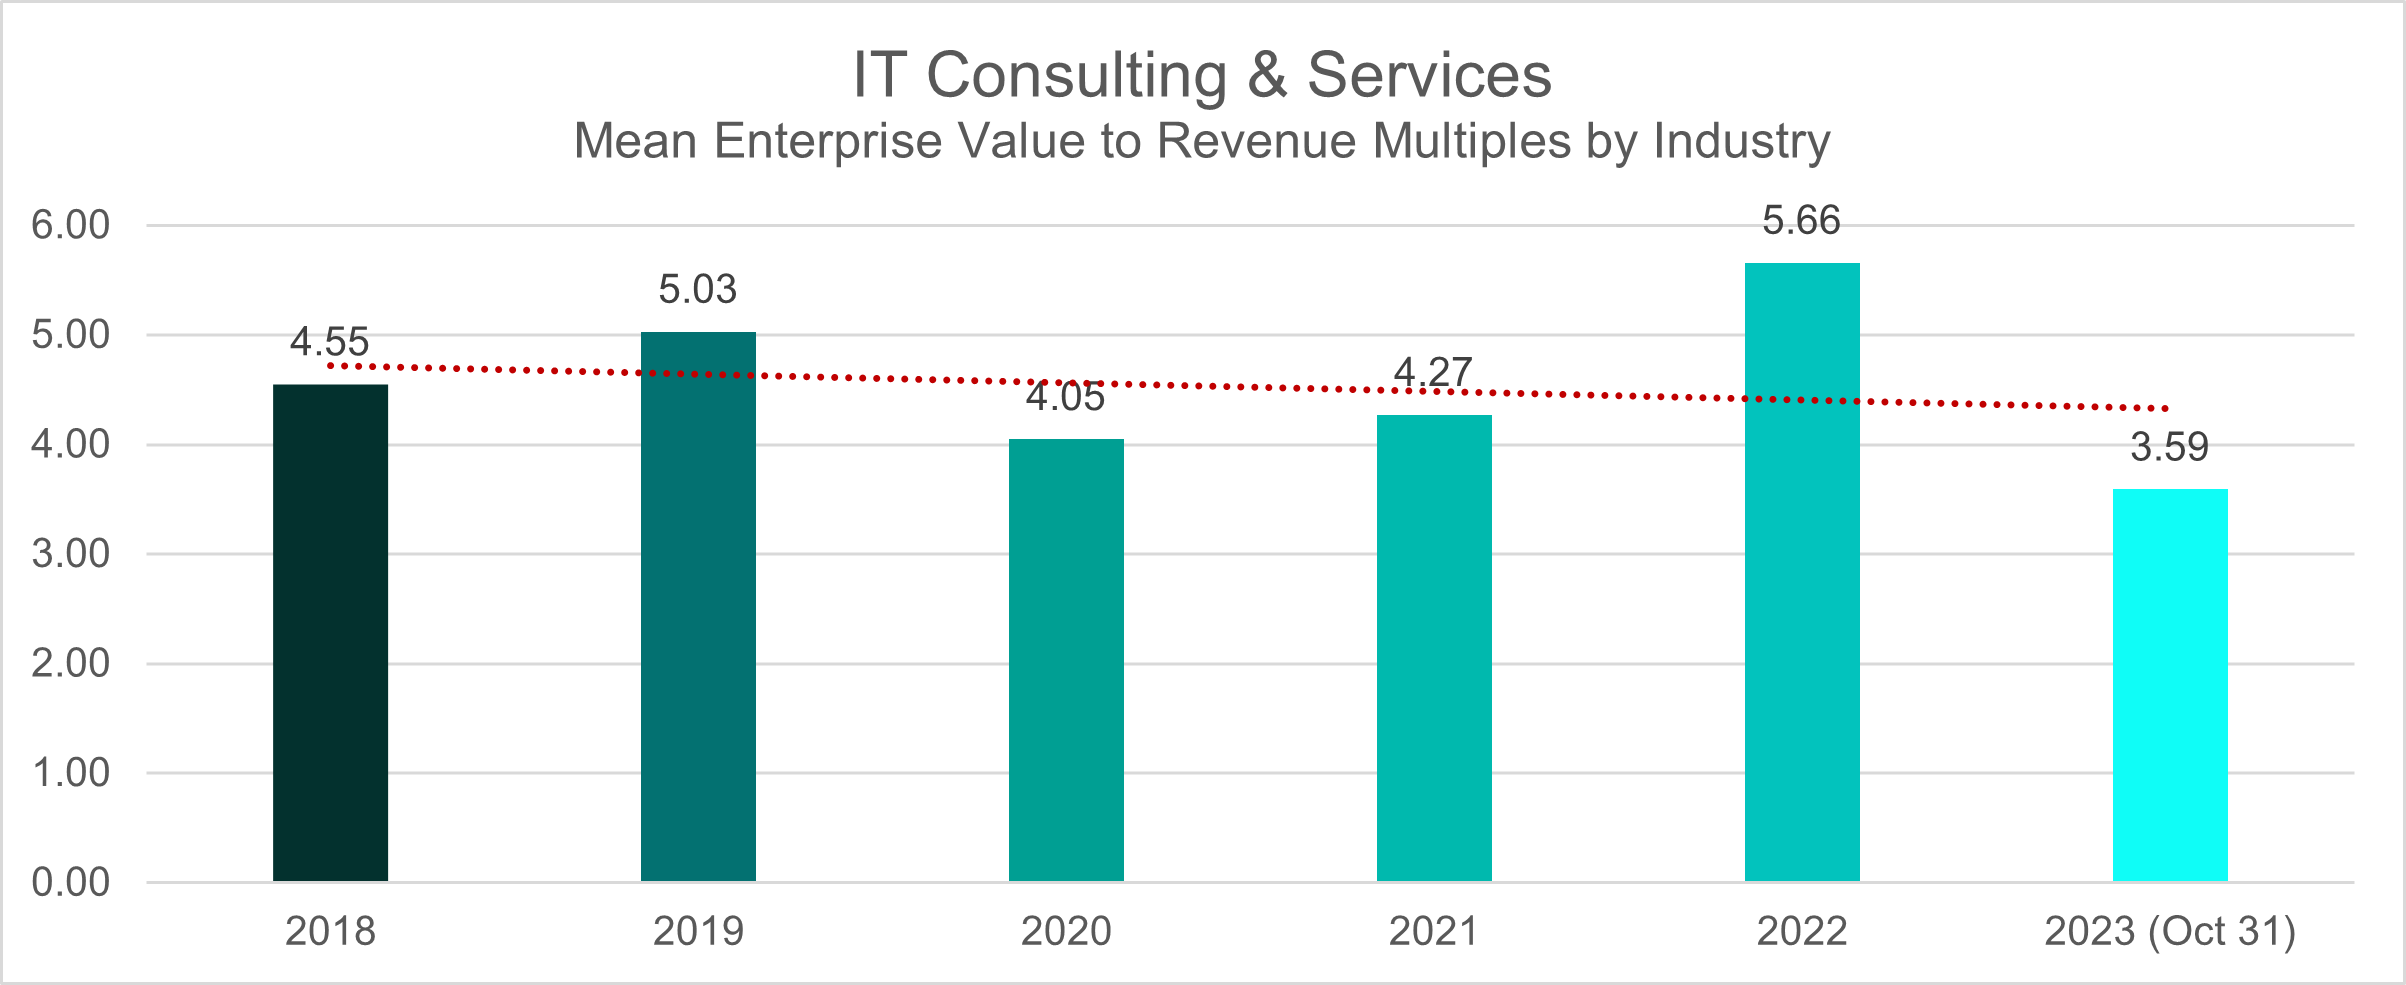
This trend is mirrored when considering the EV/Revenue metric over the same period. In the pre-pandemic years (2018-2019), the deal multiple remained steady within the range of 4.5-5. However, during the pandemic years (2020-2021), the deal multiple average decreased to 4. The sector exhibited a recovery in 2022, witnessing a rise in deal multiples to 5.6. However, the average settled at 4 as of October 2023.
Machinery
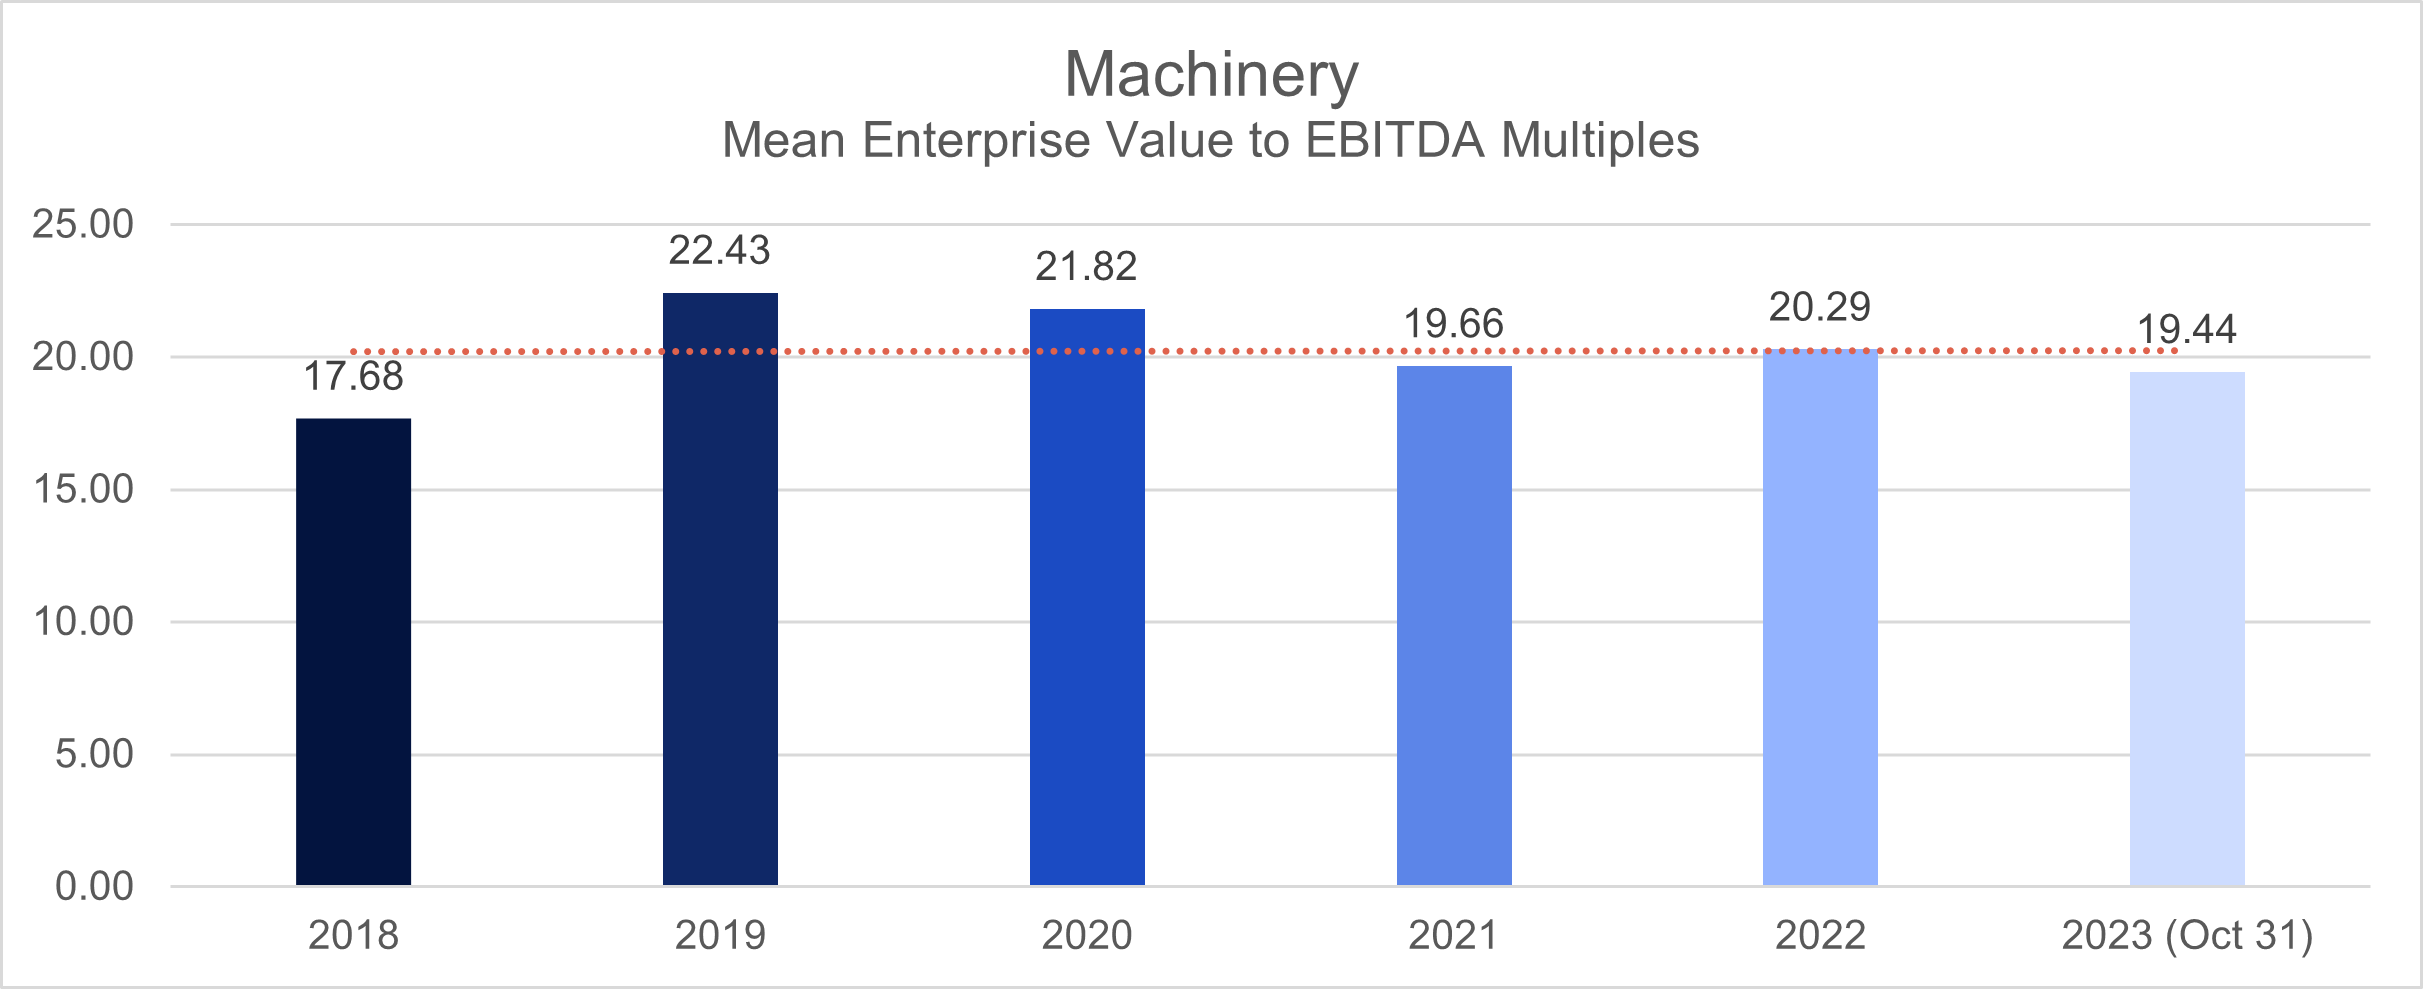
Between 2018 and 2019, the Machinery Industry maintained a relatively stable deal multiple, fluctuating between 17.7 and 22.4, as measured by the enterprise value to EBITDA (EV/EBITDA) metric.
The onset of the pandemic in 2020 saw a slight decline in deal multiples, dropping to 21.8. This trend persisted in the following year, with a further decrease to 19.6.
A modest recovery was observed post-pandemic in 2022, as the deal multiple average increased to 20.3. However, as of October 2023, the multiple has regressed to 19.4.
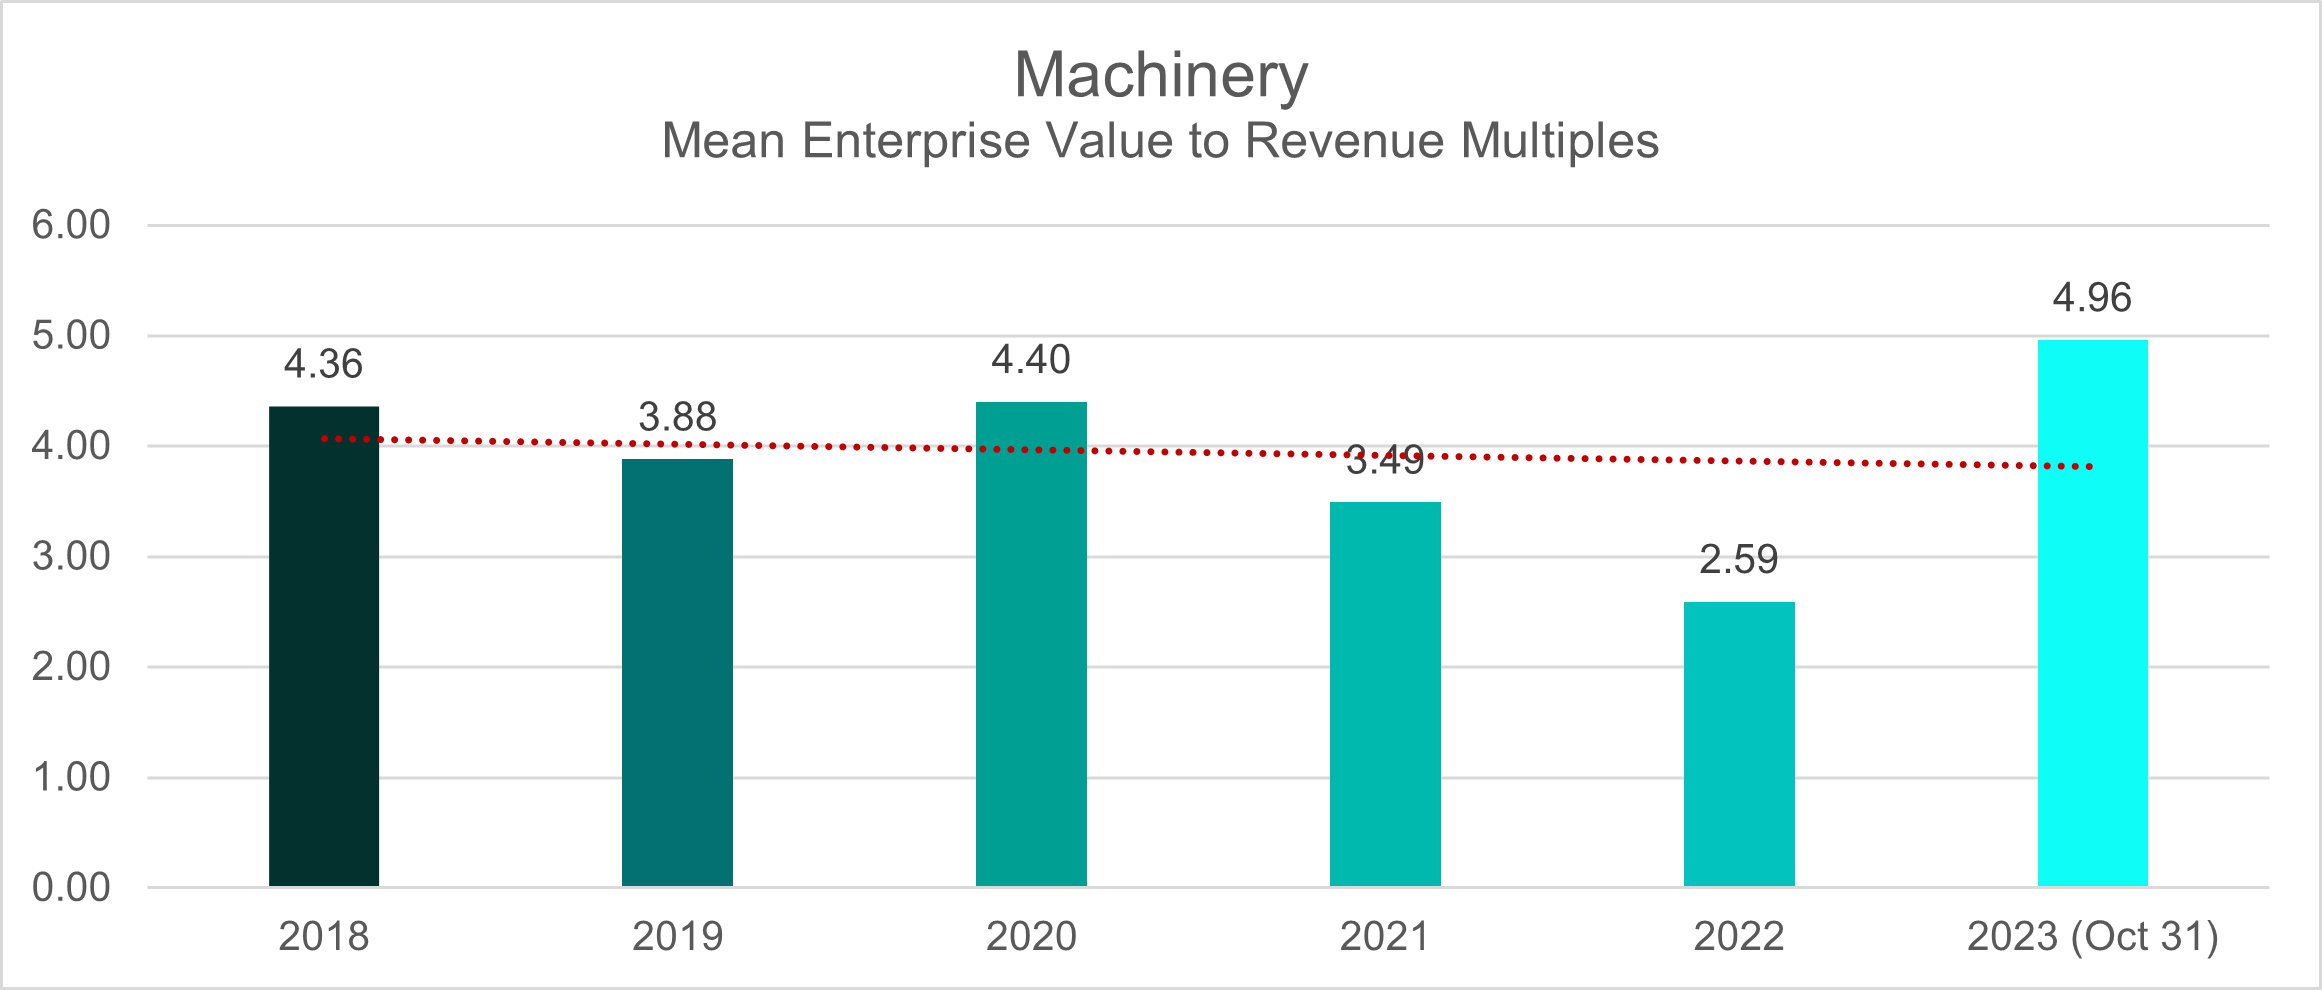
In terms of EV/Revenue ratio, the deal multiple average for the pre-pandemic period (2018-2019) was 4.3 and 3.8, respectively. This pattern persisted during the pandemic, with a recorded deal multiple mean of 4.4 in 2020, which then decreased to 3.5 in 2021.
The downward trajectory continued in 2022, with a notable decrease in the deal multiple average to 2.6. This significant decline could be indicative of broader economic challenges or sector-specific issues affecting revenue generation. The most recent data, as of October 2023, demonstrates a noteworthy recovery in the deal multiple average for the Machinery sector, reaching a high of 4.9.
Media & Entertainment
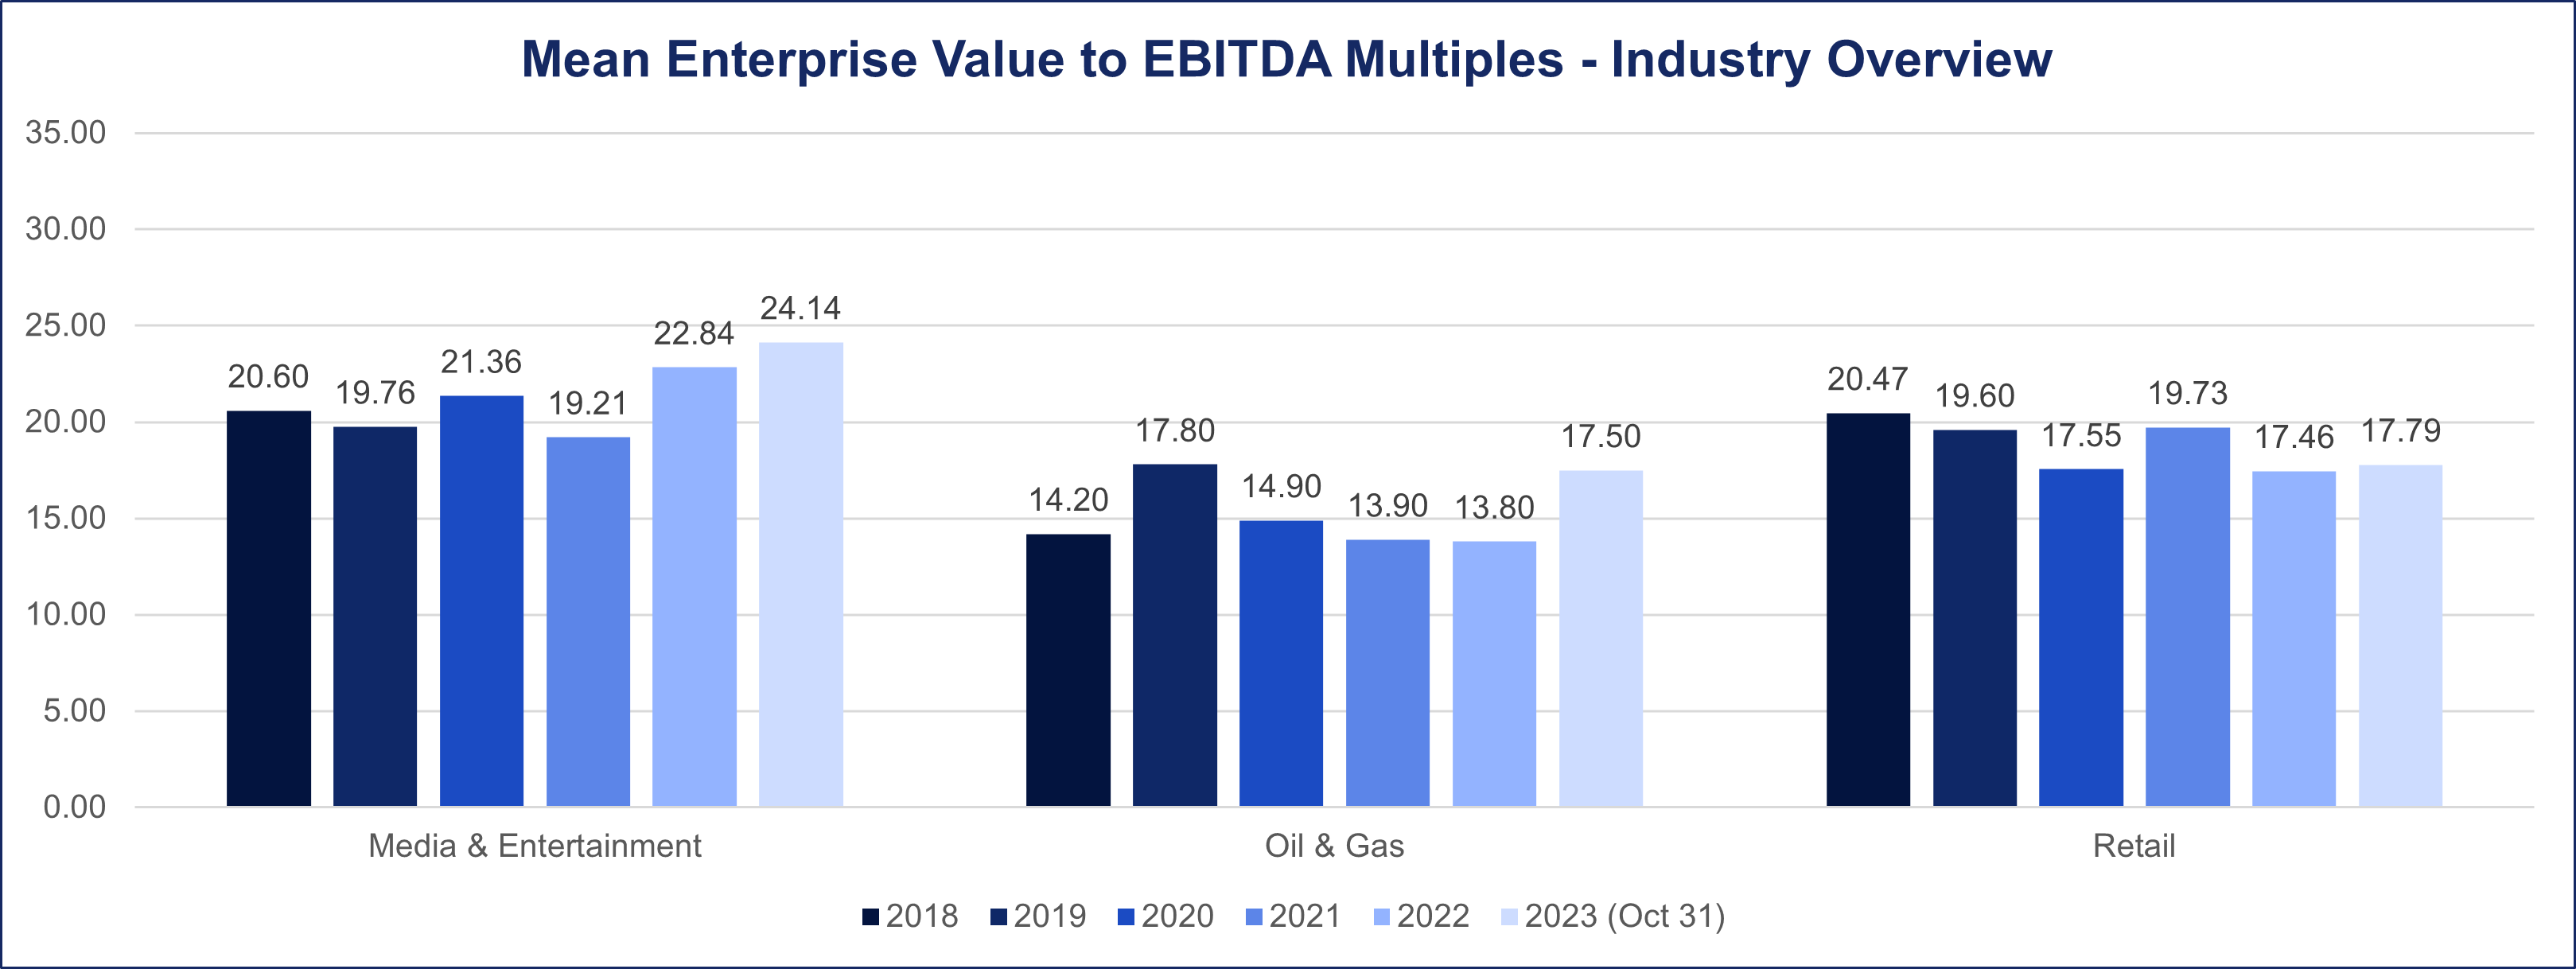
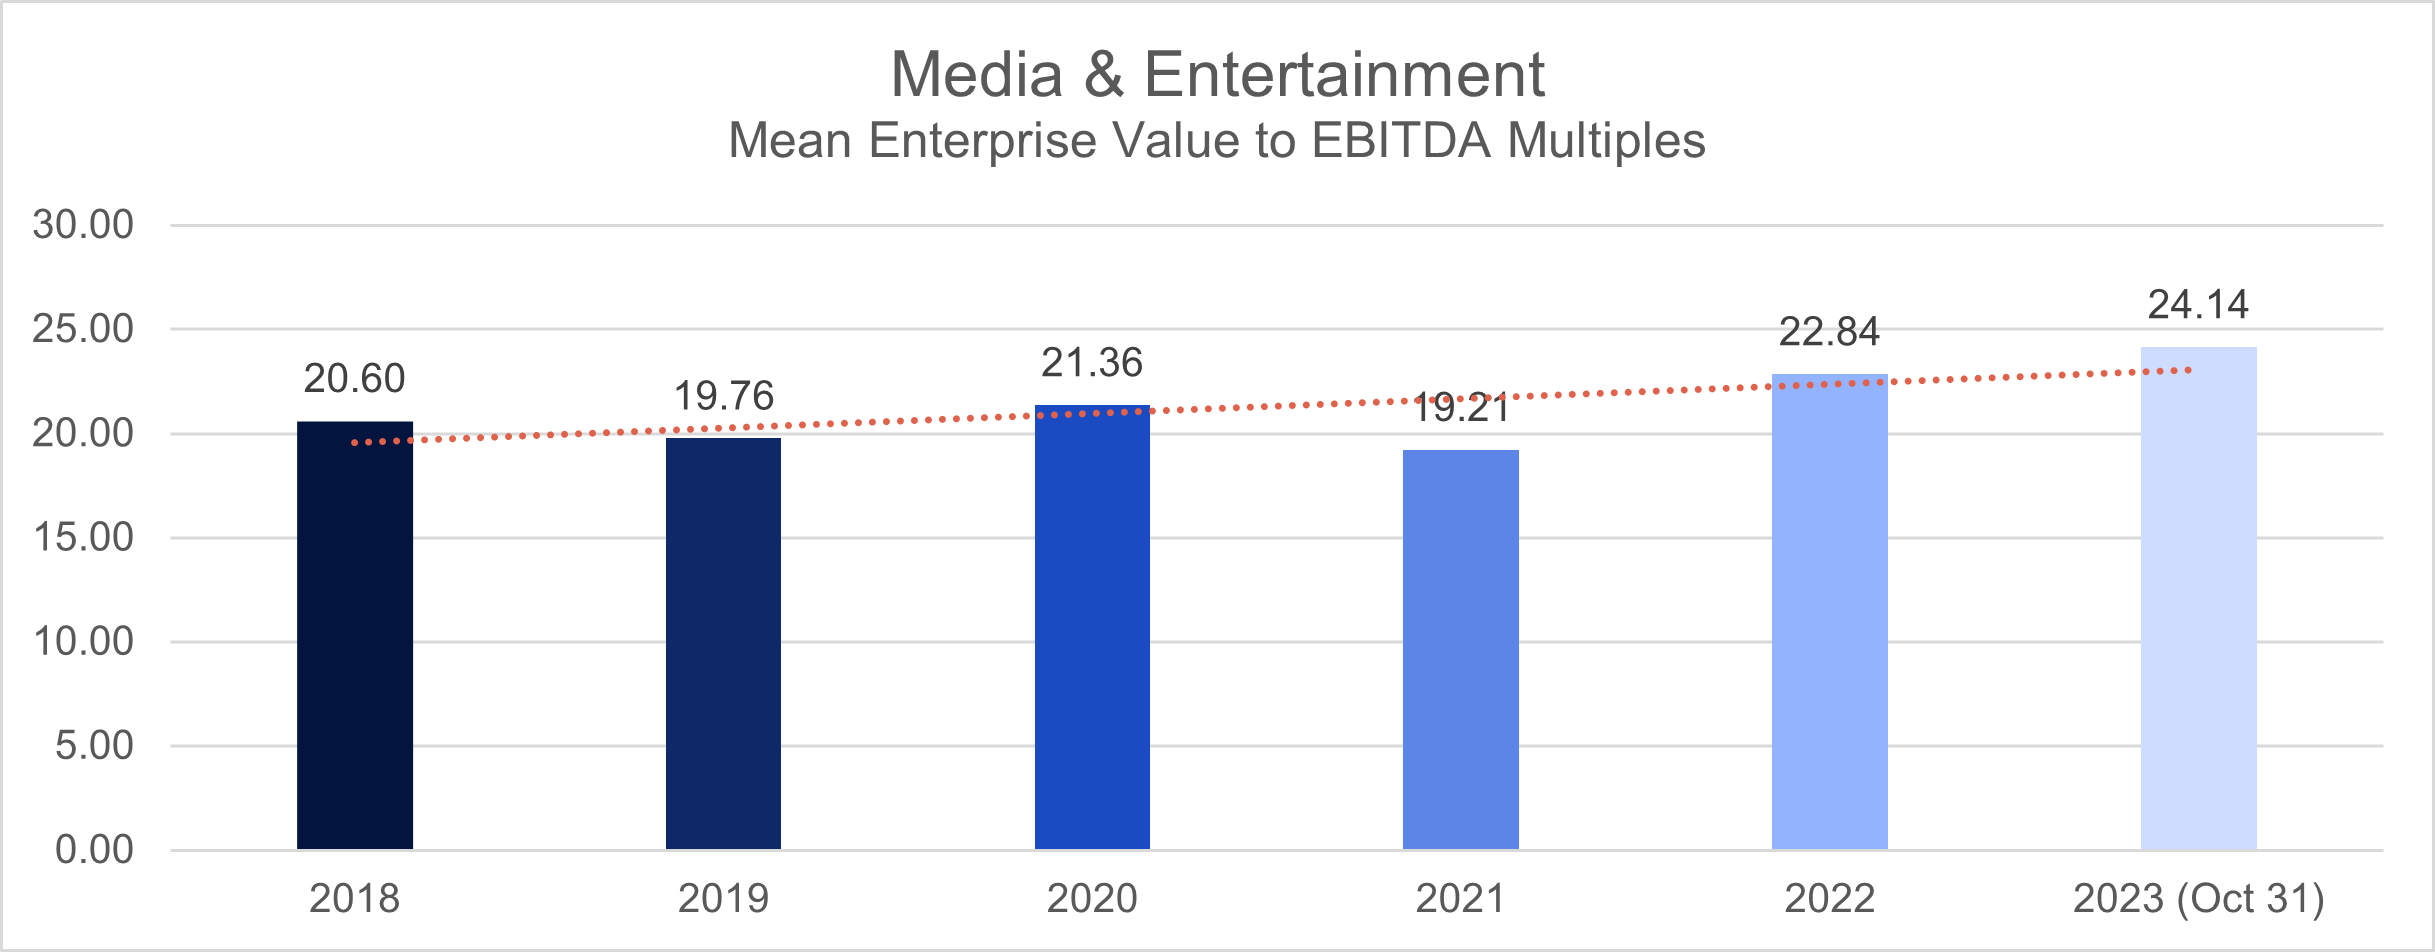
In 2018, the Media & Entertainment sector posted a deal multiple mean of 20.6, measured by the enterprise value to EBITDA (EV/EBITDA) metric. However, in 2019, this metric experienced a marginal decline, settling at 19.8.
Facing the challenges of the pandemic in 2020, the sector witnessed fluctuations in deal multiples, Despite reaching 21.4 in 2020, there was a subsequent decrease to 19.2 in 2021.
Post-pandemic recovery in 2022 yielded promising results, with the average deal multiple for the Media & Entertainment sector settling at 22.8. As of October 2023, the industry’s deal multiples have further increased to 24.
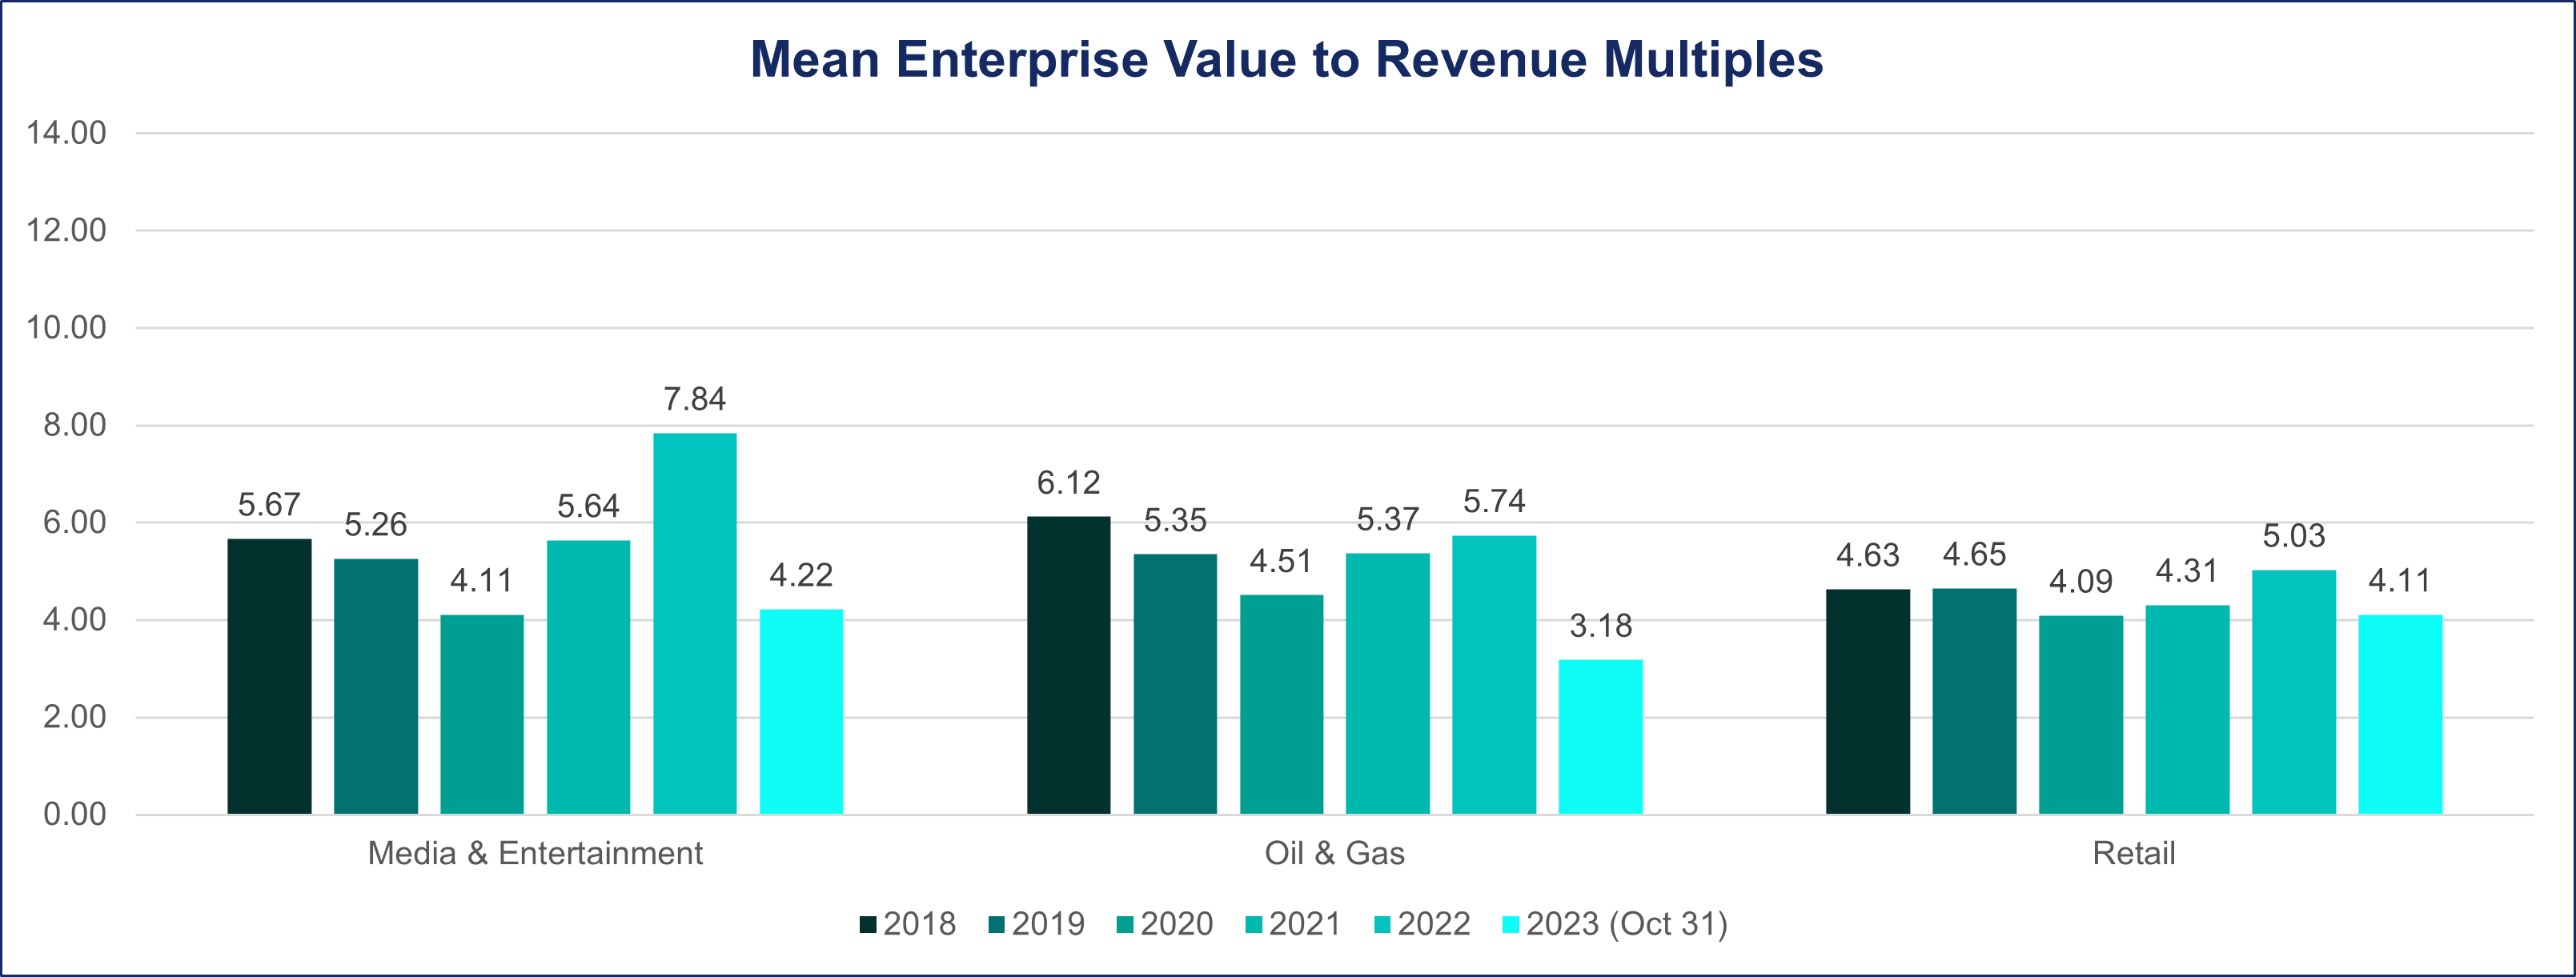
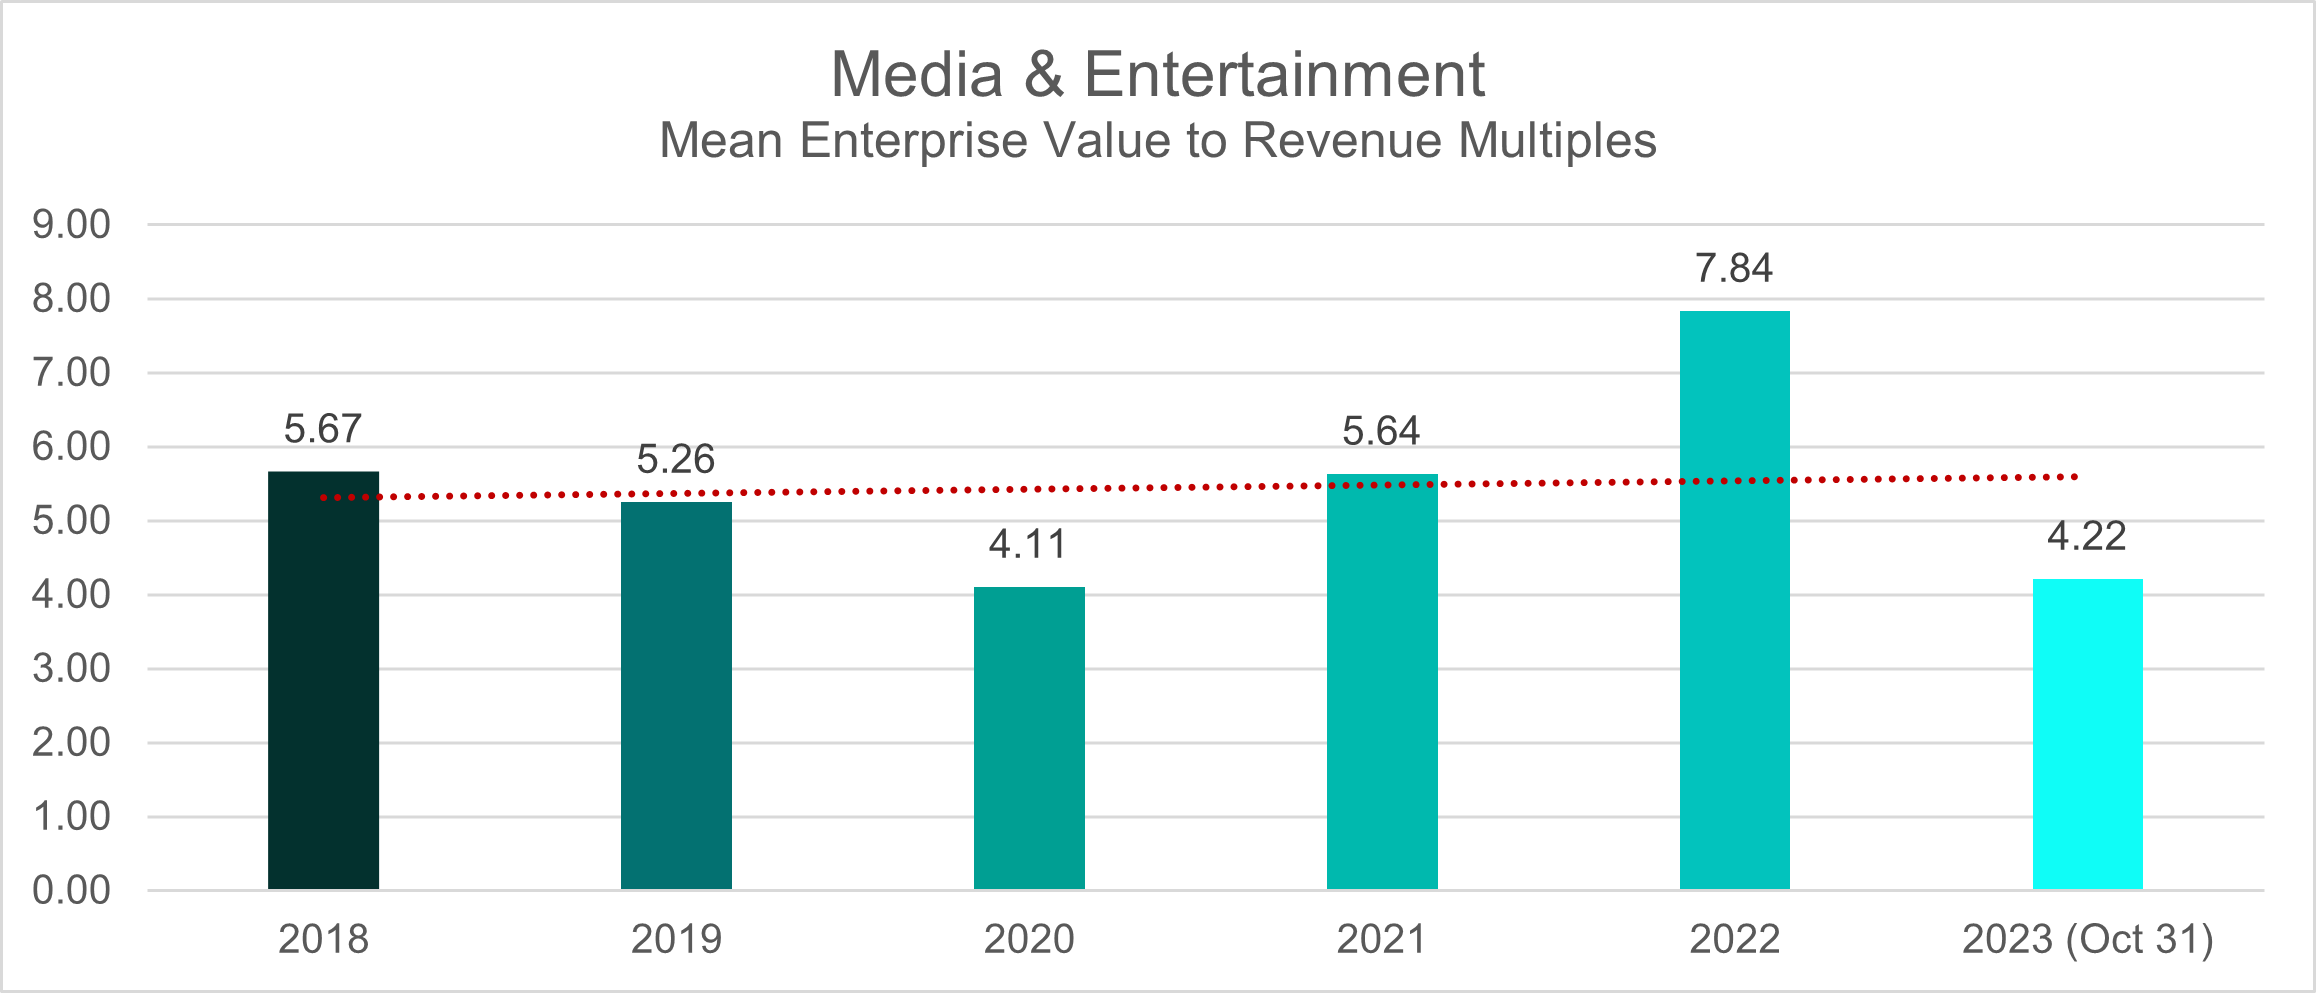
Similar trends are observed using the EV/Revenue metric. The average deal multiple ranged between 5.2-5.7 during the pre-pandemic period (2018-2019). This average dropped to 4.11 at the start of the pandemic in 2020 but made a significant recovery the year after, reaching 5.6.
The industry reached a peak in 2022, recording a record-high deal multiple of 7.8 during the post-pandemic recovery. However, as of October 2023, there has been a slight contraction, with the deal multiple decreasing to 4.2.
Oil & Gas
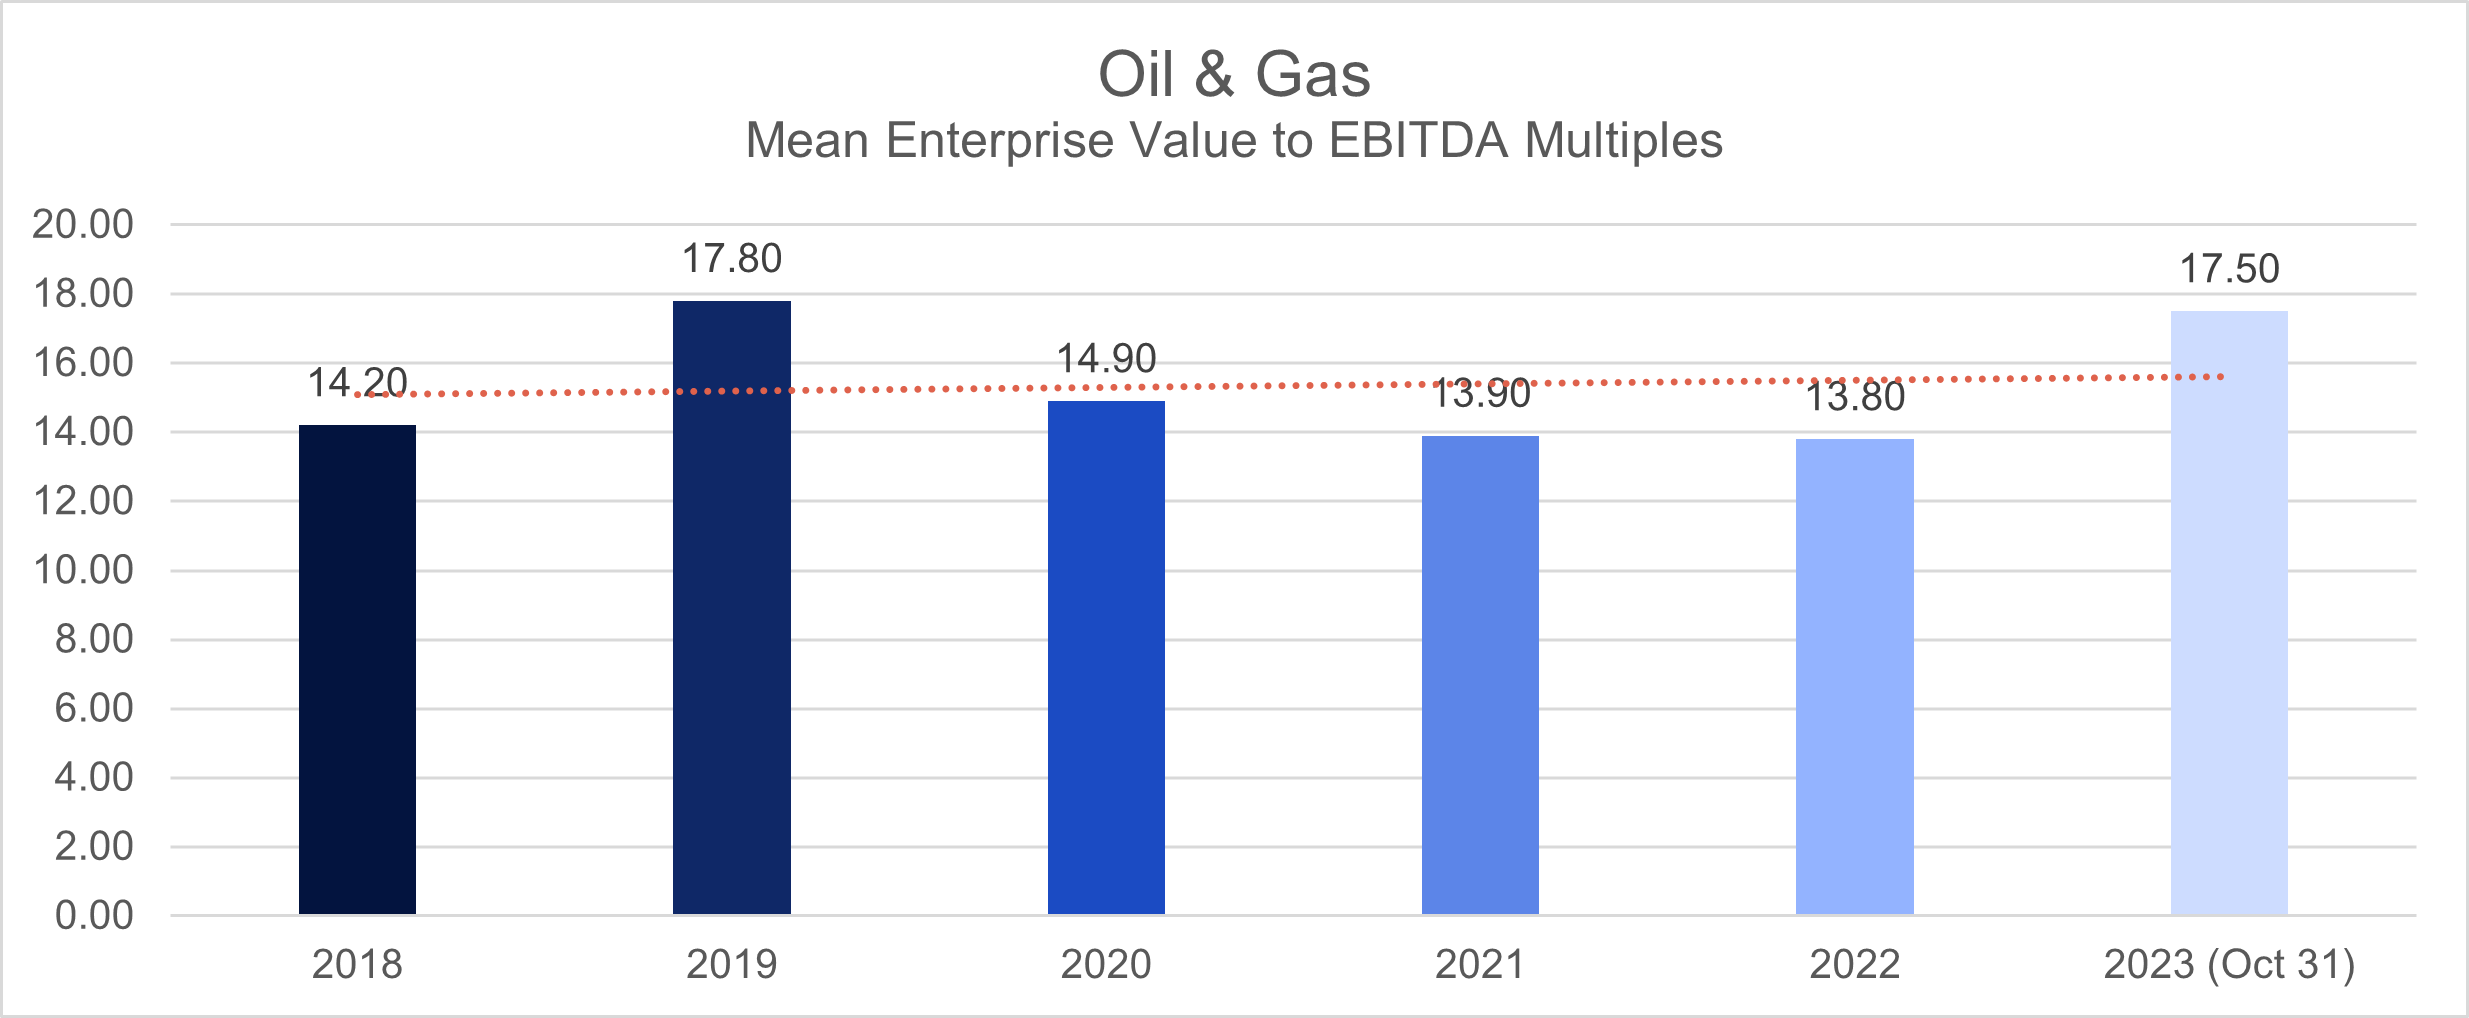
In the years 2018-2019, before the onset of the pandemic, the Oil & Gas industry experienced deal multiples averaging 14.2 and 17.8, respectively, with a noticeable uptick in 2019 when evaluated through the Enterprise Value to EBITDA (EV/EBITDA) metric.
The landscape underwent a significant transformation with the advent of the pandemic in 2020. The mean deal multiple for the industry dipped to 14.9 in 2020 and further contracted to 13.9 in 2021, underscoring the unprecedented challenges faced by the sector during those tumultuous years.
The post-pandemic recovery witnessed a sustained decline in deal multiples for the Oil & Gas sector, with a slight reduction to 13.8 in 2022. By October 2023, the industry showcased clear signs of recovery, with the average deal multiple rebounding to 17.5.
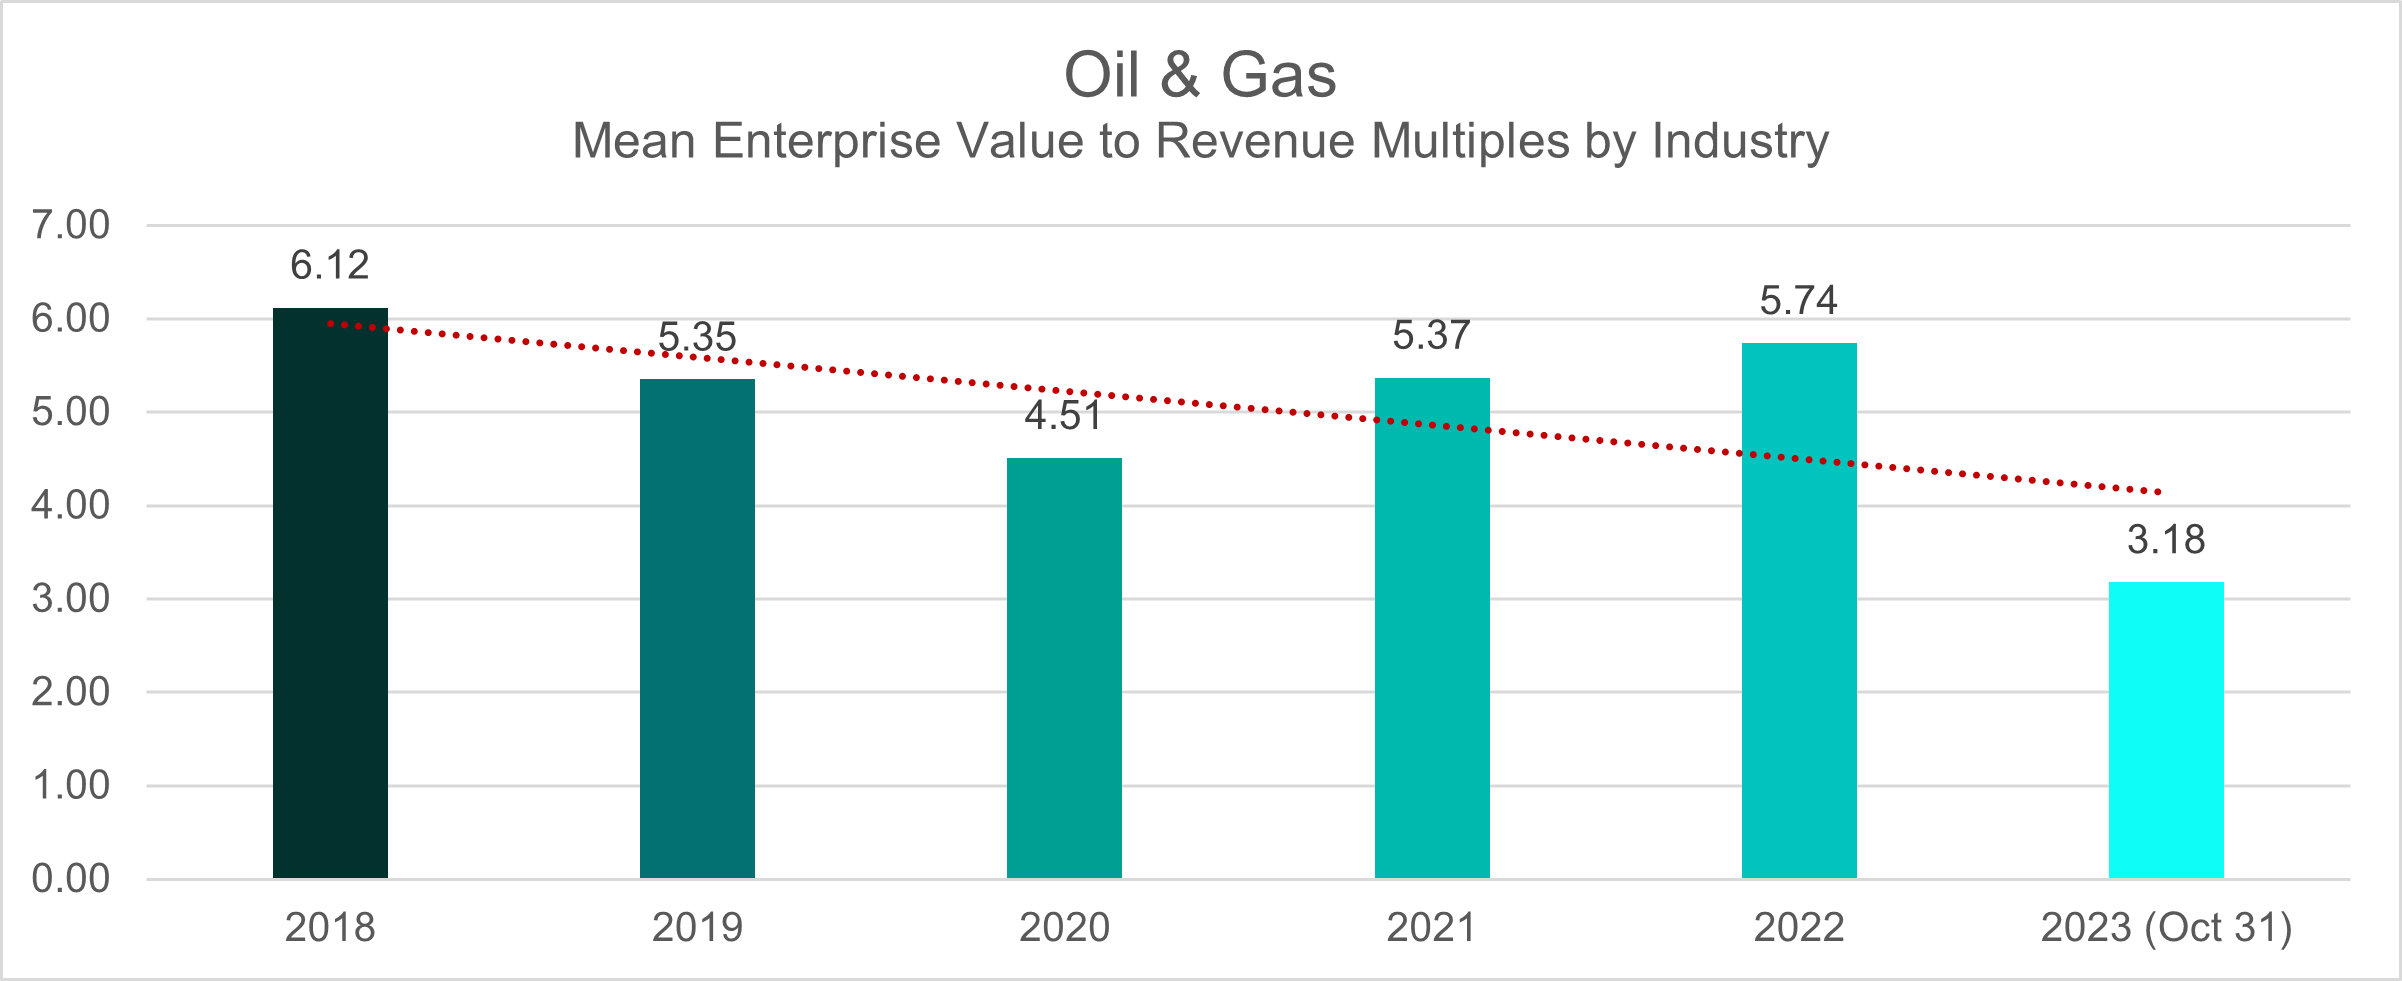
Observations using the EV/Revenue metric paint a different picture. During the pre-pandemic period, the deal multiple average was 6.2 in 2018, dropping to 5.3 in 2019. This downward trend persisted at the beginning of the pandemic, with deal multiples further declining to 4.5. However, the industry showed resilience in 2021, with the deal multiple average increasing to 5.3.
In the post-pandemic period of 2022, the mean deal multiple rose to 5.7. However, as of October 2023, the average deal multiple for the Oil & Gas industry is currently at 3.2.
Retail
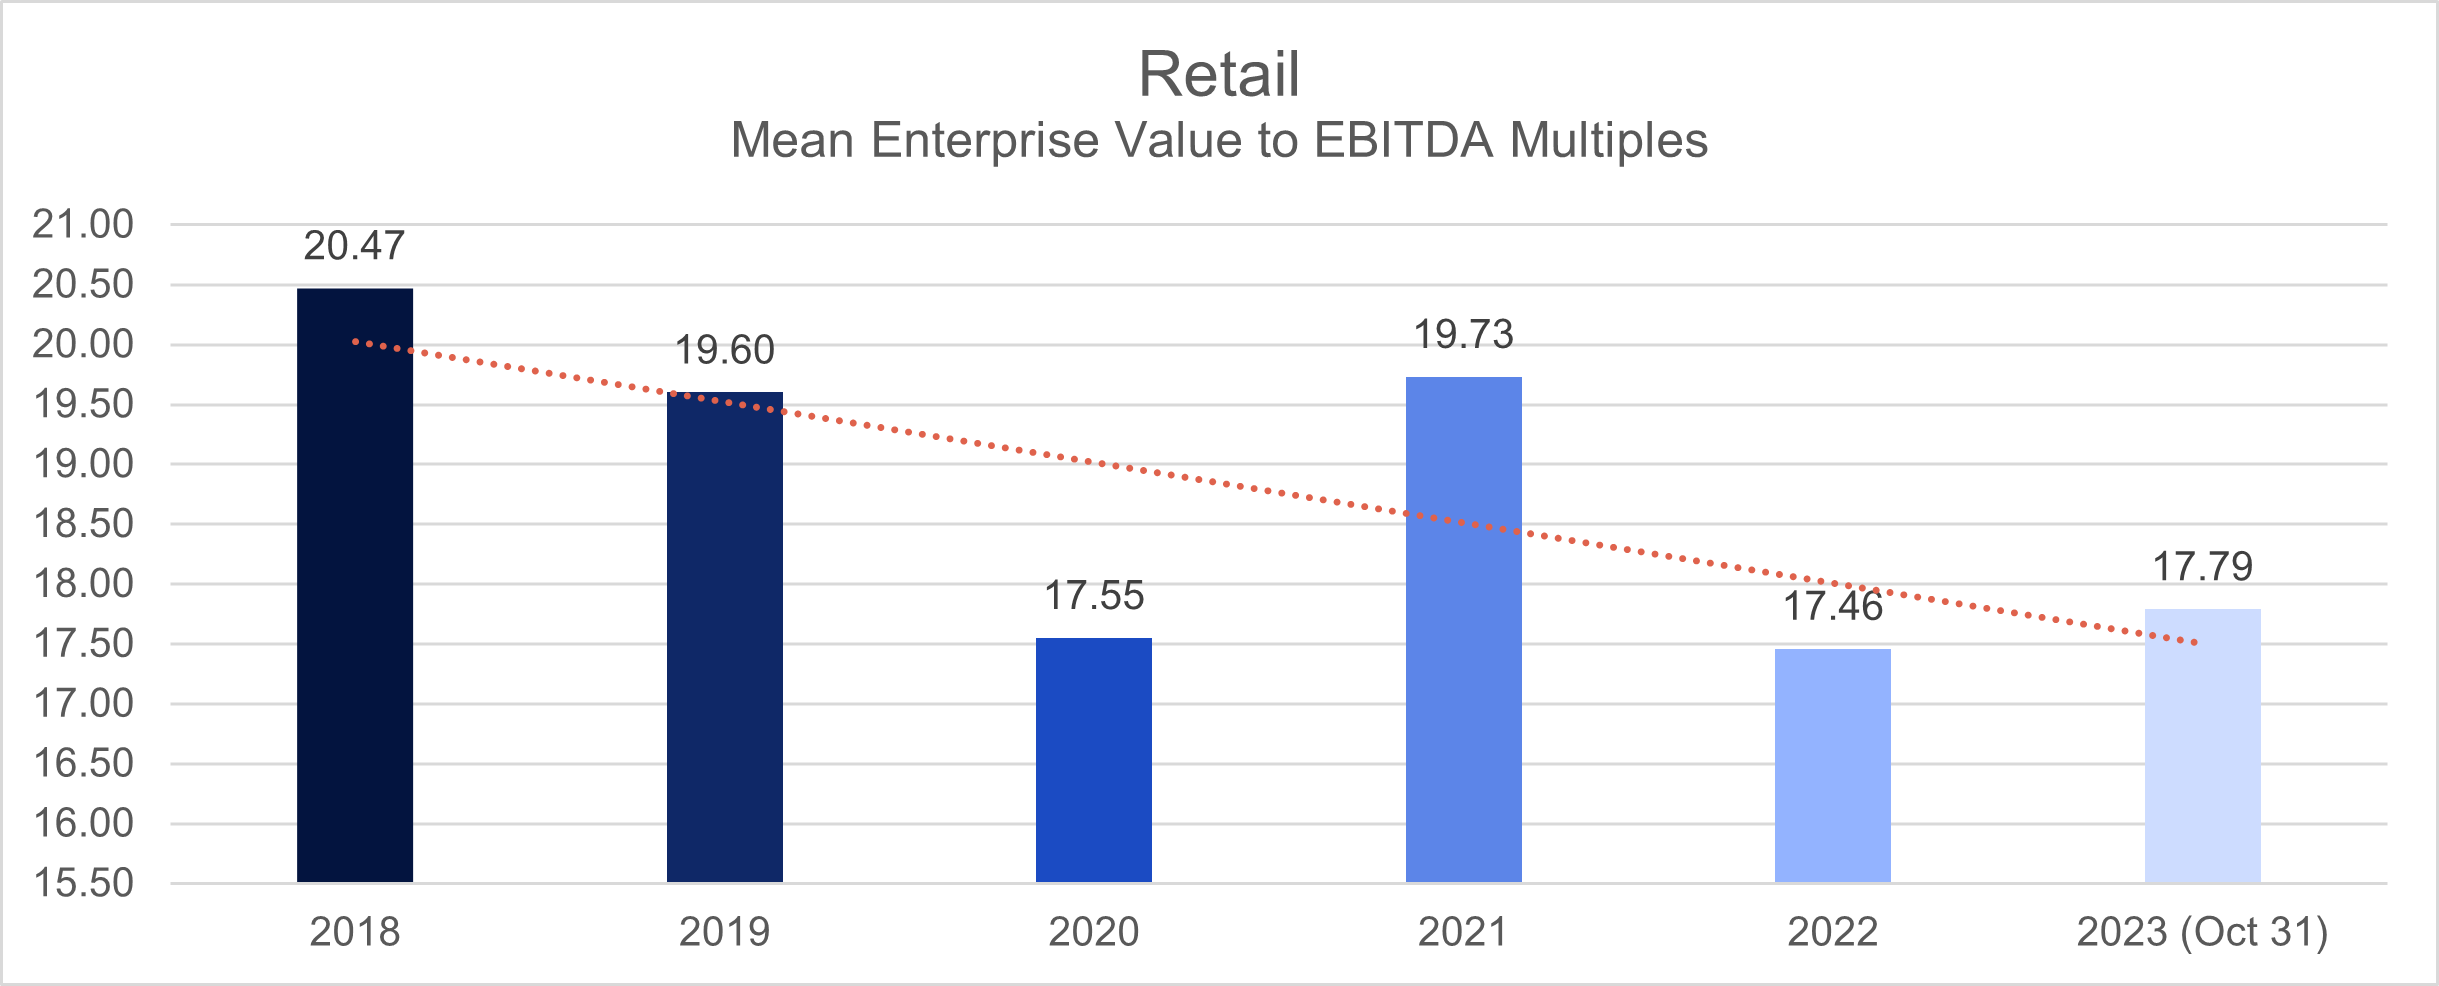
During the pre-pandemic period spanning from 2018 to 2019, the Retail sector displayed mean deal multiples of 20.5 and 19.6, respectively, based on the Enterprise Value to EBITDA (EV/EBITDA) metric.
The pandemic, particularly in 2020, ushered in a notable shift, witnessing a dip in deal multiples to 17.6. Despite this turbulence, the retail industry showcased remarkable resilience, rebounding to a deal multiple of 19.7, hovering around the 19 mark.
However, the post-pandemic years of 2022-2023 revealed a downward trajectory in deal multiples, settling at 17.8 as of October 2023.
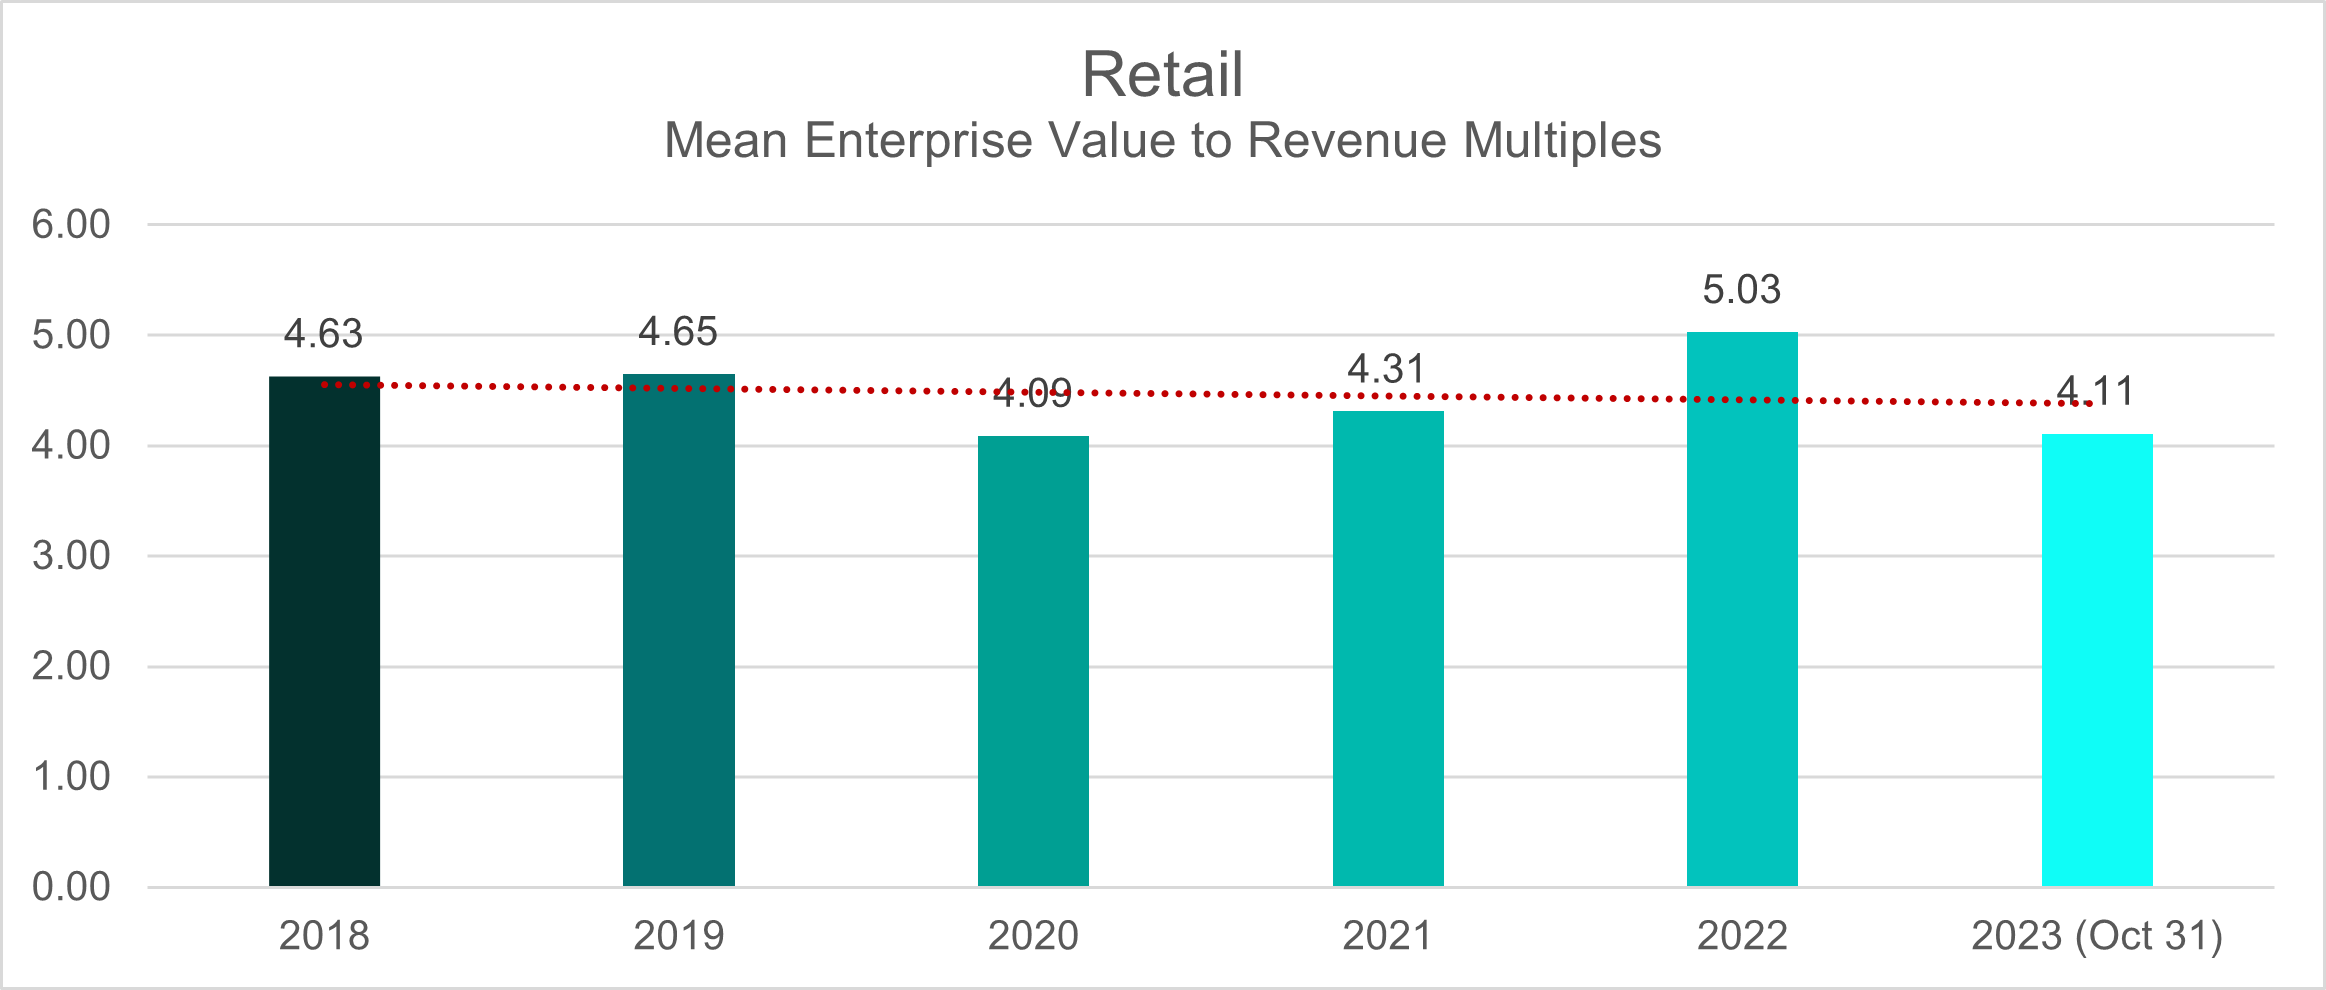
Notably, the mean deal multiples trend exhibited greater stability when assessed using the EV/Revenue metric. From 2018 until the conclusion of the pandemic in 2021, the retail sector maintained a deal multiple average within the range of 4.1 to 4.6.
Post-pandemic recovery saw a commendable uptick, with the deal multiple average reaching 5. However, as of October 2023, the deal multiples have recalibrated to 4.1, suggesting a nuanced trajectory in the industry’s financial landscape.
Software
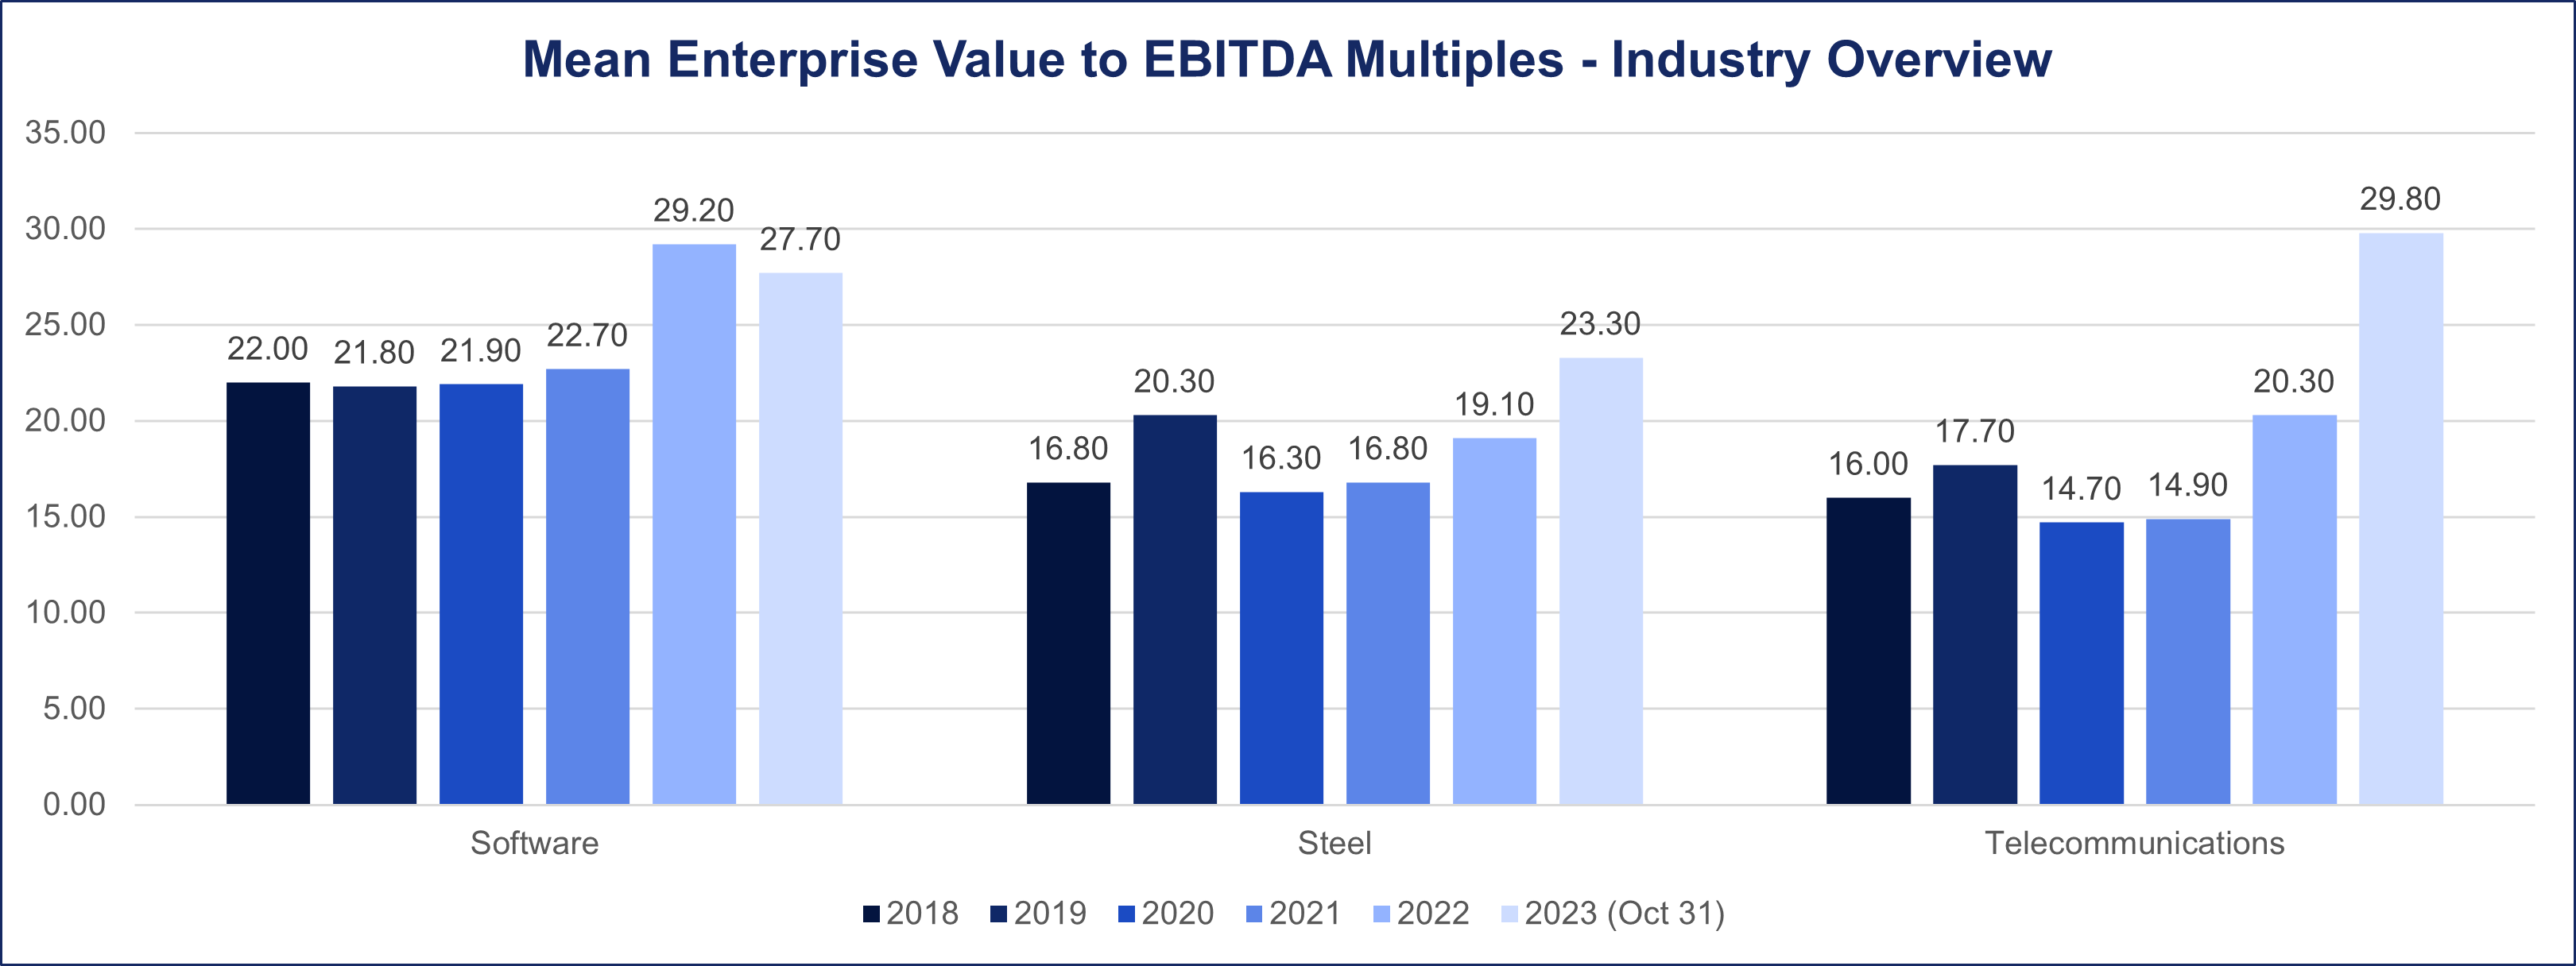
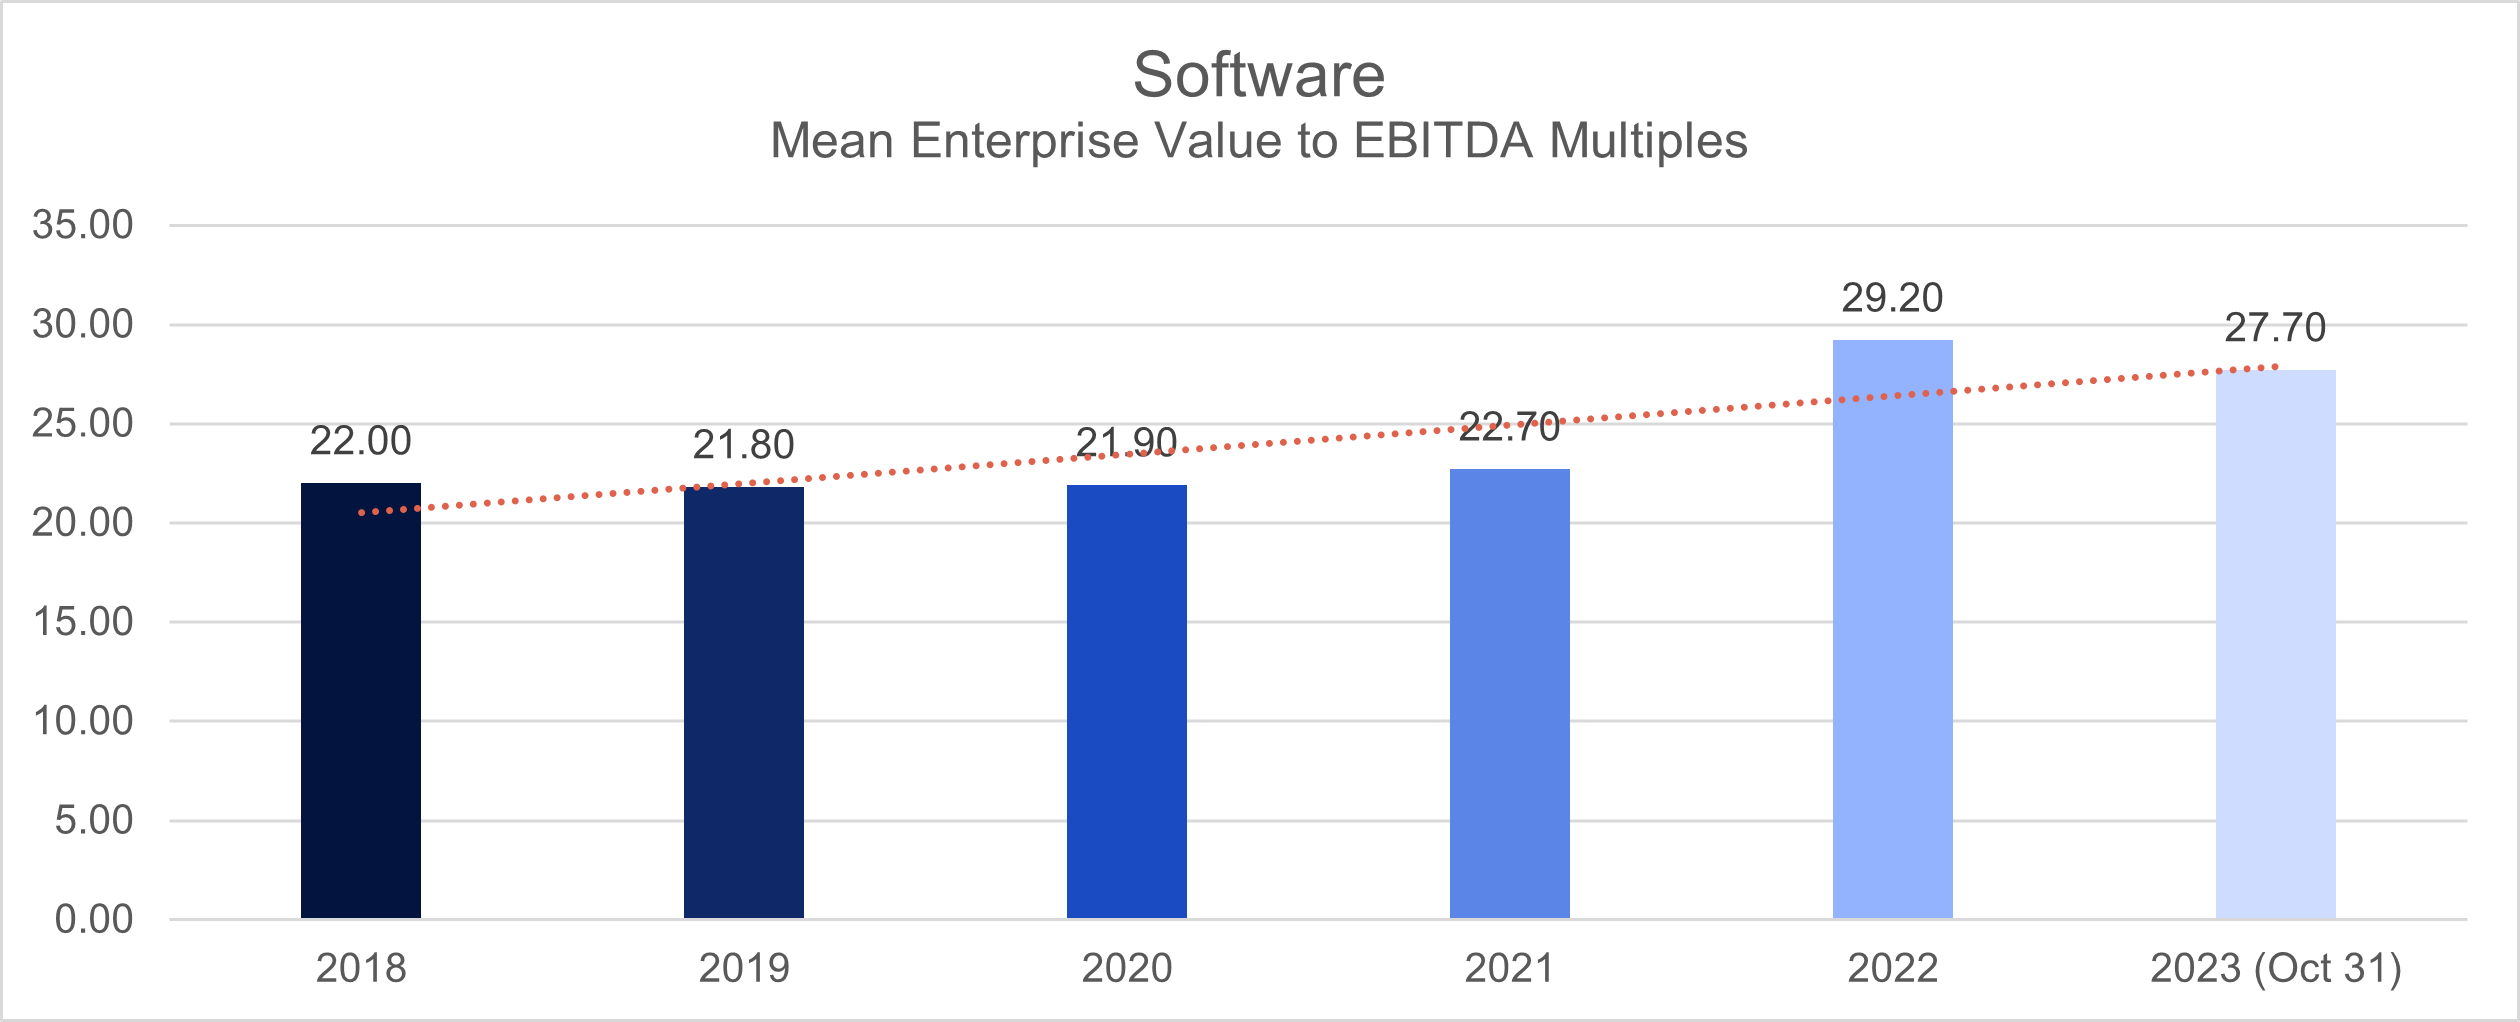
Between 2018 and 2019, the Software Industry showcased a remarkable consistency in its mean deal multiples, maintaining a tight range from 21.8 to 22, as measured by the Enterprise Value to EBITDA (EV to EBITDA) ratio.
Remarkably, the industry managed to uphold this stability through the challenging pandemic years of 2020-2021, recording an average deal multiple of 21.9 in 2020 and further increasing to 22.7 in 2021.
The post-pandemic landscape, notably in 2022, witnessed a notable resurgence as the deal multiple average for the Software sector surged to 29.2. This surge could be attributed to increased demand for software solutions in the wake of evolving business needs and digital transformations post-pandemic. As of October 2023, the recorded deal multiple for the industry stands at 27.7.
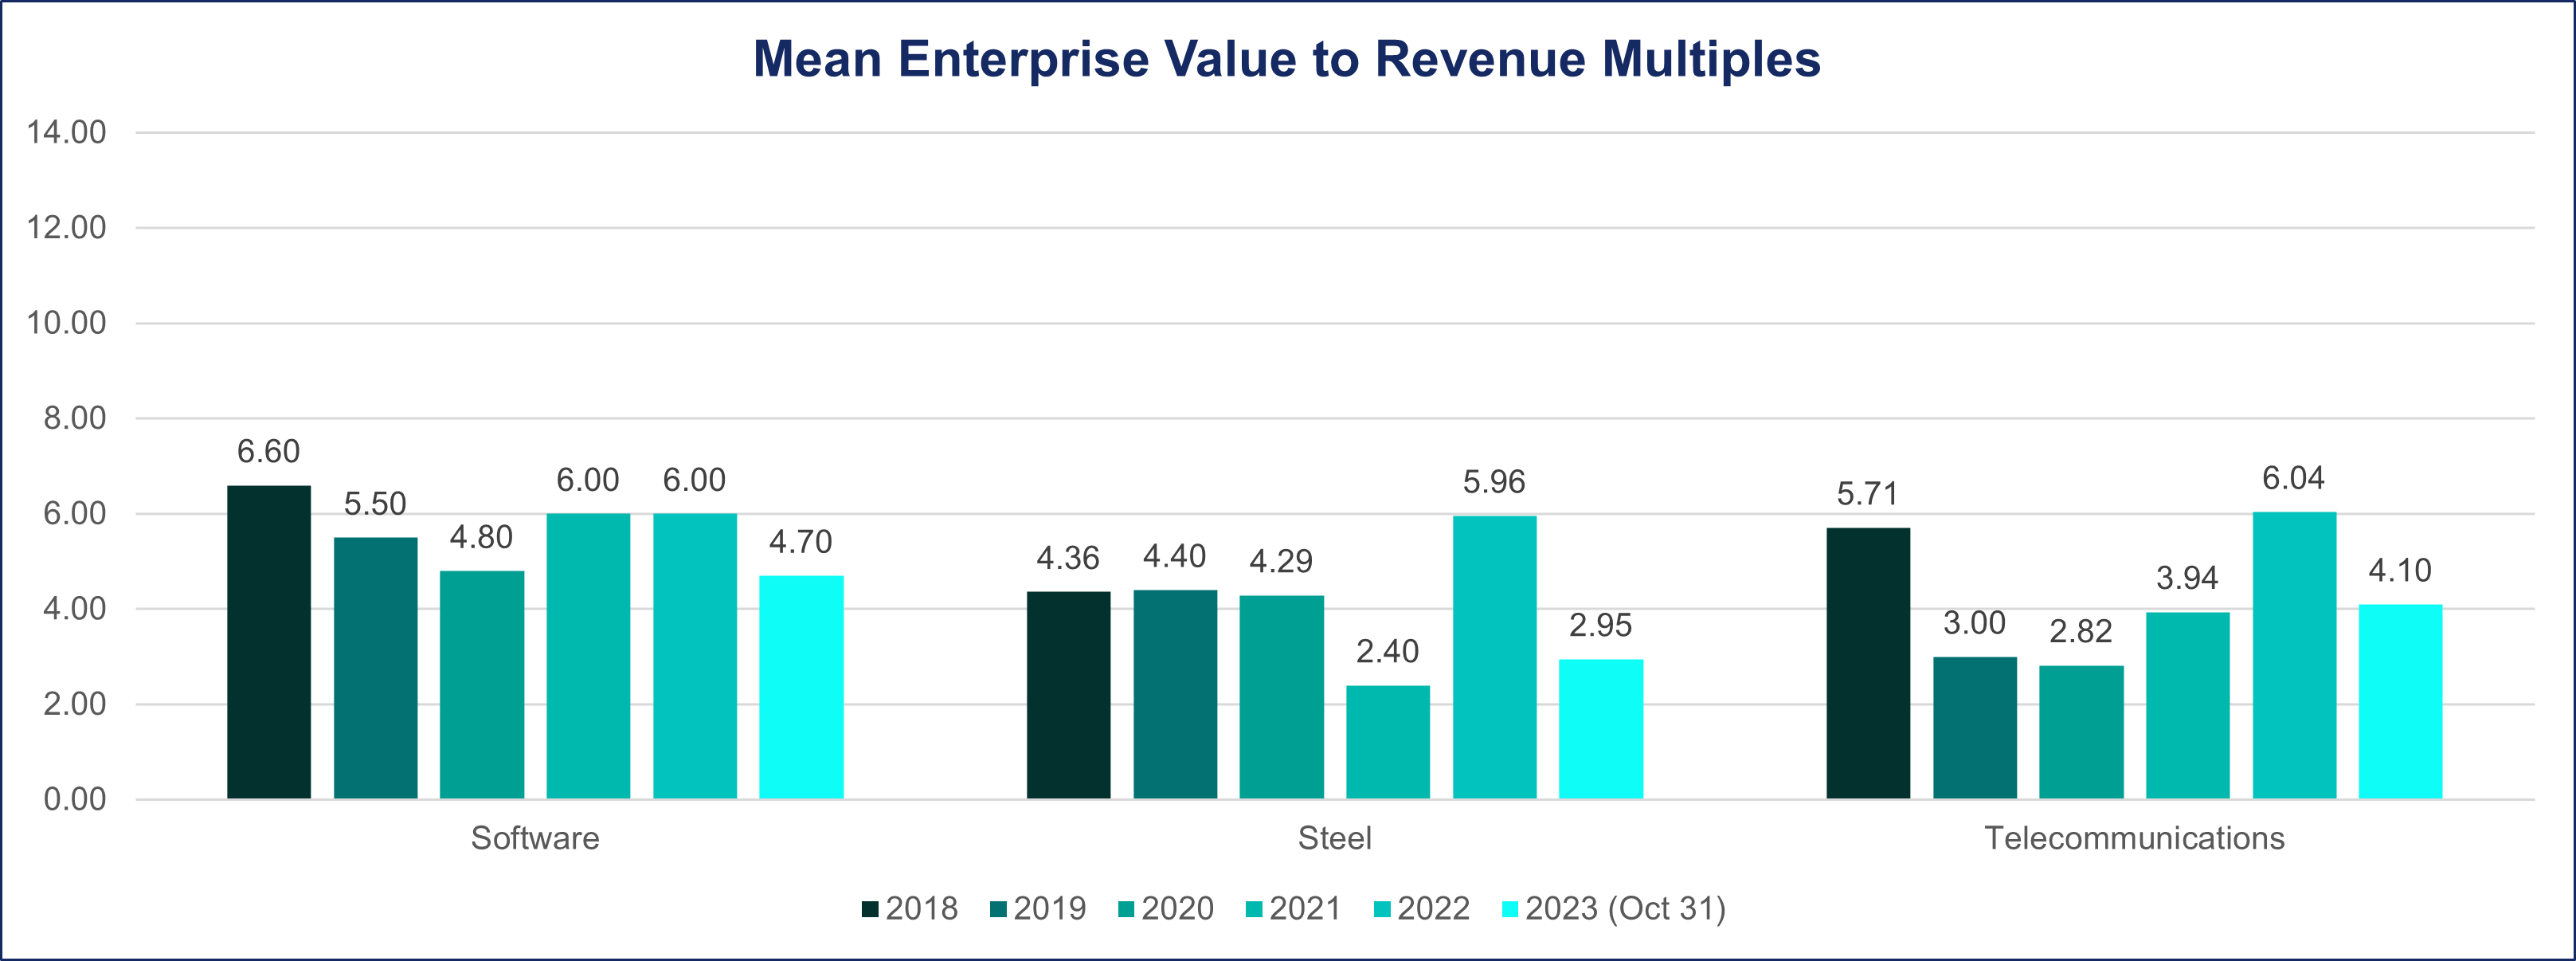
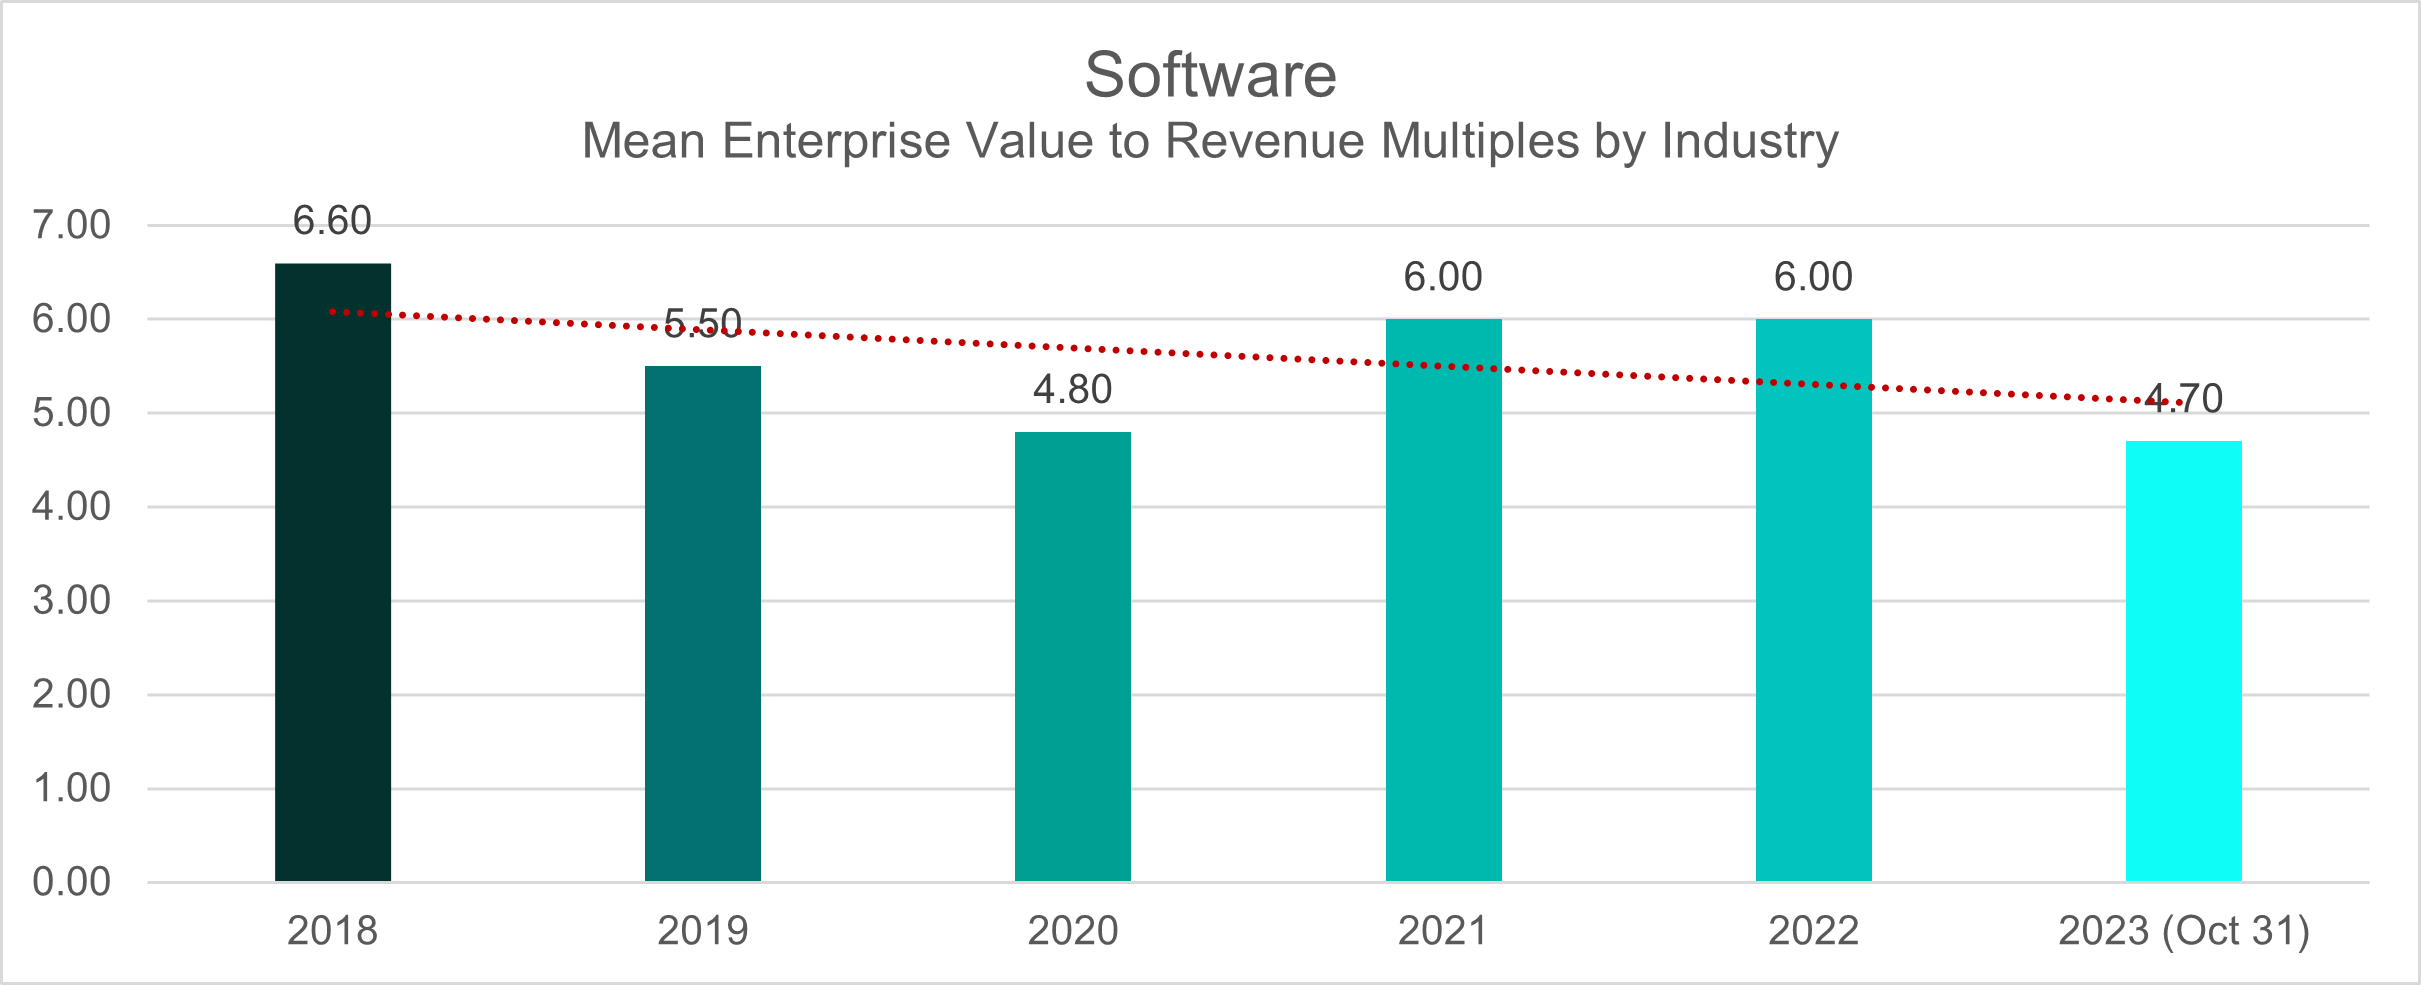
Shifting the lens to the EV/Revenue metric, the mean deal multiple was 6.6 and 5.5, respectively, during the 2018-2019 period. As the pandemic unfolded in 2020, the deal multiple dipped to 4.8, experiencing a rebound the following year, reaching an average of 6. This average persisted post-pandemic in 2022 before settling to a deal multiple of 4.7 as of October 2023.
Steel
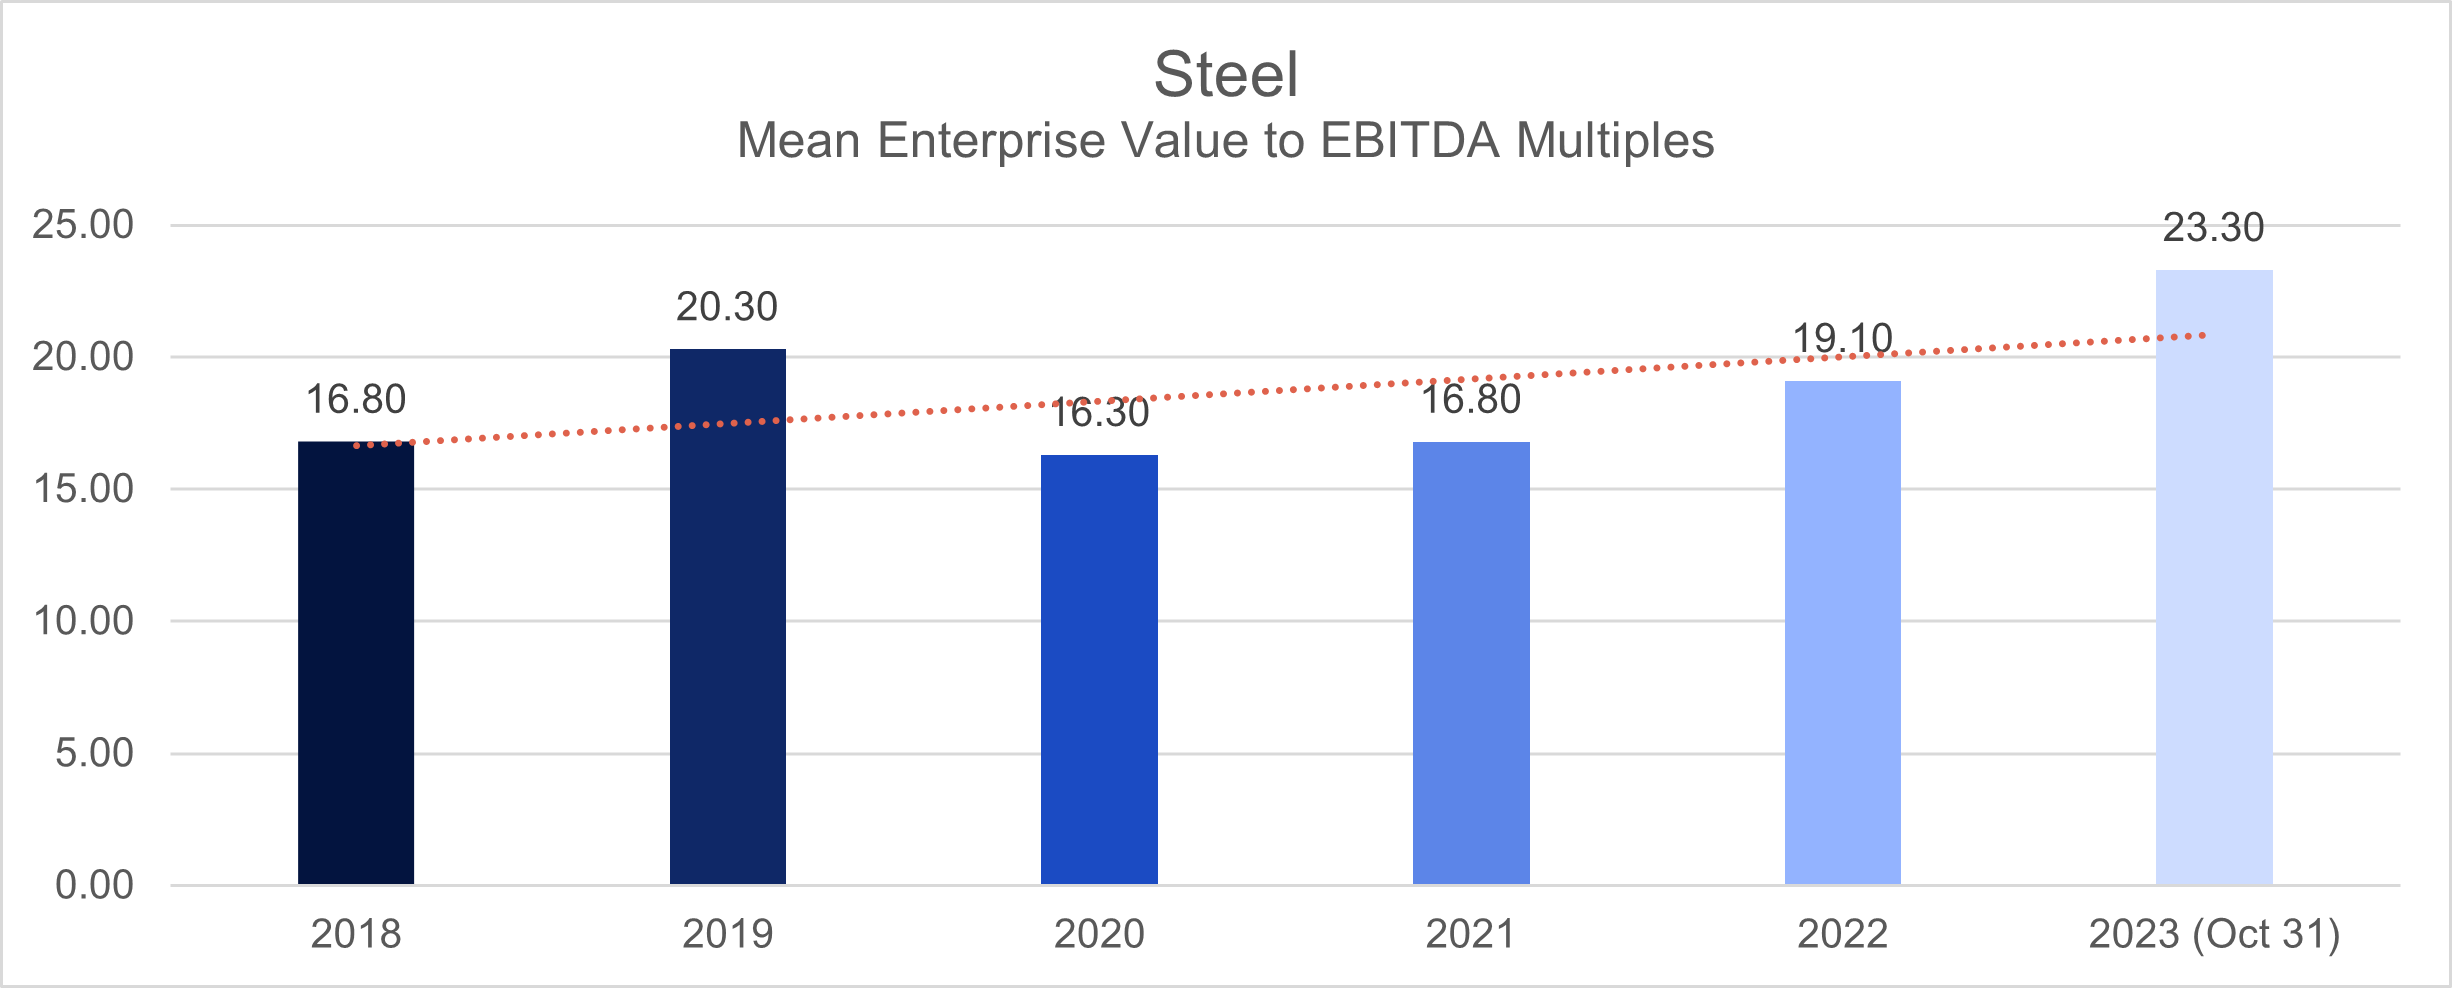
In the pre-pandemic era, the Steel Sector demonstrated a noteworthy trajectory in deal multiples, showcasing an increase from an average of 16.8 in 2018 to 20.3 in 2019 when assessed through the EV/EBITDA metric.
In 2020, a noticeable shift occurred as deal multiples experienced a significant decrease, dropping to 16.3. Subsequently, a modest recovery ensued in the following year, bringing the average back to 16.8.
Entering the post-pandemic landscape in 2022, the industry saw a recovery with the deal multiple average rising to 19.1. As of October 2023, a notable upswing materialized, with the deal multiple means readjusting to an impressive 23.3, signaling a potential stabilization or realignment in the industry’s valuation dynamics.
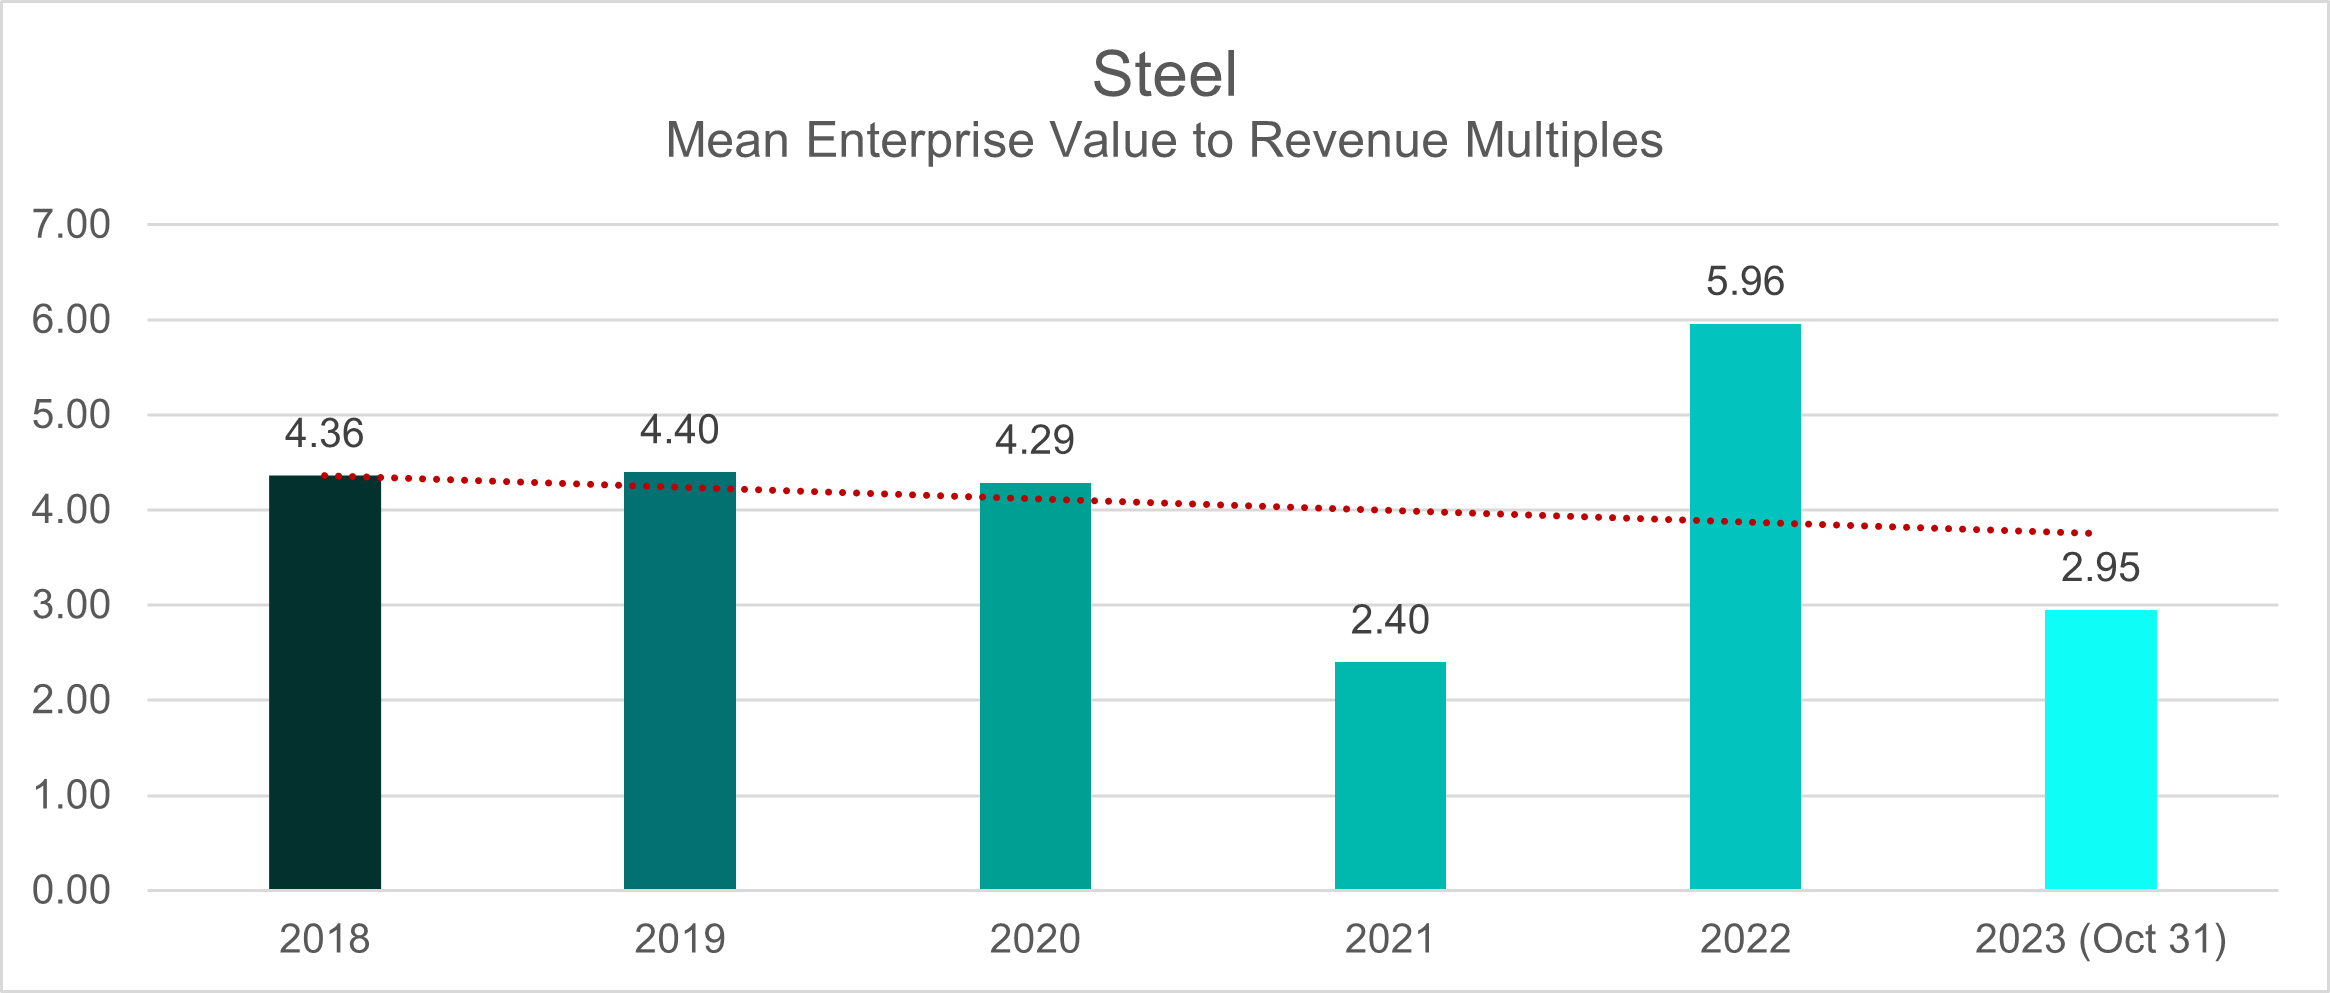
Shifting the lens to the EV/Revenue ratio reveals a distinct trend in the Steel industry. During the pre-pandemic years of 2018-2019, the mean deal multiples stood at 4. This ratio remained constant at the onset of the pandemic in 2020 before experiencing a notable decline to 2.4 in 2021. However, the industry rebounded in 2022, boasting a record deal multiple average of 5.9. Nevertheless, as of October 2023, the deal multiple average has settled at 2.9, introducing a contrasting facet to the industry’s valuation landscape.
Telecommunications
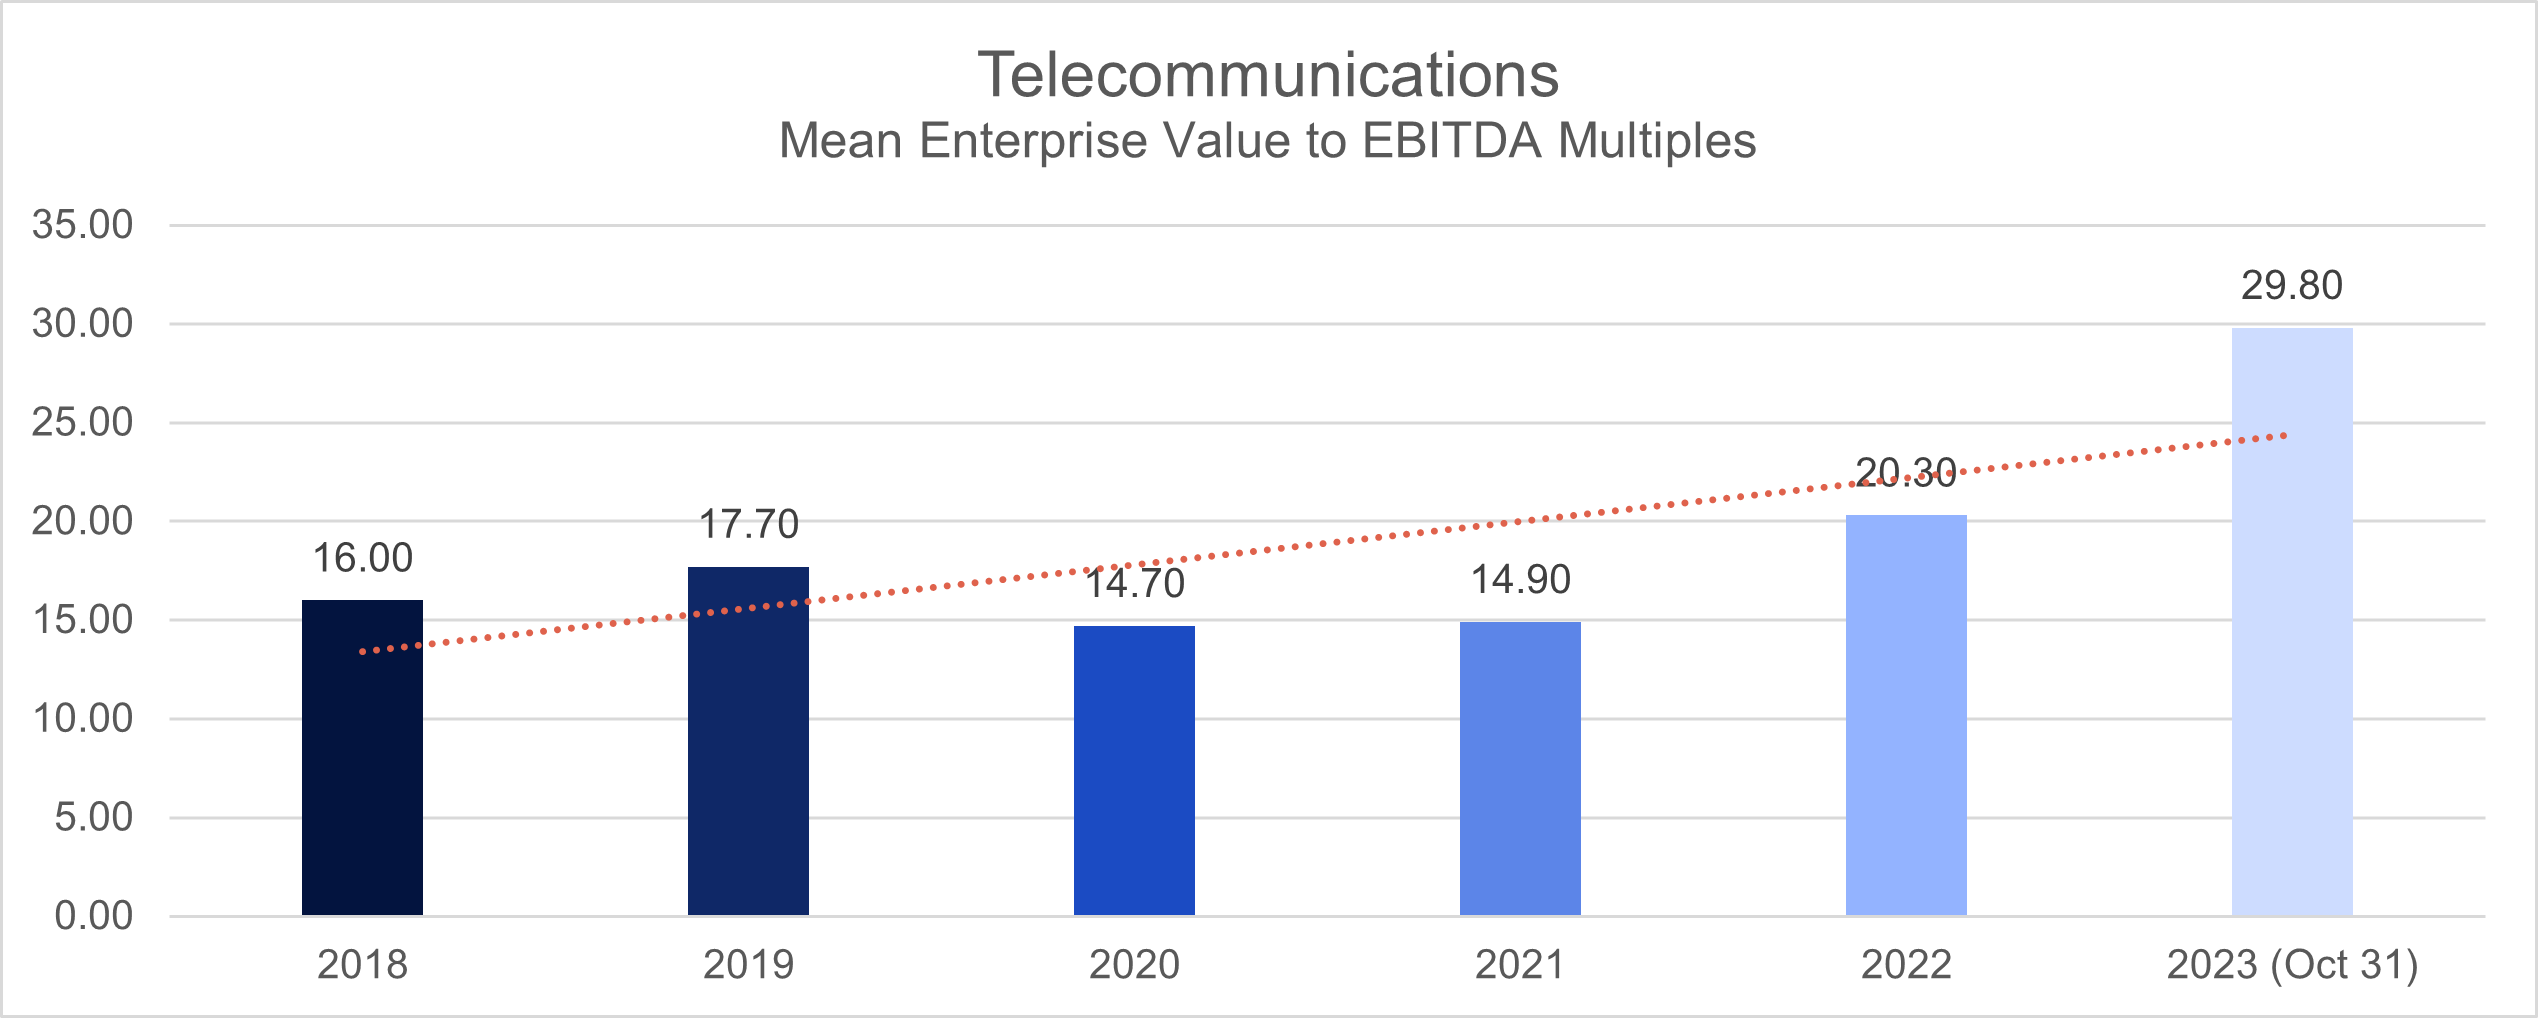
Between 2018 and 2019, the Telecommunications sector displayed varying deal multiples, registering averages of 16 and 17.7, respectively, as measured by the EV/EBITDA metric.
The onset of the pandemic in 2020 brought challenges, reflected in a decline in the mean deal multiples to a low of 14.7.
Despite these setbacks, the sector demonstrated resilience, rebounding in 2022 with a notable increase to an average of 20.3. Remarkably, as of October 2023, the upward trajectory continues, with the deal multiples reaching an elevated ratio of 29.8.
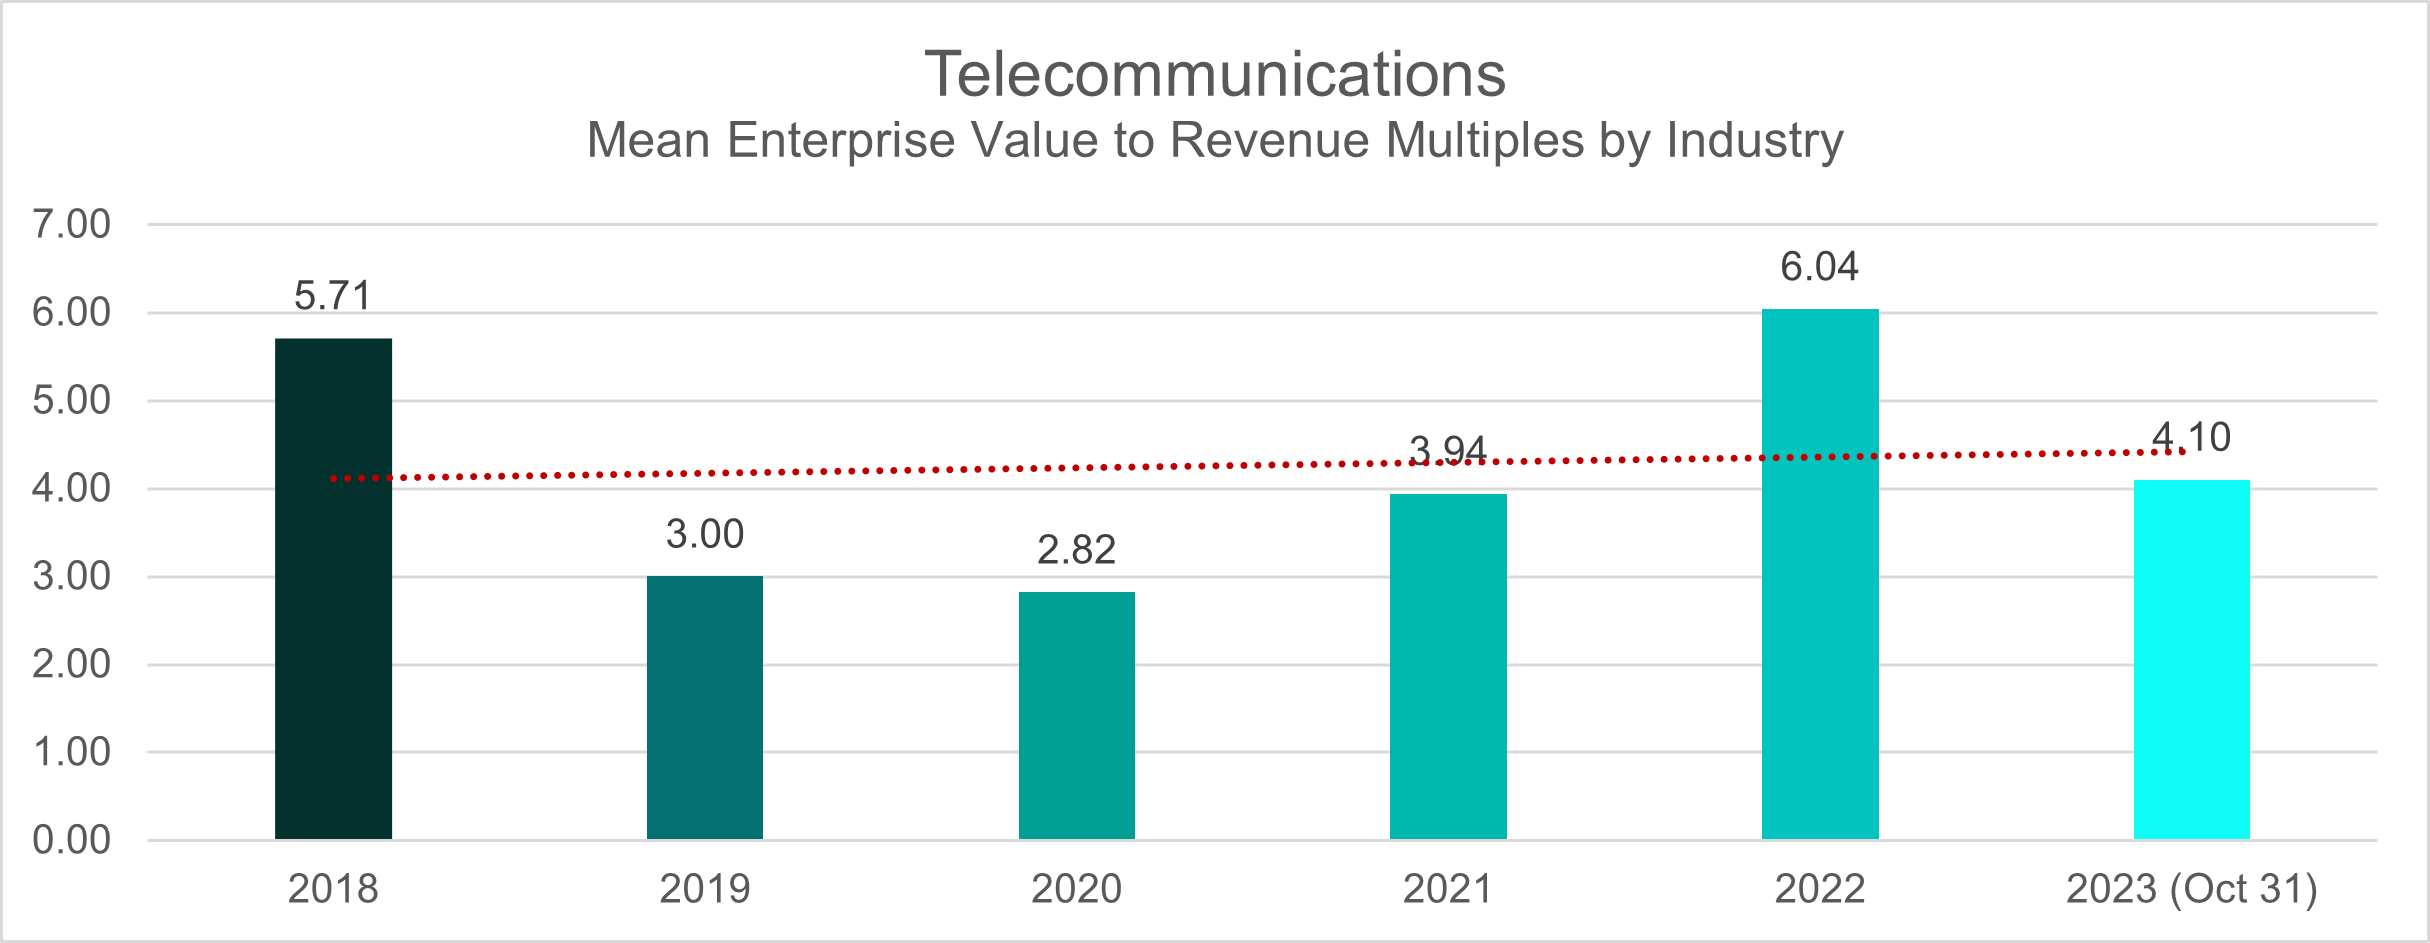
However, a different narrative emerges when assessing the sector using the EV/Revenue metric. In the pre-pandemic years, the deal multiple average stood at 5.7 in 2018, experiencing a dip to 3 in 2019. The downward trend persisted during the initial pandemic phase, with deal multiples further decreasing to 2.8. A modest recovery was witnessed in 2021, as the deal multiple average increased to 3.9.
The positive momentum carried into the post-pandemic period of 2022, with the mean deal multiple rising to 6.
Nevertheless, as of October 2023, the average deal multiple for the Telecommunications industry has settled at 4.1, reflecting a nuanced trajectory in comparison to the EV/EBITDA metric.
This blog is part of IMAA’s report on Thriving in Turbulence? M&A Valuations in the Age of High Interest Rates


Stay up to date with M&A news!
Subscribe to our newsletter
