
Publications Driving Value: 2015 Automotive M&A Insights
- Publications
Driving Value: 2015 Automotive M&A Insights
- Christopher Kummer
SHARE:
By Jeff Zaleskiand Christopher Becker– PricewaterhouseCoopers
Year in review
2015 – 365 days, 591 deals, $62.1 billion total aggregate disclosed value
Overview
Automotive M&A deal volume for 2015 was up 9 percent, further extending gains made in 2014. With 591 deals, the industry saw its highest volume of deals transacted since 2011.
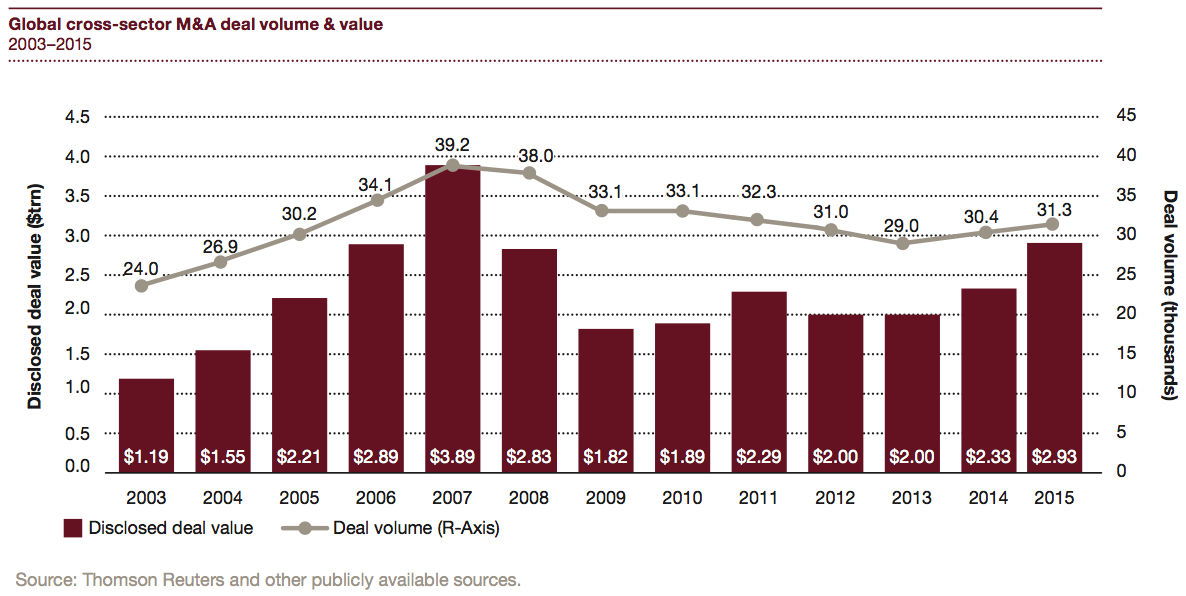
• Global market conditions across all industries are showing positive trends consistent with the automotive industry. Global cross-sector M&A deal value increased 26%, while deal volume remained mostly consistent, when compared to 2014. This increase in deal value is being driven by greater numbers of megadeals (deals greater than $1.0 billion).
• Technology and Regulation Drives Changes in Auto — In automotive, new technologies are dramatically changing vehicles, from the advent of the ‘connected car’ and enhanced driver support to better fuel efficiency and new or improved powertrains. Entirely new industries are being created to manage these breakthroughs and develop the processes to integrate new technologies into the automotive business model. As almost 200 nations agreed to reduce carbon emissions at the end of 2015, many automakers look to alternative energy solutions, due to anticipated stronger EPA regulations. In general, OEMs and suppliers alike will likely platforms while still catering to local / niche preferences.
• Mobility solutions are becoming a focus in automotive. As tradition, automotive vehicle manufacturers, suppliers, dealers and others try to capitalize on the changing consumer trends toward ride-sharing, car-sharing and autonomous vehicles.
• The drive for a more connected car leads to cyber security threats of vehicles. Hacking an automobile’s electronic system can cause serious danger, leaving automotive companies thinking of ways to protect consumer trust in automotive connectivity.
Deal volume: Global automotive deal volume is on-par with pre-recession levels, transacting 591 deals. In comparison to 2014, this represents a 9% increase.
Deal value: Global automotive deal value rose to 62.1 billion—a massive increase of 60% over 2014 and its highest level since 1999.
Deal size: Globally, average automotive deal size increased by a rousing 81%, primarily driven by megadeals.
Global automotive
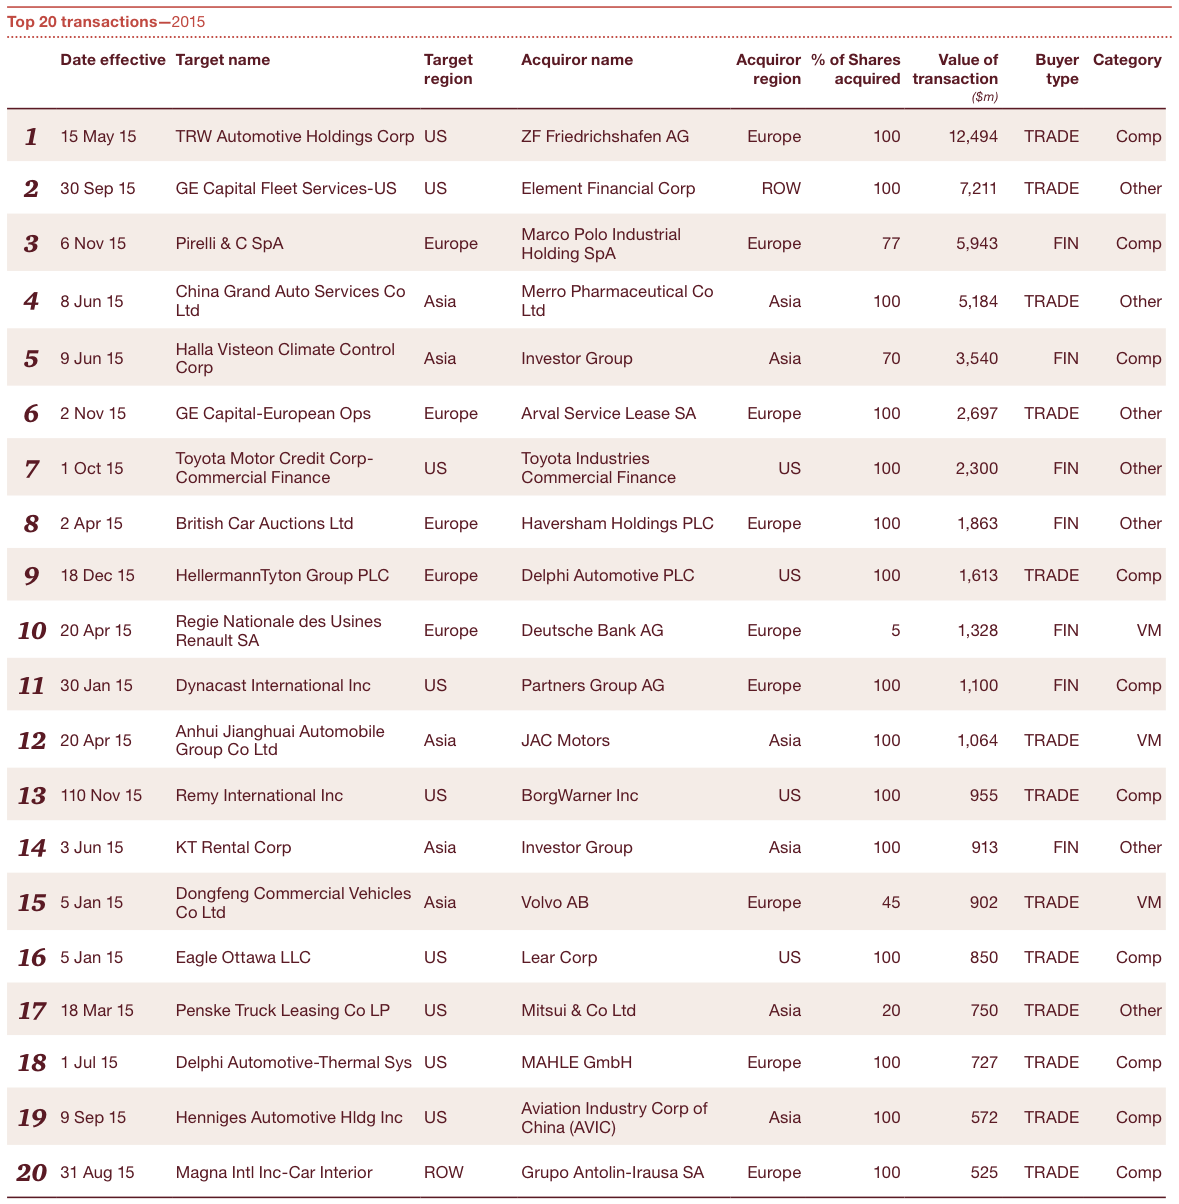
In many respects, the financial strength of the automotive industry is back. This is evidenced by deal value increasing by 60% in 2015 up to $62.1 billion, the highest value of deals in 16 years. Much of this increase in deal value is driven by 12 megadeals with a total aggregated disclosed value of $46.3 billion, the largest of which was ZF Friedrichshafen AG’s $12.5 billion acquisition of TRW Automotive Holdings Corp.
Average global auto deal size increased 81% from $214 million to $388 million. This also marks the highest average deal value in the past decade and almost 3 times its low in 2010.
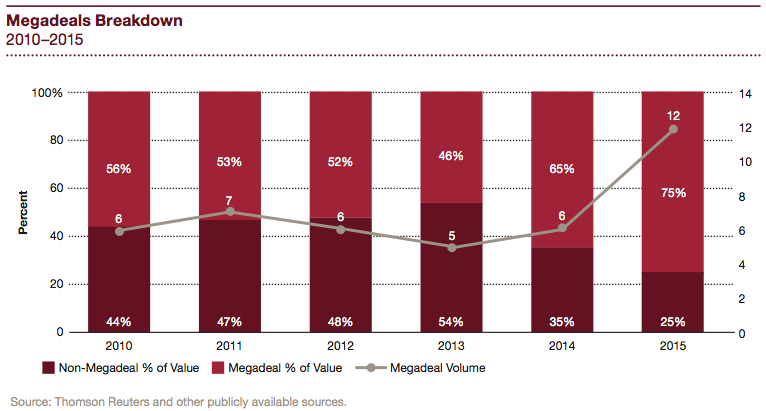
Further, of the 160 disclosed deals, the number of megadeals (value greater than $1.0 billion) increased from 6 to 12 in 2015 and 32 deals were between $100 million and $1.0 billion. Continuing the trend from 2014, larger megadeals have led to a significant increase in overall average deal value in 2015.
Megadeals in 2015 were double the amount in 2014 and account for 75% of overall deal value. 2015 saw the highest megadeal value and highest share of total deal value in the review period. The 12 megadeals in 2015 is the highest number of megadeals in the review period, excluding the US Treasury Facilitated Investments.
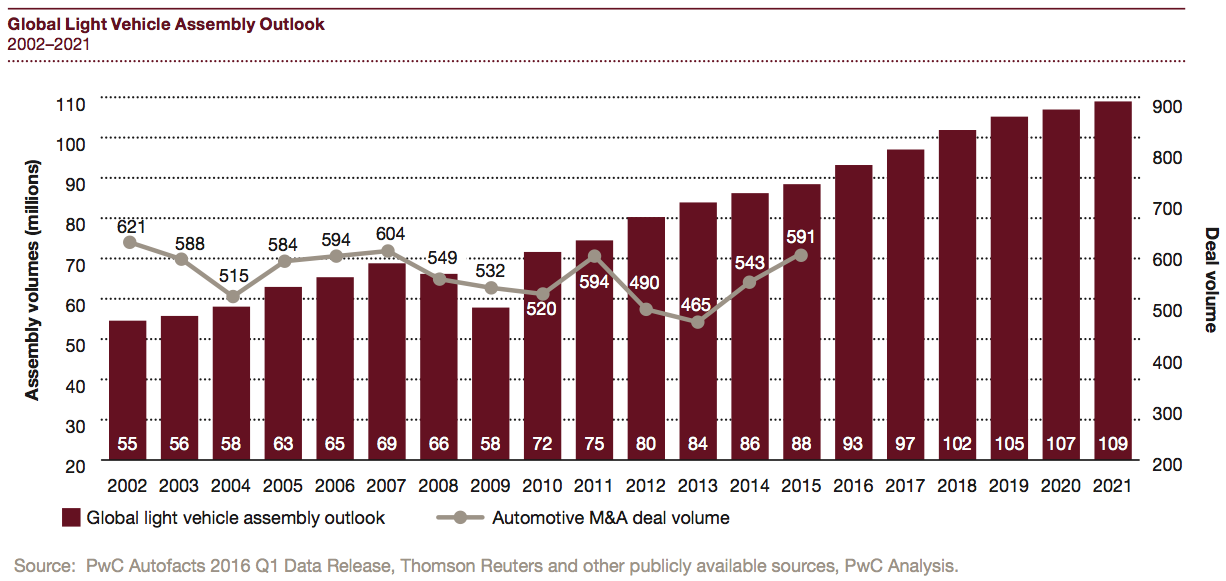
PwC’s Autofacts expects the industry to add 21 million units of production between 2015 and 2021, for a compounded annual growth rate (CAGR) of 4%. (PwC’s Autofacts 2016 Q1 Data Release) Along with record growth, there are unprecedented global challenges that are influencing business strategies and actions in many industries.

Cross-sector M&A
As evidenced in the chart below, recent global cross-sector M&A is trending upward, though not at the same rate as the automotive industry. In 2015, both deal volume and value increased by 3% and 26% respectively.
Top 20 deals
Automotive assembly
Reports show that long term outlooks for automotive assembly still are positive, however, recent setbacks in Brazil and Russia, along with slower growth in China, have caused volatility in the industry’s near term growth plans. The industry is expected to add 20.5 million units of production between 2015 and 2021 for a compounded annual growth rate (CAGR) of 3.6%.
According to PwC Autofacts, the highest growth opportunities are expected in areas outside of the traditional regional blocks – which means the automotive industry will have to stay mobile and agile enough to chase growth. Russia and Ukraine are still hindered by political and economic challenges, while North America and Europe continue to surpass sales expectations.
The European Union assembly of 18.0 million units in 2015 is up 7.3% year-over-year and the U.S. had new vehicle sales of 17,386,331 units, which was an all-time high.
The industry faced another multi-faceted hurdle as oil prices continued to plummet from 2014 levels. While the full impact of lower oil and gas prices may be difficult to quantify, consumer confidence may improve sales most likely in the United States and in some developing markets, such as India and China. In the U.S., this increase hasn’t materialized yet as widespread layoffs and spending cuts by oil drillers have offset some of the boost. Perhaps the greatest impact of lower oil and gas prices will be on the types of vehicles being purchased. Automakers, who have been concentrating on producing lower emission vehicles, may need to adjust production plans as lower gas prices tend to increase demand for larger vehicles. Other considerations to factor in the big picture focus on collapsing revenues that could lead to political instability in fragile parts of the world including the Middle East. Cheap oil can hurt investments in exploring new areas such as the arctic and West Africa. As oil prices fall against areas of a fragile world economy, it could trigger additional volatility.
Insights into regions
The big picture
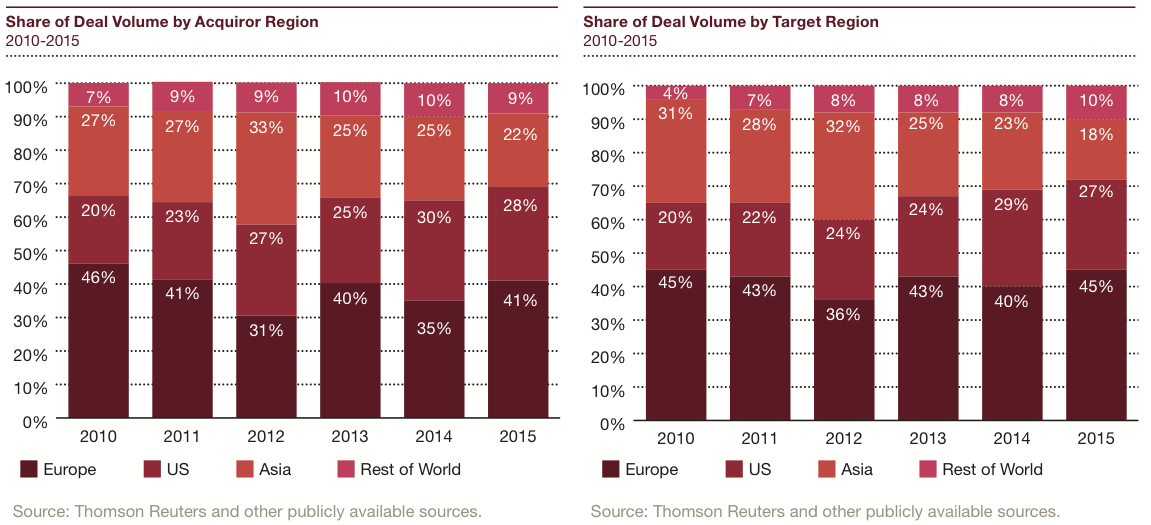
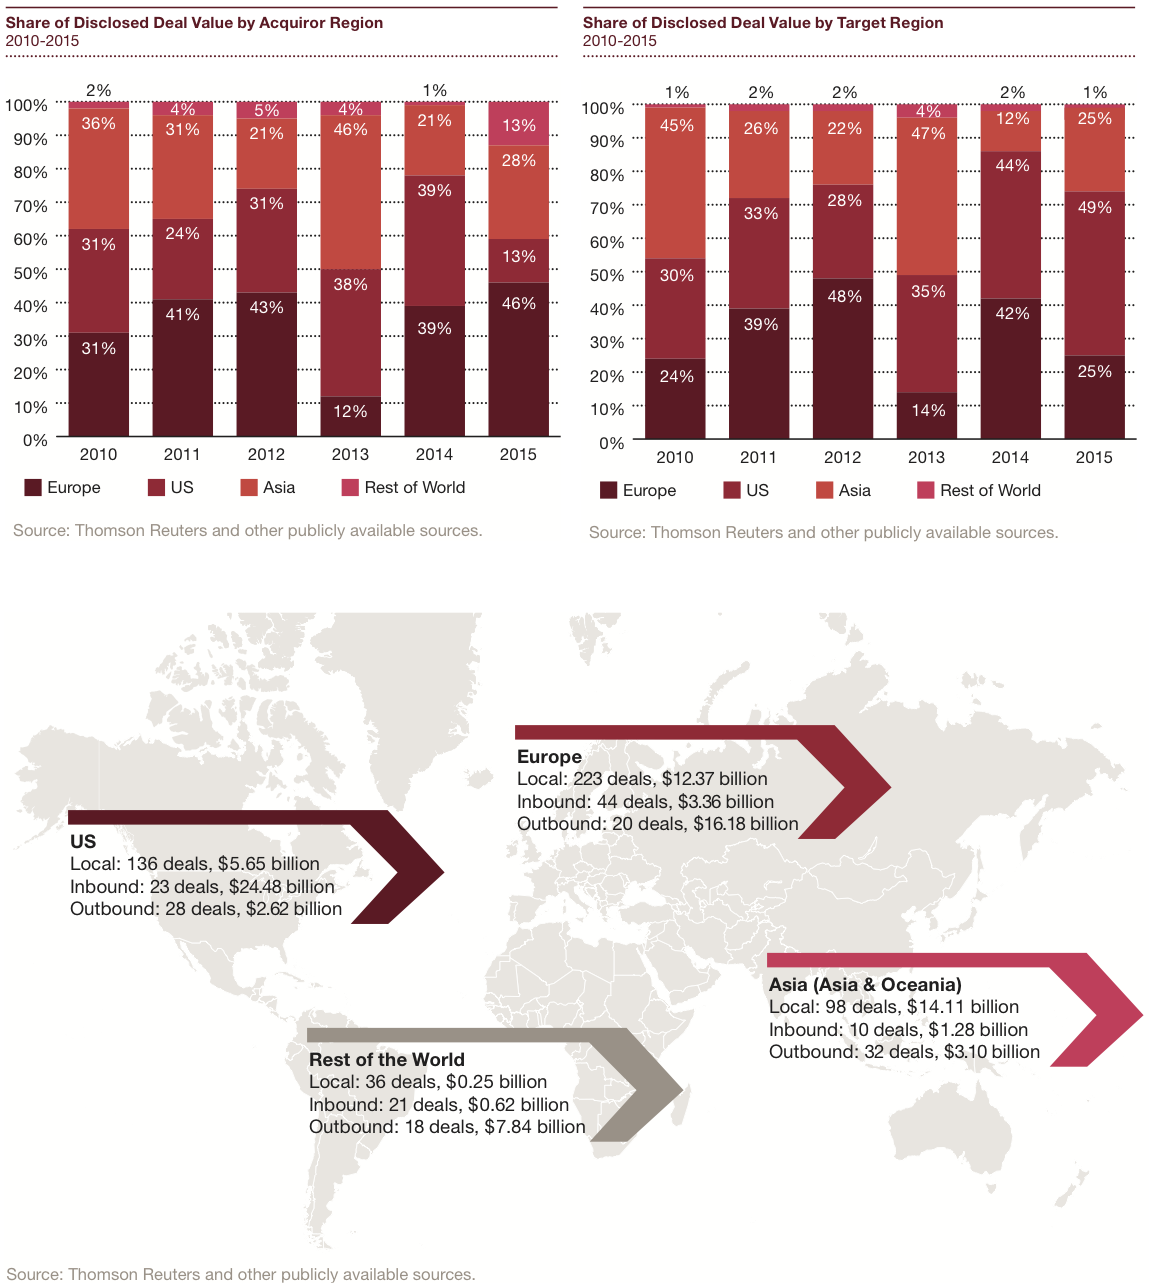
Across all regions, local deals dominated the M&A activity with 83% of all deal volume consisting of local deals. However, the two largest deals of the year, as well as four of the twelve megadeals, were cross-border. This led to a significant increase in cross-border deal value from the previous year (up to $29.7 in 2015).
North America
In 2015, North America led the M&A market again in share of deal value by target region at 49%. However, share of disclosed deal value by acquirer plummeted down to 13%. Deal volume by target region remained stable at 159 in 2015, although disclosed deal value by target region jumped 77%. These results highlight a year where M&A activity remained very strong in the United States, but large megadeals by acquirer in other regions stole the show. It appears other regions are looking to North America to seize strategic and growth opportunities.
Europe
Europe’s share of deal volume by acquirer and target region marginally increased in 2015, helping Europe maintain its position as the most active region for M&A activity. On the other hand, Europe experienced a major drop in its share of deal value by target region, due to the two largest megadeals that occurred having targets outside Europe.
Share of deal value by acquirer region increased from 39% to 46%, the highest share of all regions. This is indicative of European based companies continuing the trend of investing more in M&A that began to emerge in 2014.
Asia
Asia’s share of deal volume by both acquirer and target region showed marginal declines in 2015 to 22% and 18%, respectively. However, the region saw a significant increase in its share of deal value by both acquirer and target as two of the top five deals involved Asian companies. Overall, Asian based companies have shown consistency in their M&A trend by acquirer volume, but in 2015, companies have taken the next step by being involved in much larger deals.
Analyzing industry segments
The big picture
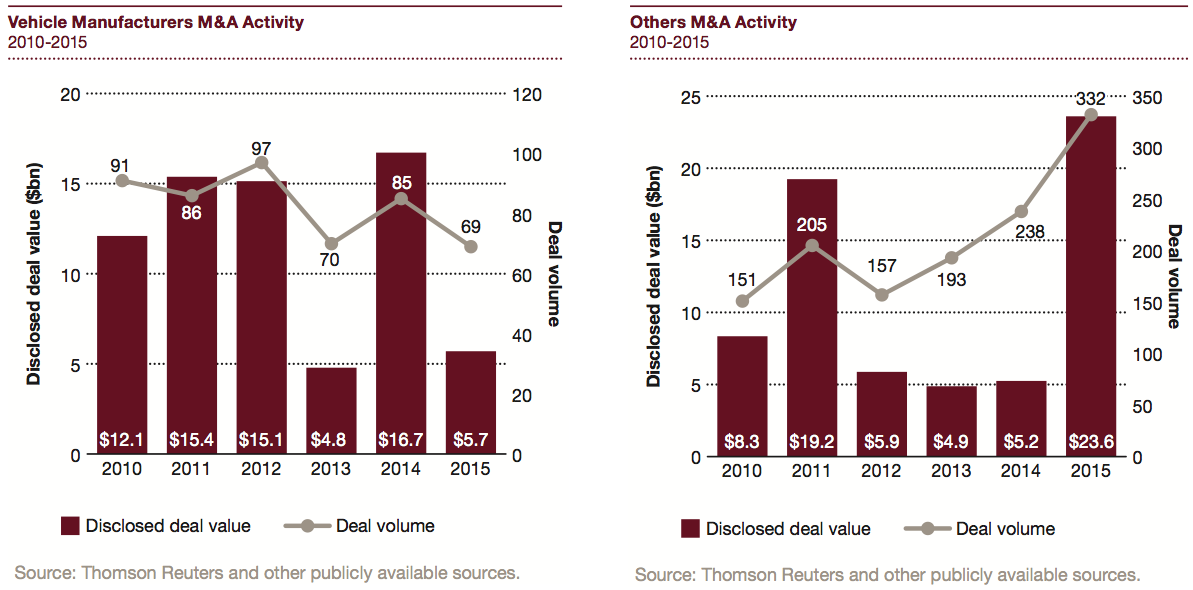
Deal value accelerated in 2015 compared to the same timeframe in 2014—driven primarily by Component Suppliers and Others category.
Vehicle Manufacturers
Vehicle Manufacturers returned to 2013 levels showing a 66% decrease in deal value, when compared to 2014. There were 2 megadeals in 2014 with a total aggregated disclosed value of $12.7 billion, which is the leading contributor to deal value decline in 2015.
Components Suppliers
Components Suppliers saw deal volume declines from 220 deals in 2014 to 190 deals in 2015, representing a decrease of 14%.
However, deal value drove increases of $16.1 billion from 2014 – an increase of 96%. These upturns were mainly fueled by megadeals from ZF Friedrichshafen AG’s acquisition of TRW Automotive Holdings and Marco Polo Industrial’s acquisition of Pirelli.
Others
After significant declines during the peak of the recession, the Others category—including retail/dealership, aftermarket, rental/leasing, financing and wholesale — has experienced 3 consecutive years of increase in deal volume. The segment transacted 332 deals in 2015, representing a 40% increase from 2014 for a deal value of $23.6 billion representing an increase of 349% from 2014.
The Others category had a stellar year with the highest number of deals and highest value since 2006. 68 of 332 deals in 2015 are related to repair and maintenance businesses, on top of 60 of 238 deals in 2014.

Who’s buying: Financial versus Trade Buyers
The big picture
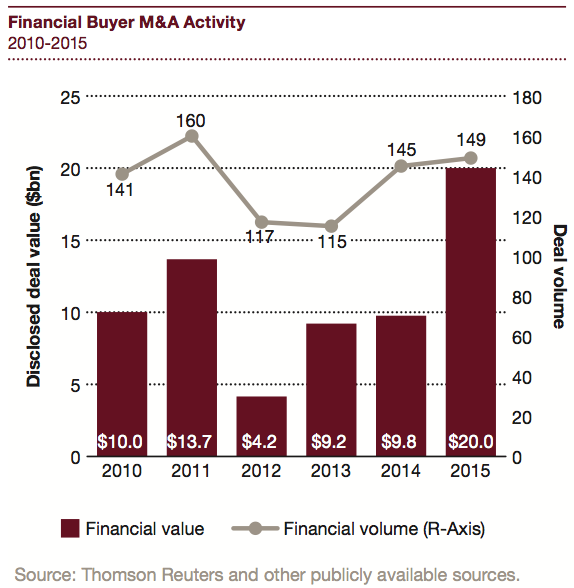
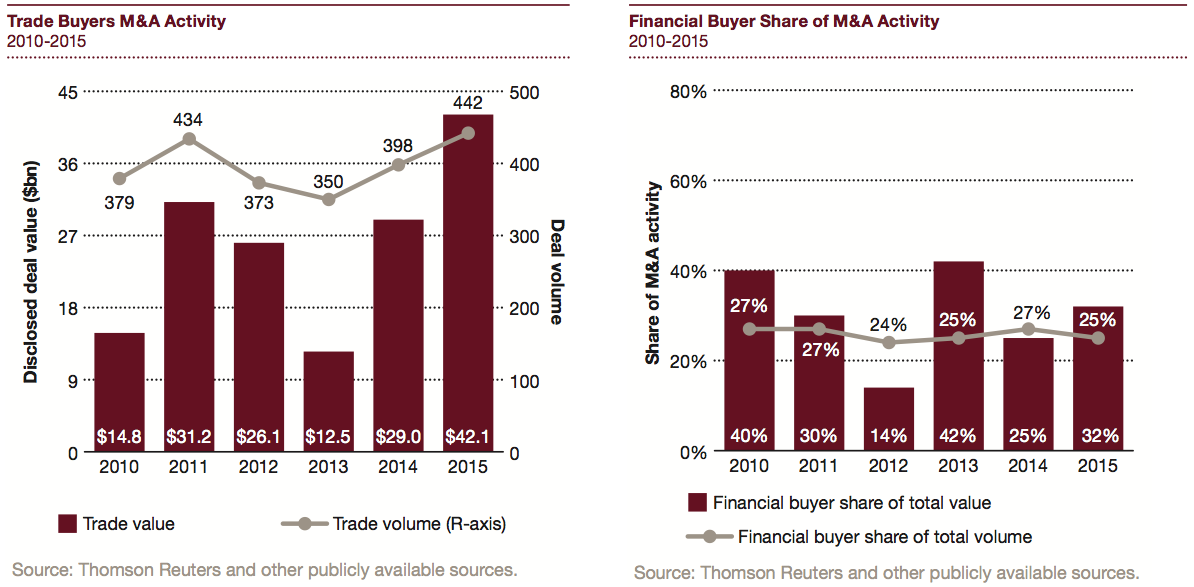
Both Financial and Trade buyers saw increases in deal volume and deal value in 2015, but Financial buyers more than doubled-down on the industry with a 105% increase in deal value.
Financial buyers—Green light, red light
Financial buyers saw increases in both deal value and deal volume in 2015. Financial volume increased by 3%, and with 149 deals, represents the most deals for financial buyers in 4 years.
Deal value trends out-paced volume in 2015 with an increase of 105%, when compared to 2014, primarily driven by six megadeals with an aggregate disclosed value of $16.1 billion.
Trade buyers—green lights ahead
2015 brought monumental values of initiated deals for Trade buyers, building on 2014’s stellar performance. This increase was significantly driven by six megadeals with an aggregated disclosed value of $30.3 billion.
This year proved to be record-breaking as deal volume is on par with pre-recession 2008 levels and value surpassing the previous record holder, 2007, by 32%.
The road ahead
A positive outlook for Automotive M&A
While the industry as a whole has faced challenging times over the past several years, the markets have pulled themselves out of the worst global economic downturn in recent history and are trending to surpass the peaks of the automotive industry in 2007 and 2008.
Given the robust Automotive Assembly outlook, PwC expects the M&A markets to continue to stay strong as companies continue to use M&A to drive efficiencies, grow market share, and expand their geographic footprint.
As regulations around safety and fuel economy change, we see M&A playing an increasingly vital role in the development and integration of new technologies into vehicles. Shifting consumer preferences toward a sharing economy are driving increased investments in electronics and alternative forms of mobility. Automotive is quickly becoming the largest consumer electronic and a new mobility industry is emerging. As a result, we expect increased investments in this new sharing economy as well as in electronics and mobility services.
Joint ventures and strategic alliances will ramp up, especially related to cross-border transactions, as traditional vehicle manufacturers and suppliers look to invest in mobility while managing risk. Megadeal activity will likely continue as trade buyers continue to maintain high levels of cash and PE funds have significant funds available. Within the U.S., shareholder activism is the new norm.
A plateau for the automotive industry?
As the automotive M&A activity returns to 2007 & 2008 levels, some experts wonder if the industry can continue to grow, before running into a cyclical downturn. Several automotive manufacturers experienced record sales, particular in the U.S. during 2015, begging the question of how often records can be broken.
The next few years will be a crucial for automotive companies to understand and predict the market trends in order to avoid inventory build-up and other issues faced in 2007 & 2008.
It is more important now than ever before for automotive companies to be agile and responsive to consumer demands for technology and other features. Automotive companies have invested in lower-emission cars as well as leveraging technology to create more of an “ultimate connected car”. These tech-boosted vehicles may help decrease cyclical downturns as consumers with higher disposable income become interested and buying habits change.
More elbow-grease needed for autonomous cars
Experts predict that the automotive industry will change more in the next few years, than any other time in the industry. As automotive companies plan their moves regarding new technologies around connected and autonomous vehicles, business models across the industry will likely evolve over the next several years.
TAGS:


Stay up to date with M&A news!
Subscribe to our newsletter
