
Publications Biotechnology Report 2016: Beyond Borders – Returning To Earth
- Publications
Biotechnology Report 2016: Beyond Borders – Returning To Earth
- Christopher Kummer

SHARE:
The year in review
Biotech grows up: key themes for 2016
1. Capital: the view from the top?
In 2016, the biopharma world is on somewhat unfamiliar footing. After five years of market cap gains and increasingly buoyant capital markets, biotech’s fortunes peaked in 2015. The biotech industry’s cumulative market cap has dropped precipitously over the past nine months. As this year’s Beyond borders report describes, although new records were set in cumulative revenue, net income and R&D spend, growth rates in all three categories have slowed.
Signs of a financing slowdown have also been evident. After three years of strength, the IPO market has weakened significantly, although it hasn’t entirely evaporated. Follow-on financing and debt decreased even more markedly toward the end of 2015 and into 2016.
After years of increasing intensity, dealmaking activity has begun to level off as well; this deceleration appears more pronounced only because it follows record-breaking years for M&A and licensing. (See the chapter “Biotech financials return to earth in 2015”.)
But there are silver linings. After a record year for biotech exits, venture capital investment in the sector appears to be maintaining momentum. Strategic investors, more of which emerged during the previous downturn to fill gaps in early-stage capital, remain committed to the sector and are fundamental to its success. The market’s largesse over the past few years means that biotechs largely remain in good financial health. And falling valuations for public biotechs should tempt mature biopharma buyers, with pipeline and revenue gaps to fill.
2. Demonstrating value
The rising power of increasingly consolidated payers is one reason for slowing revenue growth. As cash-strapped health systems in Europe and the US try to make room in their budgets for higher priced specialty products, cost containment efforts continue apace. Meanwhile, biopharmaceutical companies struggle to make value-based arguments for their medicines. Fear that they will ultimately fail to do so has contributed to ebbing investor sentiment toward the sector.
In the US, election year rhetoric and the rare, but egregious, pricing practices spotlighted by congressional committees have added plenty of heat but little light to the value discussion. Meanwhile, industry players are continuing to increase prices to offset rebates necessary to secure preferred formulary positions. Limited transparency in pharma-payer contracts makes it hard to assess the drugs’ real costs and hence whether payers are ascribing more value to them.
In Europe, drug price control tactics such as reference pricing and the heterogeneous decision-making of national health technology assessors already make life difficult for the biopharma industry. But efforts at bringing greater transparency to these processes may result in even greater downward pressure on drug prices.
As access to medicines becomes an increasingly important global issue, biopharma companies must more effectively demonstrate and communicate the value of their products to insurers, governments and the public. Industry’s poor track record in this regard, especially in the US, where payer pushback has until recently been relatively mild, suggests it has much work to do.
And time is of the essence. Traditional generics and biosimilars now represent “good enough” innovations that are priced to meet stakeholders’ value threshold. In the US, the FDA has approved biosimilars to three blockbuster biologics as of May 2016, and more wait in the wings. In addition, a growing array of third parties is eager to assist payers and providers via independent product value assessments. (See Roger Longman’s perspective, “The myth of “the payer.””)
3. New payment models
Via partnerships or experimental pilots, biopharma companies and the health care ecosystem are grappling with new payment models. Outcomes-based payments remain a topic of fierce discussion, but even in Europe, where they have a longer history than in the US, these pay-for-performance approaches have a checkered history. Hurdles to implementation, including agreeing on the outcomes to be measured and building data collection and analytics capabilities, have limited broad adoption. As a result, most biopharmas deploy value- based pricing collaborations defensively, as a hedge when reimbursement is delayed. (See Michael Sherman’s perspective, “It’s time for biopharma to embrace risk-sharing.”)
Closely watched launches of drugs for heart failure and high cholesterol have been slow due in part to growing pains around shared-risk models. Industry has been reluctant to embrace indication-specific pricing or bundled price initiatives, but more of those pilots are coming too. In 2016, Express Scripts launched an indication-specific pricing program for oncology therapies. Medicare has proposed testing both such models as part of a larger initiative designed to reduce physician incentives to prescribe more expensive doctor-administered drugs.
To gain market access in Europe, it’s often necessary to reach a so-called managed access agreement with local health technology assessors. BioMarin’s deal with the UK’s National Institute for Health and Clinical Excellence (NICE) in late 2015, for example, will see the biotech’s Vimizim Morquio A therapy reimbursed for up to five years, but at an undisclosed “patient access price” fixed lower than the company originally requested. During that time, further evidence will be collected to support the drug’s benefits.
The biopharma industry must also prepare the marketplace for the curative therapies to come. New modalities such as gene and cell therapy may require annuity-style payment models. Higher priced combination therapy regimens in areas such as oncology will save more lives even as they invite greater scrutiny.
4. The “cures” are coming
Better understanding of disease biology and increasingly powerful discovery technologies have increased R&D productivity and propelled biopharma innovation in recent years. Biotech companies are harnessing the immune system to destroy cancers, replacing or editing genes to thwart rare diseases, and harvesting the results of decades of “omics” efforts. Industry’s progress has inspired greater investment and given rise to multiple “moonshots.”
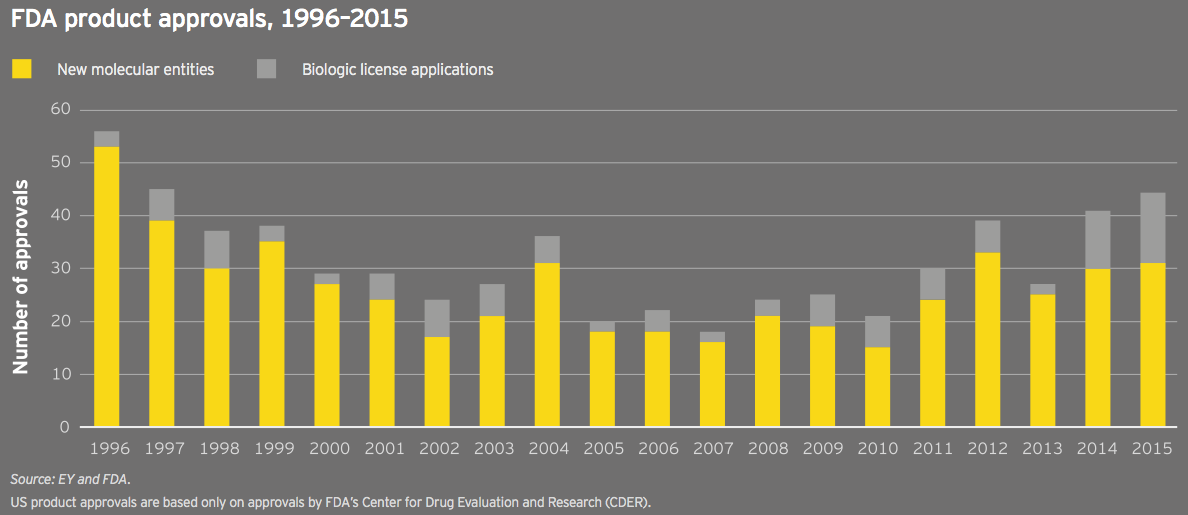
2015 was the second consecutive year the FDA approved more than 40 new drugs; 22 of those were approved with orphan drug designation, a second consecutive record. The past few years’ regulatory successes have been facilitated by tailwinds such as the FDA’s breakthrough designation and efforts to boost development in neglected disease areas. Nearly 50 breakthrough-designated drugs have been approved since the pathway’s creation in 2012. These approvals can be viewed in part as a victory for good policy, for more narrowly defined diseases and for more savvy development strategies.
But they’re also the result of biopharma companies’ massive investments in biological research and big science. R&D investment, especially by the biotech industry’s hundreds of pre- commercial companies, has surged in recent years. That science is increasingly supported by large early-stage rounds of venture capital to allow even nascent companies to tackle biology’s biggest ideas: diseases of aging, neurodegeneration and cancer vaccines, to name a few key areas of research. (See “Bountiful harvest leaves biotech well prepared for winter.”)
5. The maturation of biotech
Biotech companies in 2014 and 2015 set records for revenue, net income and market capitalization. The industry’s largest players are now competing with traditional pharma buyers for M&A and alliance deals more effectively than ever before. Thanks to a record financing environment, the sector remains cash-rich and equipped to innovate despite the recent downturn in the capital markets.
Of course, with maturity comes challenges: mature, commercial-stage biotechs are now facing the same capital allocation questions and growth conundrums as their traditional pharma peers. They risk disruption, both from smaller biotechs with cutting-edge technologies and technology players that see opportunities in managing the flow of health data. (See Francoise Simon’s perspective, “Winning in the new digital landscape.”)
As companies aim to do a better job of demonstrating product value, the entire biopharma industry is lurching its way toward more focused business models. To compete commercially and reignite growth, the thinking goes, companies must be the dominant players in fewer therapeutic strongholds, occupying the top echelon of their chosen markets. This win-or-go-home mentality will continue to drive industry’s M&A and divestiture agenda, particularly as companies and their investors realize certain assets may have more value out on their own or inside a competitor’s portfolio. The trick remains knowing when to jettison assets to maximize value.
It’s time for biopharma to embrace risk sharing
It’s broadly recognized that the US is shifting from a fee-for-service reimbursement model to one based on health outcomes. This change affects both physician and biopharmaceutical product reimbursement.
On the physician side, the shift to outcomes-based reimbursement has happened faster than many realize. At Harvard Pilgrim, for instance, 85% of the doctors in our network are already reimbursed based on “at risk” arrangements that, at least partially, link payment to patient outcomes.
The specific payment model adopted depends on the provider group and its willingness to take on financial risk. Some groups are interested in capitation models in which they bear full financial risk; others prefer shared-savings models that reward physicians for reducing the total cost of patient care. Offering different options has been critical to our ability to reward physicians for delivering improved outcomes. This has proven to be a far better approach than trying to force-fit physician groups into a one-size-fits-all model that requires them to take on more risk than they are ready to own.
In contrast to physician reimbursement, biopharma product reimbursement is not nearly as advanced. As an ecosystem, we primarily still pay for pills, not better health solutions. The good news is that more biopharma companies are interested in finding opportunities to align with payers around outcomes. The bad news is that most drugmakers still view risk sharing as a defensive strategy, reserved for competitive indications where traditional market access methods have failed. Instead, drug companies need to view the changing payment paradigm as an opportunity that enables greater patient access to their products.
Moving from fee-for-service to fee-for-value is not easy. It requires a spirit of trust. Historically, payer-pharma contracting has been viewed as a win-lose transaction. Insurers and pharmacy benefits managers want to pay less for drugs; manufacturers want us to pay more. But if we look at payer-provider collaborations as a proxy, our relationship with drugmakers doesn’t have to be adversarial. I believe payers and pharma can work together to eliminate unnecessary portions of the care delivery pathway and create a framework that is mutually beneficial. Moreover, the drugmakers that embrace novel payment models now will have an important first-mover advantage as paying for outcomes becomes institutionalized across the country.
Creating a model for the future
Our recent partnership with Amgen around the PCSK9 inhibitor Repatha, a new biologic that lowers cholesterol, is a good example of how payers and drug companies can find common ground. In exchange for a price rebate, we restricted access to a competing product, making Amgen’s drug the preferred product for our members. In addition, Amgen has agreed to offer price protections based on real-world evidence: if treatment with Repatha doesn’t result in the same cholesterol lowering shown in its clinical trial, Amgen will owe us an additional rebate.
My hope is that other pharma companies will look at our collaboration with Amgen and be more open to similar risk- sharing arrangements. It’s true that cholesterol is an easy metric to track via claims data. It’s a little more complicated to track cost offsets linked to the avoidance of hospital admissions or other services. But if the up-front drug cost is sufficiently high, I’m willing to dedicate internal resources to manually collect the data to determine if the success criteria have been met.
What I want to emphasize is that risk sharing with pharma shouldn’t be viewed as an all or none approach. As has been true on the provider side, it is reasonable to expect that we will need to deploy a range of payment models.
In the future, we’ll be able to create even more sophisticated risk-sharing arrangements based on prescription adherence or other patient data. But for now, even straightforward arrangements, such as our partnership with Amgen, aren’t trivial to set up. Not only do both parties have to agree on the outcome to be measured, but they must also have the necessary data collection and analytic capabilities. In some cases, that may require additional investment.
Still, we can’t let the perfect be the enemy of the good. As with any other initiative, risk sharing with pharma will only gain traction if there are some wins. That means taking small steps with the right partners. On the payer side, a number of us have embraced the concept and want to partner with counterparts in pharma. The question remains, which drug companies are proactively willing to partner with us?
The drugmakers that embrace novel payment models now will have an important first-mover advantage as paying for outcomes becomes institutionalized across the country.
(Michael Sherman, Chief Medical Officer, Harvard Pilgrim Health Care)
The myth of “the payer”
Biopharmas now routinely talk about “the payer.” But as the failures of recent, theoretically “payer friendly” launches make clear, there are many different kinds of payers, with very different incentives and very different buying criteria.
In the last two years, it’s been the rare drug that has achieved an unequivocally successful launch — despite often unarguable value. Novartis’s heart failure drug Entresto, Merck’s Hepatitis C drug Zepatier, and the radically LDL-lowering PCSK9 inhibitors produced by Amgen and the Regeneron/Sanofi partnership have all underperformed their owners’ expectations, not to mention Wall Street’s.
In certain cases, the drugs simply haven’t appealed much to physicians. But the real roadblock has been payers. There is no need to rehearse their growing power: we’ve witnessed the increases in formulary exclusions, the expanding rebates, and the ever-stricter requirements a patient needs to meet before he or she can get a new drug prescribed, let alone reimbursed.
So, absent some governmental deus ex machina mandating payers cover these new drugs, or the equally fond hope that complaining loudly enough about payers will shame them into generosity, most people in the pharma world have realized that drug companies need to show they can meet the needs of payers, not just patients.
That means doing some, or all, of the following: proving lower costs; providing real-world evidence; conducting head-to-head trials; and offering pay-for-performance contracts.
These are all good ideas. Or good ideas sometimes, as compellingly noted by Ernst & Young LLP’s Ellen Licking and Susan Garfield in a recent IN VIVO article. They argue that not all drugs fill the bill, for example, for outcomes-based contracting.
But it’s also true that even a drug that does fill the bill doesn’t fill the bill for all payers. That’s because different kinds of payers have different economic incentives.
We all recognize that payers are increasingly the new powerbrokers. Now it’s time to understand that these powerbrokers don’t all make their decisions the same way.
Needed now: payer segmentation strategies
In the United States, a Medicare Prescription Drug Plan (PDP) operates under different financial assumptions than a commercial plan that’s fully at risk. Though both businesses may be owned by the same insurer, the former has no incentive to save on nondrug medical costs and every incentive to use the cheapest drug available. The latter might be willing to use a more expensive drug if it can save money related to other medical expenses, making arguments around medical cost offsets more attractive.
Meanwhile, pharmacy benefit managers can often make more money on an expensive drug than a cheaper one, through rebates and specialty pharmacy charges. Sometimes, so can a commercial administrative services only (ASO) plan — one that passes drug and, usually, other medical costs on directly to the sponsor-client. On the other hand, a Medicaid plan, or most individual exchange plans, can’t; these plans need additional reasons to justify the widespread use of a costlier drug.
Take Entresto. If ever a drug seemed a no-brainer for “the payer,” this is it. It’s been proven to reduce cardiovascular events, and thus one big cost driver. The Institute for Clinical and Economic Review (ICER), a US-focused cost-effectiveness watchdog, rarely finds a drug that it believes is appropriately priced. But ICER actually thinks Entresto delivers value for money, more or less at its list price. And Novartis has obligingly offered up outcomes-based reimbursement: if Entresto doesn’t reduce cardiovascular events, its effective price drops.
What’s not to like?
Problem is, many — probably most — of the likely Entresto patients are in Medicare, and most of those in PDPs. And PDPs don’t benefit from reductions in nondrug costs. Indeed, PDPs don’t want heart failure patients, who tend to bring with them lots of co-morbidities and thus higher drug expenditures, reducing profit for these kinds of payers. So making it easy for their beneficiaries to get Entresto only encourages enrollment from the kinds of patients they don’t want. Is it therefore any wonder that pharmacy departments at many of these PDPs are making it hard to prescribe Entresto and, thus, that Novartis has struggled to sell a drug otherwise perfect for this specific patient population?
With the rise of value frameworks such as ICER’s Evidence Reports or Real Endpoints’ RxScorecard, and CMS’s proposal to actually use value frameworks in its Part B pilot, pharmas are increasingly aware that they need to understand how these frameworks assess their products and product candidates, so they know how their customers will view them and can take steps to improve their data profiles.
But they’ll also need to do something else: assess the value of their drugs not from the point of view of a mythical, unitary insurer but by the often very different perspectives of the managers who run the different lines of that payer’s businesses.
Smart payer segmentation strategies, in short, will soon be as important to successful biopharmas as smart physician and patient segmentation. We all recognize that payers are increasingly the new powerbrokers. Now it’s time to understand that these powerbrokers don’t all make their decisions the same way.
Real Endpoints is a healthcare information company that defines and forecasts the relative value to payers of existing and pipeline therapies and their likely budget impact.
(Roger Longman, Chief Executive Officer, Real Endpoints)
Winning in the new digital landscape
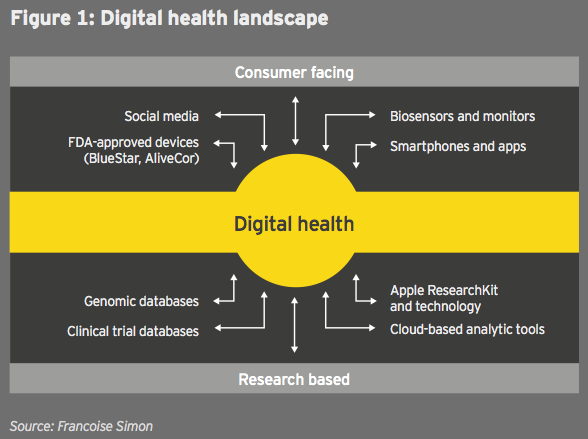
In the past few years, information technology companies have rapidly entered the health space in a new convergence that presents both an opportunity and a potential threat for biopharma firms. (See figure 1.)
From mobile devices such as the Fitbit biosensor to R&D data analytics tools such as IBM Watson Health, infotechs are playing a key role for consumers and researchers:
• In R&D, digital tools can optimize development of targeted therapies, speed up clinical trial enrollment and streamline data analytics.
• At the commercial end, these tools may allow deep integration of the customer voice, from product co-creation to post-launch communications, and they can help collect real-world evidence to prove value.
Infotechs are entering health care with different strategies that reflect core strengths. For example:
Apple: building a consumer ecosystem
Apple retains in health care its core strategy: focus on a limited number of products, target the high end of the market and keep building brand equity. Following its HealthKit partnership with the Mayo Clinic, Apple’s ResearchKit helps gather continuous patient data, from diabetes to dermatology, and the Apple Watch apps aim to track medication adherence and side effects for several conditions. Together, these tools create a continuous learning environment linking individual data to health systems to optimize prevention as well as outcomes.
IBM: from hardware to cloud services
IBM has evolved from a horizontal technology company to one delivering vertical solutions, supported by extensive acquisitions, including Explorys, Phytel, Merge Healthcare and Truven, and partnerships, such as an alliance with Medtronic in diabetes. Watson Health may provide B to B to C solutions, aggregating clinical, claim and journal data for researchers and combining them with individual genomic data to support precision medicine. For instance:
• At the point of care, it may facilitate evidence-based medicine for providers.
• For consumers, it may enhance physical activity and adherence by directly connecting electronic health records (EHRs) and R&D centers via cloud-based services.
Alphabet: expanding a health care portfolio
Alphabet, meanwhile, has built a large life sciences portfolio, expanding its Google search capabilities with Verily and Calico Life Sciences. It has partnered with the Mayo Clinic to provide curated health information via its search business. While Calico is focused on longevity, Verily has several diabetes alliances, including one with Novartis/Alcon to develop a contact lens tracking glucose levels in tears, and others with Sanofi (new diabetes management tools), the Joslin Diabetes Center and Dexcom.
In addition to longevity and diabetes, Alphabet investments span many areas. Google Ventures has invested in Flatiron Health (oncology analytics), Editas Medicine (genome editing), Alector and Denali (neurodegenerative disease), and Google Capital’s investments include Oscar Health Insurance.
The scale and scope of these investments do not obscure the fact that infotechs are unlikely to become direct health care players, with the exception of certain of Alphabet’s efforts, such as Calico.
Digital siloes
Silicon Valley business models differ profoundly from those of biopharmas; for instance, there is a greater tolerance for risk, and a culture that emphasizes rapid cycle times and product iterations. The role of infotechs in health care is still unclear. Will they enable life sciences research and communications? Or will they disrupt these activities by creating digital interventions that are more effective than some drug therapies?
Another issue is the evolution of digital health. Since the launch of the first wearables, digital solutions have remained siloed, from fitness apps to hybrid medical devices and data analytics tools. (See figure 2.)
The ultimate objective of digital technology — providing seamless care to patients from research to the clinic — remains elusive. Apart from clinical trials, there is no interoperability in the real world between consumer apps, physician offices and EHRs. Key barriers persist:
• For consumers, most apps still have limited functionality; as medical uses are developed, privacy and security concerns will be more salient.
• For physicians, reimbursement, the lack of infrastructure to handle massive patient data flows and liability remain barriers.
• At the EHR level, the different systems largely do not communicate.
Biopharmas have an opportunity to connect patients to providers and researchers, capturing value from real-world evidence linking medications to outcomes, and adding services beyond the pill, including internet navigation, behavior management and data interpretation. So far, however, it is infotechs that are leading collaborations with health systems.
Despite these uncertainties, the new convergence is already transforming biopharma business models in profound ways. This may evolve into an enabling scenario (optimized research and clinical trials), but it could also be a disruptive one (disintermediation by infotechs of pharma/provider/patient communications).
For biopharma firms, the scale of digital investments across the value chain remains daunting and limits current initiatives to pilot projects. They may therefore need to view digital health not as an investment with rapid financial return, but as a long-term hedging of the risk that infotech leaders gain a dominant position in the health sector.
This perspective will be expanded in a forthcoming book, Marketing Biotechnology (Wiley Publishing), by Francoise Simon and Glen Giovannetti.
(Francoise Simon, PhD, Senior Faculty, Mount Sinai School of Medicine and Professor Emerita, Columbia University)

Financial performance
Biotech financials return to earth in 2015
The biotechnology industry once again enjoyed record performance in 2015. The tide of readily available capital for new and established public biotechs and a strong M&A market continued to sustain the industry’s positive momentum for much of the year. Revenue, R&D spend, net income and total market capitalization all reached historic highs. Scientific innovation in key therapeutic areas, such as immuno-oncology, and regulatory successes, especially around drugs that treat rare diseases, continued apace.
But even as the industry notched records in key financial metrics, signs of slowing growth in these same indicators, coupled with the swift erosion of public market support, also suggest biotech’s wave of unprecedented success may have crested. In the latter part of 2015, pricing concerns continued to weigh down the industry due to payers’ challenges to biopharmaceutical reimbursement in the US.
Declining growth
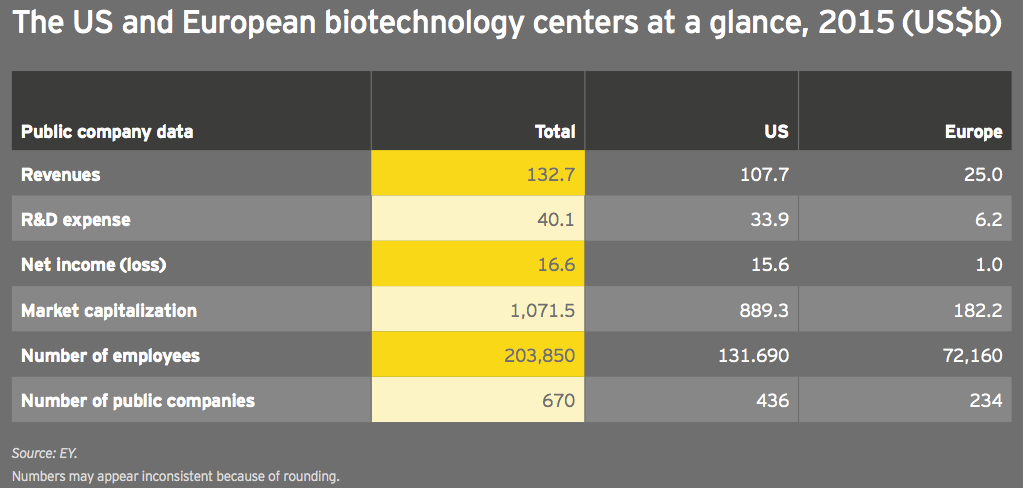
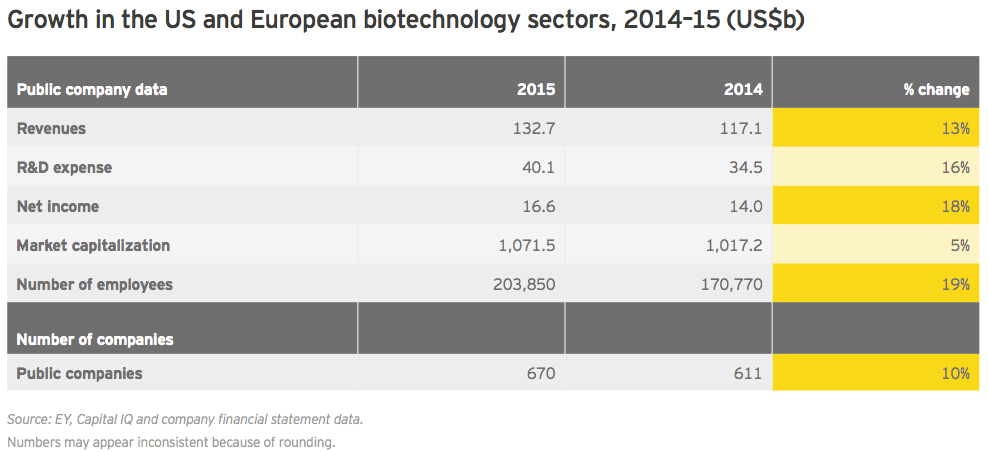
Global biotechnology revenues rose 13% in 2015 to US$132.7 billion, versus an 18% increase in 2014. Meanwhile, biotech R&D spend increased 16% to US$40.1 billion, only slightly below its 17% jump in 2014. That R&D expenses grew faster than revenues is notable, suggesting a continued willingness to bet on the industry pipeline.
Net income, which skyrocketed 214% in 2014 thanks almost entirely to the incredible success of Gilead Sciences’ hepatitis C franchise, was up 18% in 2015 to US$16.6 billion. That’s a respectable, if not historic, growth rate, especially since the bolus of companies that went public during 2015 accumulated more than US$2 billion in losses. More publicly traded biotech companies than ever before, 670 (up 10%), employed more people in the established biotechnology centers of the US and Europe in 2015, up 19% to about 204,000.
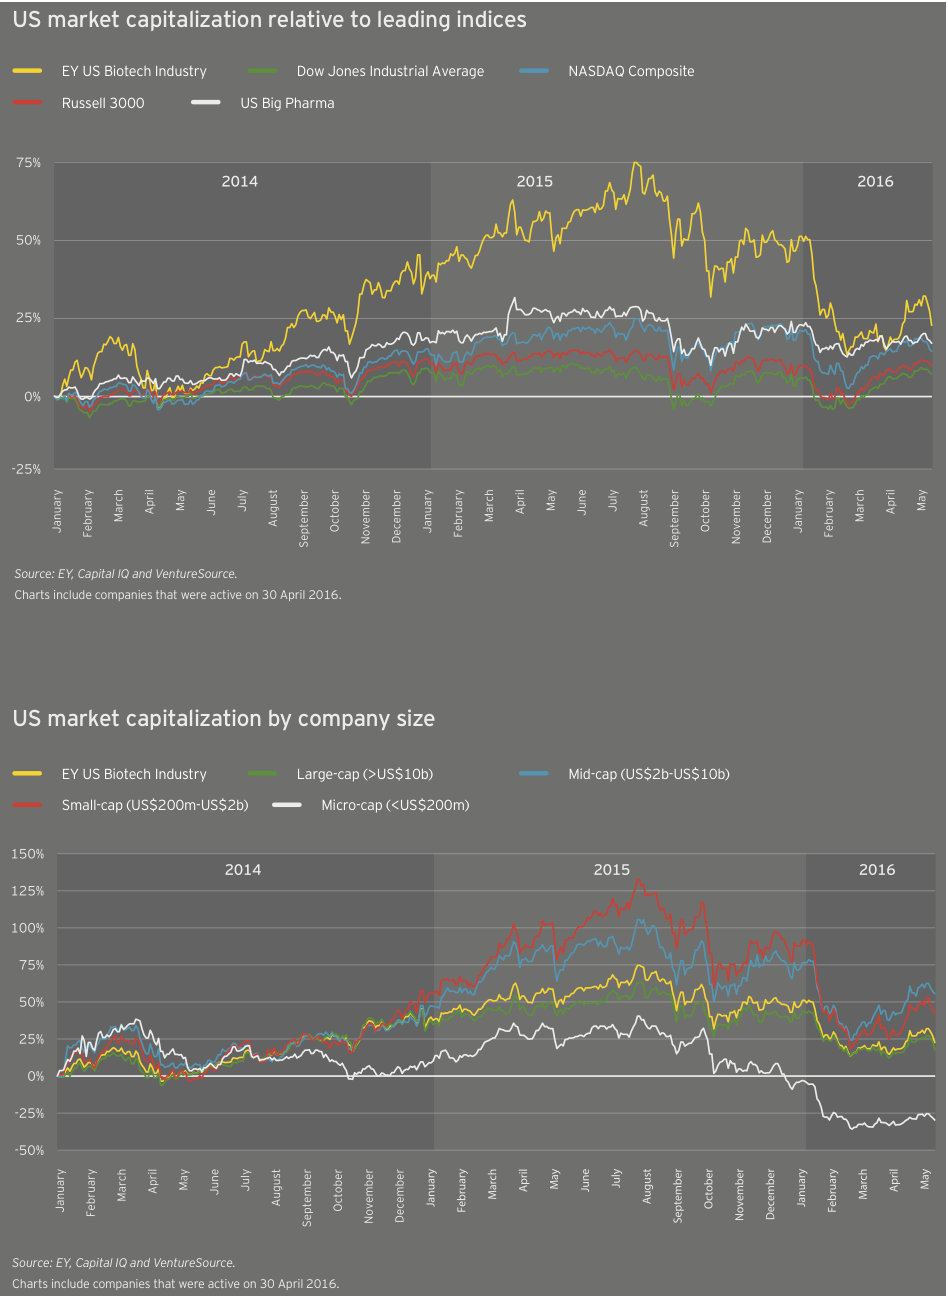
After two years of much more significant growth, the industry’s cumulative market cap grew only 5% in 2015 to nearly US$1.1 trillion. From a valuation standpoint, biotech peaked early in the third quarter of 2015. At its peak, the cumulative market cap of US biotechs alone reached about US$1.03 trillion, in mid-July 2015. As of mid-May in 2016, US biotechs’ cumulative market value had fallen by nearly a third, to US$687 billion.
Despite the recent pullback in the biotech market, viewed over a five-year time horizon these across-the-board gains are extraordinary. Publicly traded biotechs in 2015 employed 25,000 more people than in 2010, a 14% jump. And over the same period, R&D expenses increased 74%.
Those human resource and scientific investments have clearly paid off. Biotech industry revenues rose 60% from 2010 to 2015, and the market rewarded those efforts. Biotechs’ cumulative market value was up 167% over the same period. (In comparison, the S&P 500 Index rose 78.5% during that time.) This is thanks in part to an influx of newly public biotechs; since 2010, 292 biotechs have raised US$18.6 billion in initial public offerings.
The Gilead effect
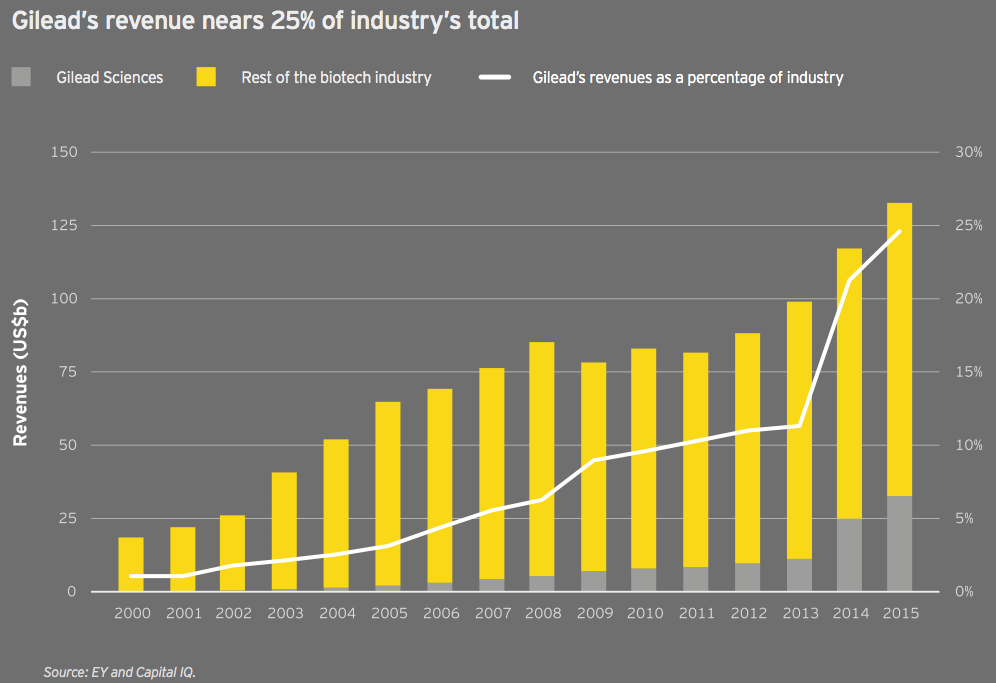
The growth of the antiviral specialist Gilead Sciences is nothing short of astounding. AbbVie, Merck & Co. and others continue to challenge Gilead’s dominant share of the hepatitis C market. As a result, Gilead’s share of the total biotech market may recede. But it’s worth noting the company’s remarkable rise, the biotech innovation that fostered it and the reimbursement environment in the US that has enabled it to flourish.
In 2000, the company’s US$196 million in revenue was just over 1% of all biotech revenue. (With US$3.6 billion in revenue that year, Amgen boasted a 19.5% share of the industry’s US$18.5 billion total.) Fast forward to 2015: Gilead’s US$32.6 billion revenue is 76% greater than the entire industry’s revenue at the turn of the century. The big biotech has grown roughly 25 times faster than the global biotech industry over that time span and now generates 24.6% of the industry’s aggregate revenue. (Meanwhile, Amgen’s share has fallen to just over 16%.)
Highly concentrated growth in the US
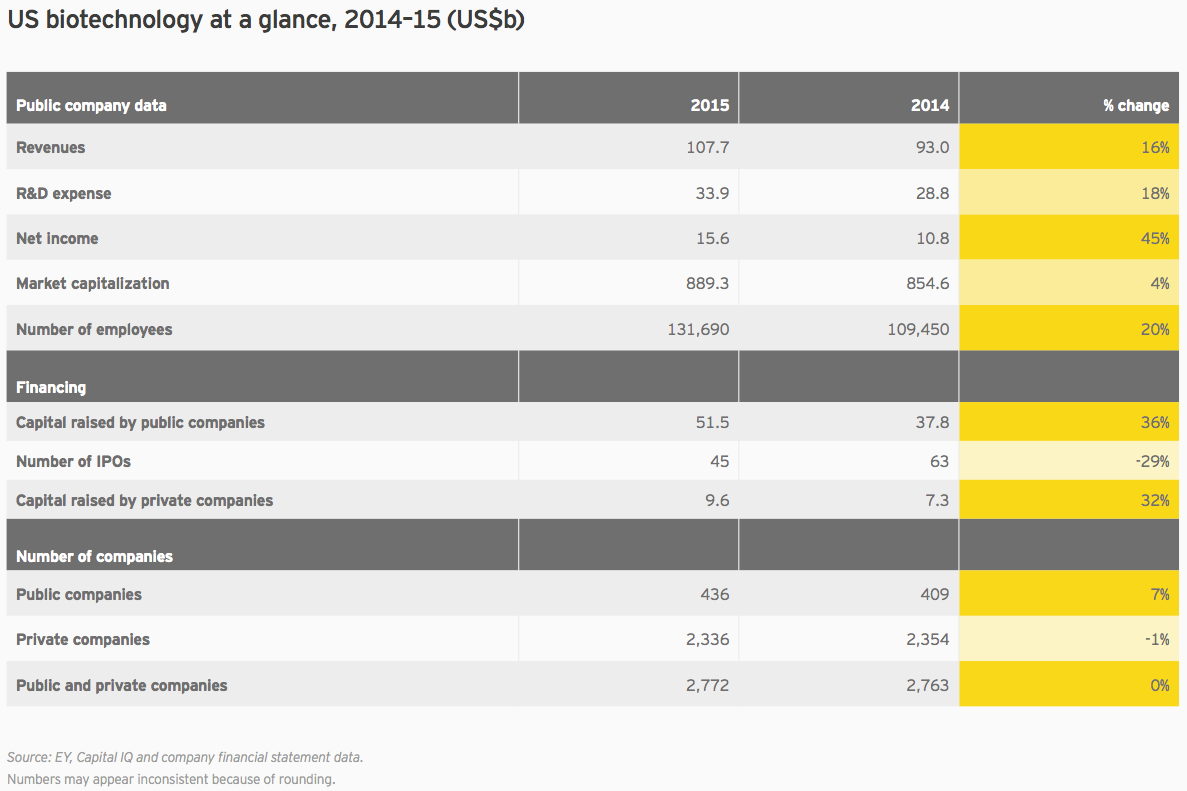
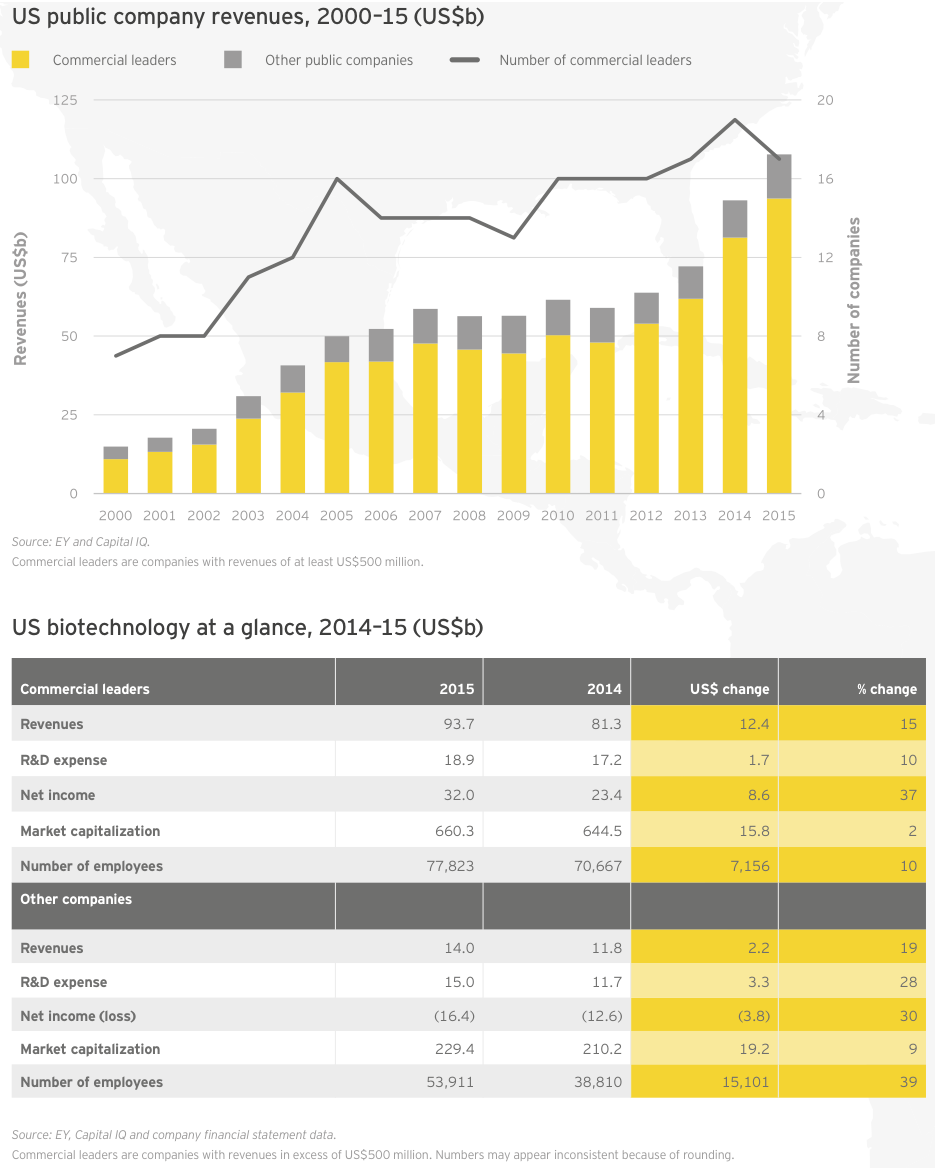
Unsurprisingly, trends in biotech’s largest global market drove the overall trends. Cumulative market cap for US companies rose only 4% in 2015, versus 34% the prior year. American companies spent US$33.9 billion on R&D, 18% more than the previous year. And US biotech revenues increased 16% in 2015, rising to US$107.7 billion.
With seven drugs generating greater than US$1 billion in 2015 sales, Gilead again led the way in the US and globally. In all, Gilead accounted for about 30% of all US biotech revenue, and its revenue growth accounted for 44% of the total US industry growth. Big biotechs Amgen, Biogen, Celgene and Regeneron Pharmaceuticals combined with Gilead to account for nearly three-quarters of all revenue from US biotechs, and well over half of all biotech revenue worldwide.
Net income also remains highly concentrated. Gilead’s US$18.1 billion in net income is greater than the cumulative net incomes from all other US companies in our universe that turned a profit: 49 other companies netted a total of US$16.3 billion. Together these 50 companies represent only 11% of all US biotechs. In a display of Gilead’s historic strength, or biotech’s intrinsically long odds and capital-intensive nature (take your pick), the remaining 89% racked up a cumulative net loss that actually outweighs Gilead’s gain: US$18.8 billion. US$1.6 billion of that net loss came from newly public biotechs.
That said, 59% of companies improved their bottom lines in 2015, better than the previous year’s 43%. These positive gains occurred despite three big pharma acquisitions, Merck/Cubist Pharmaceuticals, Valeant Pharmaceuticals International/Salix Pharmaceuticals and AbbVie/Pharmacyclics, which in 2015 shifted biotech revenues and net income to pharma’s books. These deals further abetted the concentration of wealth at the top of the biotech league table.
For the second year in a row, growth in R&D spend by companies with revenues of at least US$500 million (our “commercial leaders” category) lagged behind companies below this threshold. Seventeen US biotechs qualified as commercial leaders in 2015. That group upped its cumulative R&D investment by 10% to US$18.9 billion; all other companies’ cumulative R&D investment rose 28%, to US$15 billion, reflecting continued access to the capital markets through the first three quarters of 2015 as well as the impact of increased deal activity. For example, Celgene’s 61% year-on-year increase in R&D expense is in large part due to its accounting treatment of sometimes sizeable up-front payments it made to alliance partners in 2015.
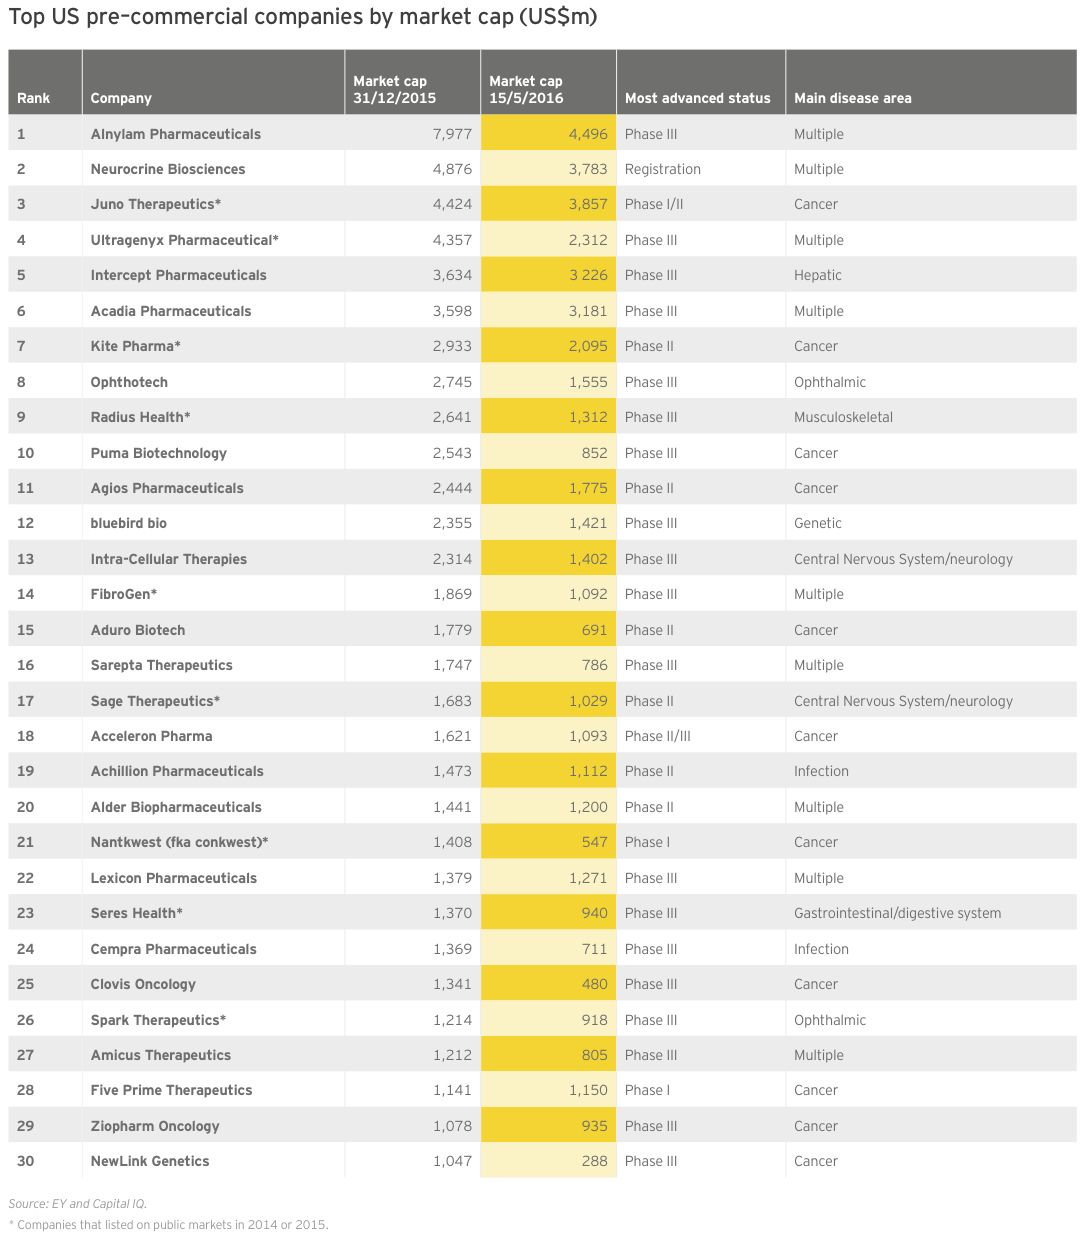
Though the noncommercial biotechs lack significant revenue, what revenue they do generate is growing faster than commercial leaders’. As a result, the market has ascribed considerable value to these typically loss-making US biotechs. In fact, 30 precommercial companies ended 2015 with market caps of at least US$1 billion, up from 25 in 2014. The strong revenue generation of these companies bodes well for their potential to become valuable acquisition targets. Celgene’s US$7 billion acquisition of Receptos and Teva Pharmaceutical Industries’ US$3.5 billion acquisition of Auspex Pharmaceuticals illustrate the value of late-stage clinical assets as more mature companies cast about for growth. (See “Biotech deal market soars.”)
Through the first four months of 2016, we’ve already seen US$54 billion of biotech M&As, including Shire’s US$32 billion merger with Baxalta, and that pace is continuing. In May 2016, Pfizer agreed to pay US$5.2 billion for Anacor, which though unprofitable, markets a topical anti-fungal, Kerydin, and has a registration-stage autoimmune therapy, crisaborole. Crisaborole, a topical PDE4 inhibitor, has showed promising Phase III results in atopic dermatitis and Anacor filed for FDA approval in March. Regulatory success for crisaborole would put Pfizer ahead of development-stage competitors with mainly (injectable) antibody therapies in an underserved market where standard-of-care is corticosteroids.
Though the noncommercial biotechs lack significant revenue, what revenue they do generate is growing faster than commercial leaders’.
Irish specialists drive European growth
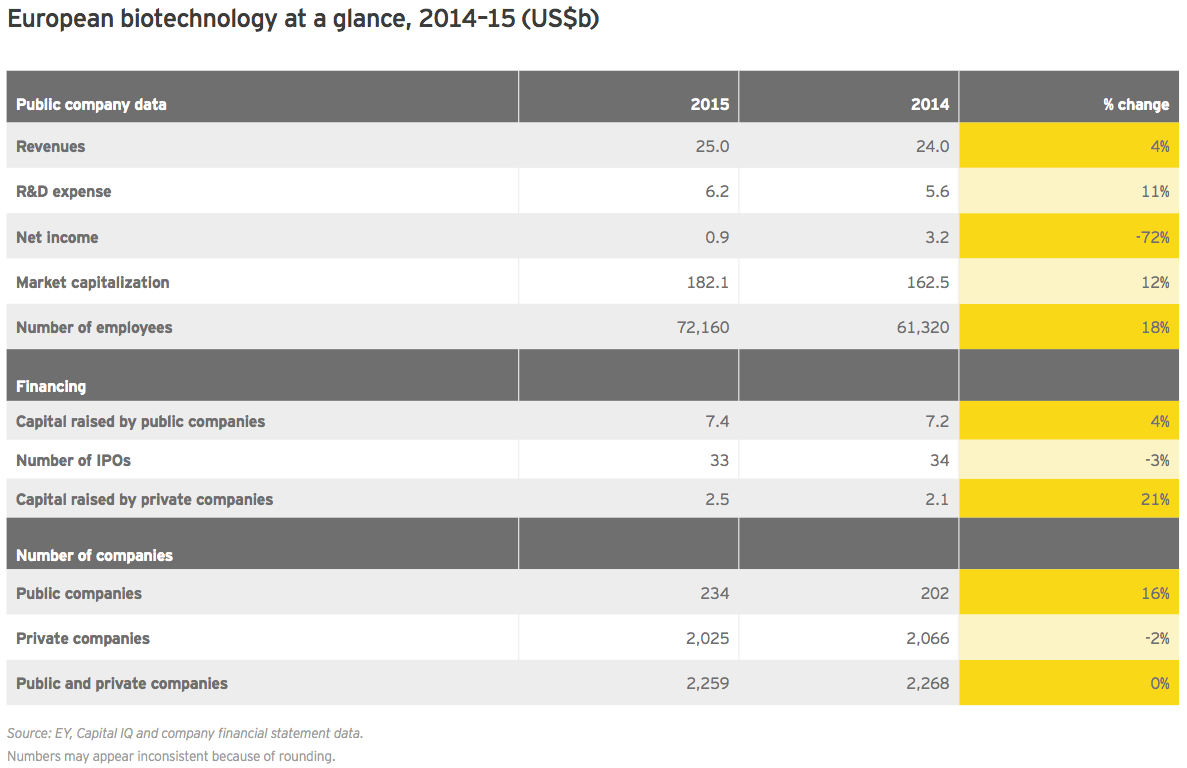
At roughly US$25 billion in aggregate revenue for 2015, European biotechs generated about a quarter as much as their US counterparts and grew at 4%, about a quarter of the US rate. Dublin-based Horizon Pharma led the way with a US$460 million year-on-year increase (+155%), thanks to gains across its portfolio of primary care and orphan disease therapies. Shire, still far-and-away Europe’s largest biotech, saw revenue jump 7% to US$6.4 billion. Following its acquisition of Baxalta in 2016, the company’s revenues increased further. Baxalta, a July 2015 spin-off from Baxter, posted pro forma 2015 revenue of more than US$6.2 billion.
2015 R&D expenses at European companies rose 11% year-on-year, below the previous-year increase of 14%. Cumulative net income, meanwhile, plummeted 72%, largely the result of a more than US$2 billion decline at Shire, which the prior year had reported unusually high net income. Recall that in 2014, Shire garnered a US$1.6 billion break-up fee when its proposed merger with AbbVie was called off due to the US Treasury Department’s changing stance on so-called inversion deals.
Horizon led net income gainers, with a US$303 million increase on the year. Jazz Pharma, another Dublin-based transplant (via its 2011 acquisition of Azur Pharma), followed closely behind with a US$271 million jump in profit.
Key financial performance insights
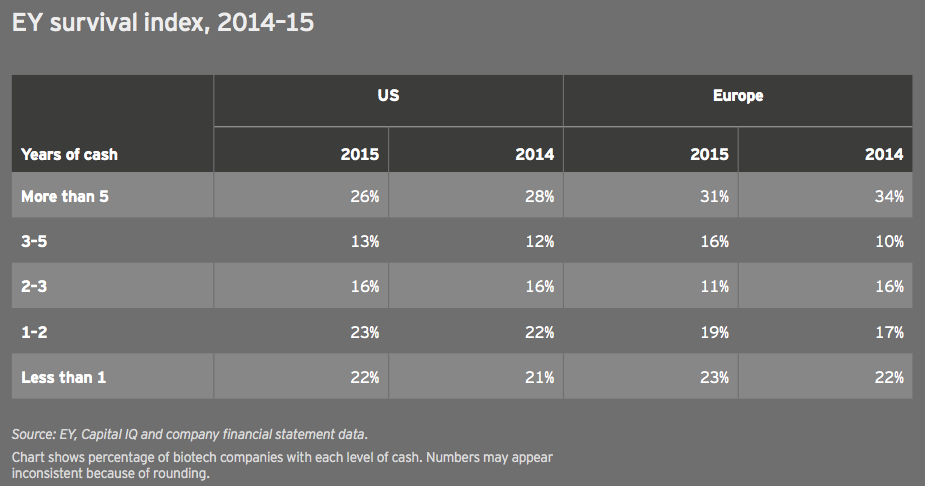
The EY biotech survival index tracks the number of years of cash companies have on hand. In 2015, these figures remained largely unchanged for the US and Europe, reflecting the relatively easy access to capital that biotechs enjoyed through most of 2015. The capital markets tightened amid the late-2015 and early-2016 biotech slump. Should that trend continue through the rest of the year, we expect this index to look much different in next year’s report.
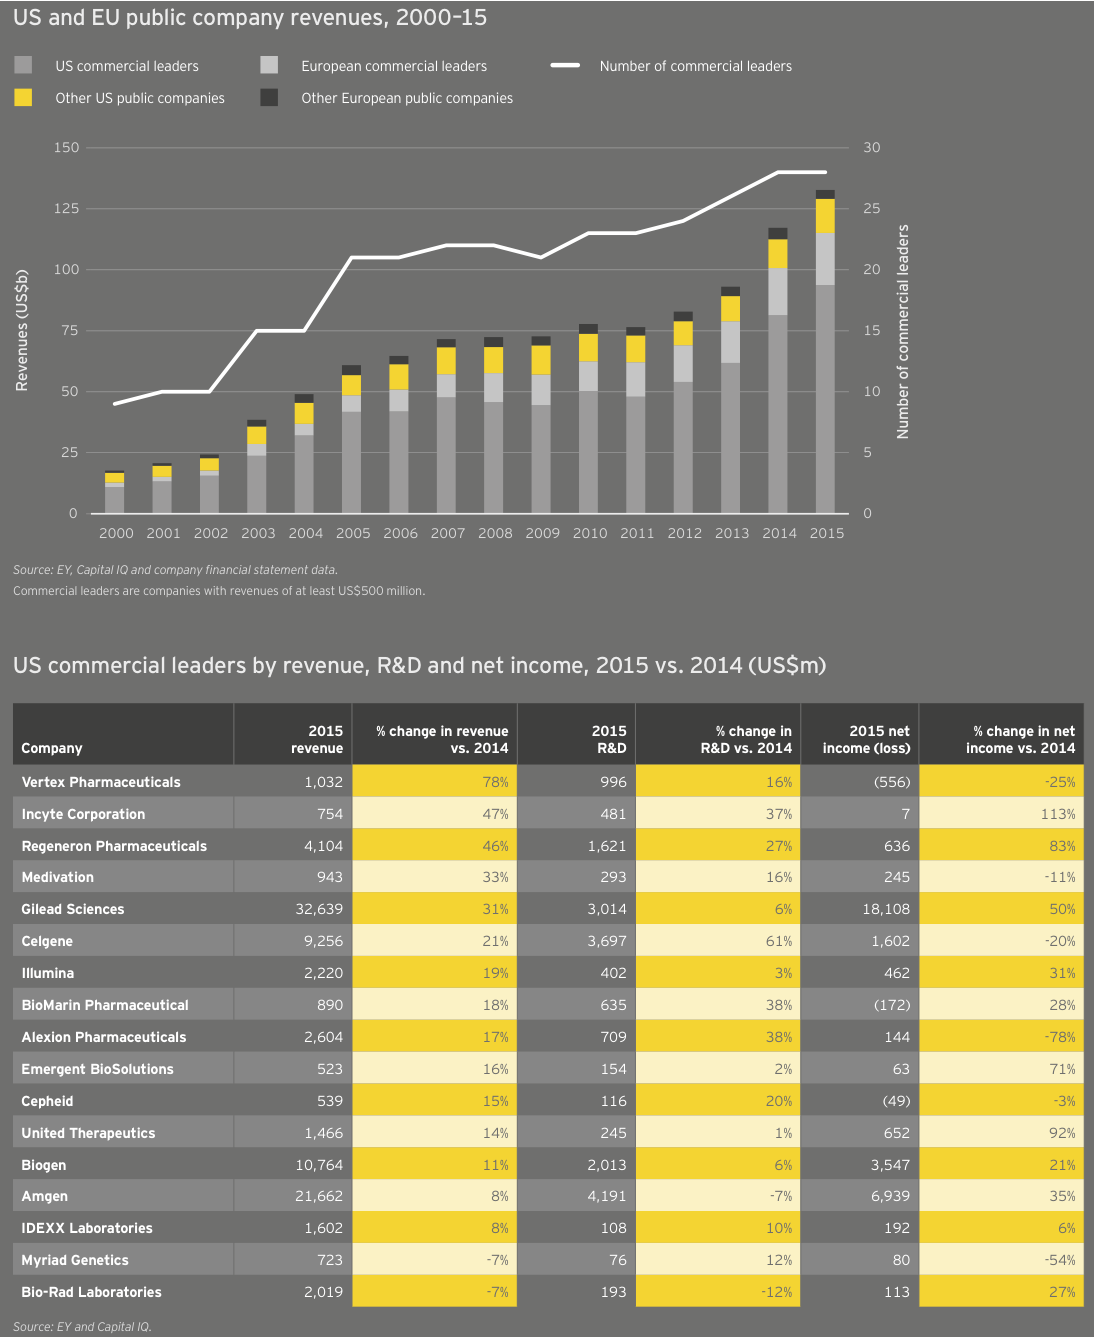
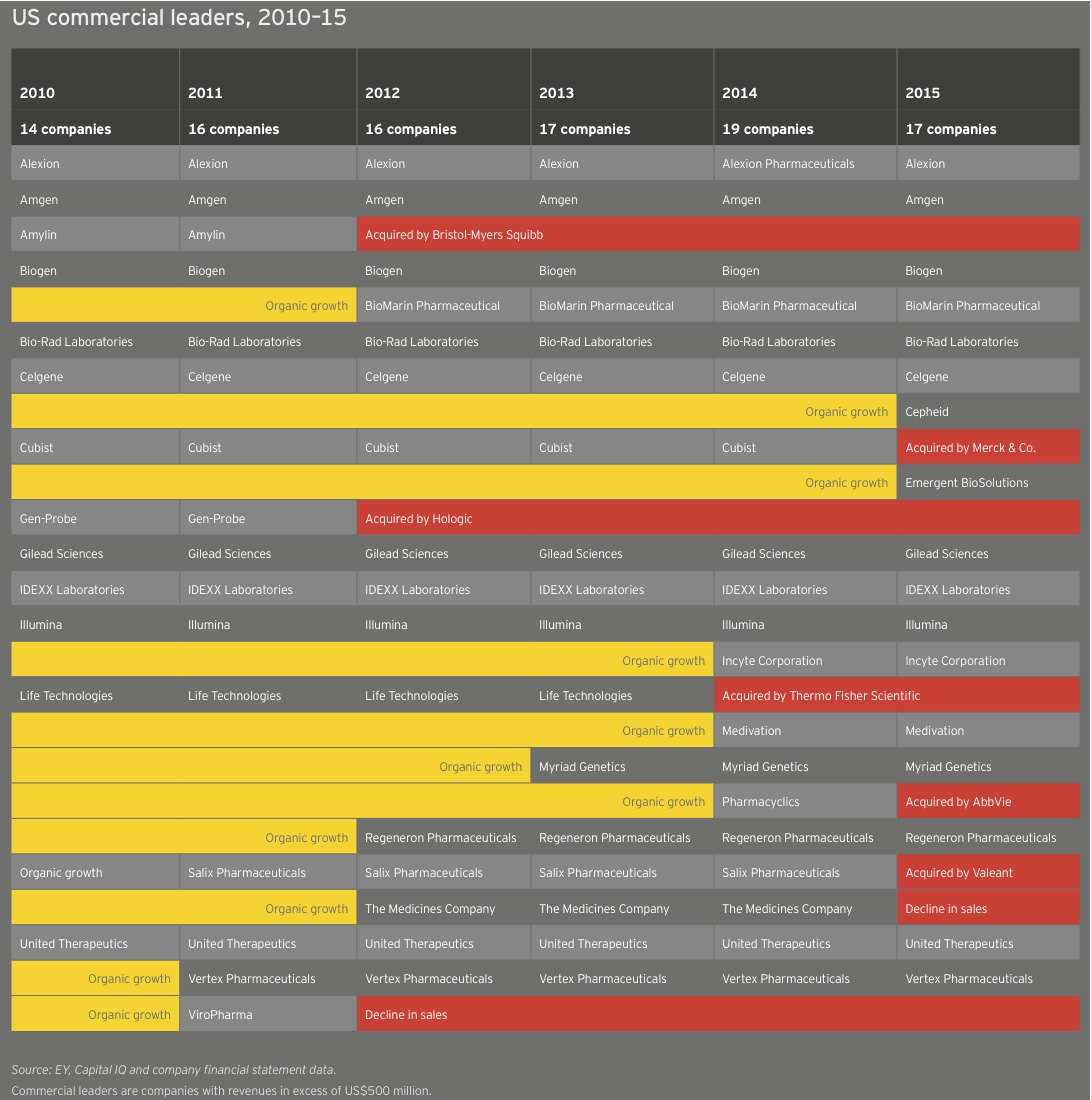
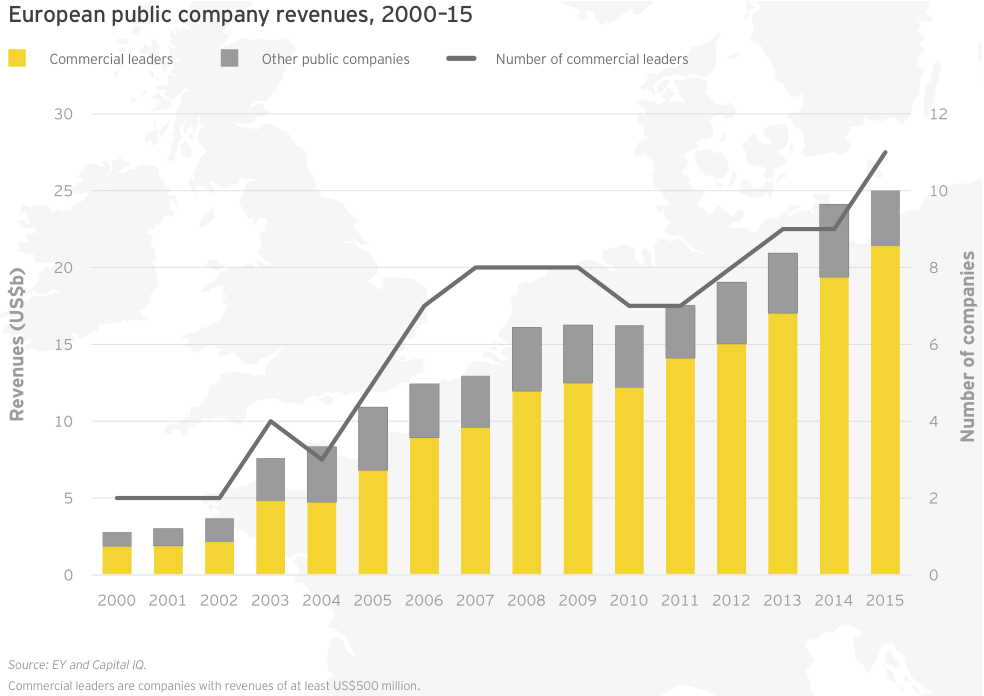
The number of US and European commercial leaders, defined as those companies with at least US$500 million in revenue, held steady in 2015 at 28. In the US, the number of companies fell from 19 to 17 as a result of the acquisitions of Cubist, Salix, and Pharmacyclics and the demotion of The Medicines Company as its revenues eroded when Angiomax lost patent protection. These shifts were partially offset by the addition of Cepheid and Emergent BioSolutions to the commercial leaders group. Cepheid saw revenue jump 15% to US$539 million thanks to greater sales of its diagnostics platform and clinical reagents. Emergent ramped up 16% to US$523 million on a combination of grant revenue, contract manufacturing, and sales of its biodefense and anti-infectives products.
Overall, 15 of the 17 US commercial leaders grew their top lines, though aggregate revenue growth dropped significantly from 2014 (15% versus 31%) and non-commercial leaders enjoyed better market cap performance in 2015. At the front of the pack, Vertex Pharmaceuticals saw its revenue increase 78% in 2015 to more than US$1 billion due to the launch of cystic fibrosis combination therapy Orkambi and a 36% increase in sales of its existing CF portfolio. Incyte Corporation and Regeneron also enjoyed increased sales of their respective treatments, Jafaki for myelofibrosis (up 68%) and Eylea for age-related macular degeneration (up 54%). Each announced record revenues in 2015.
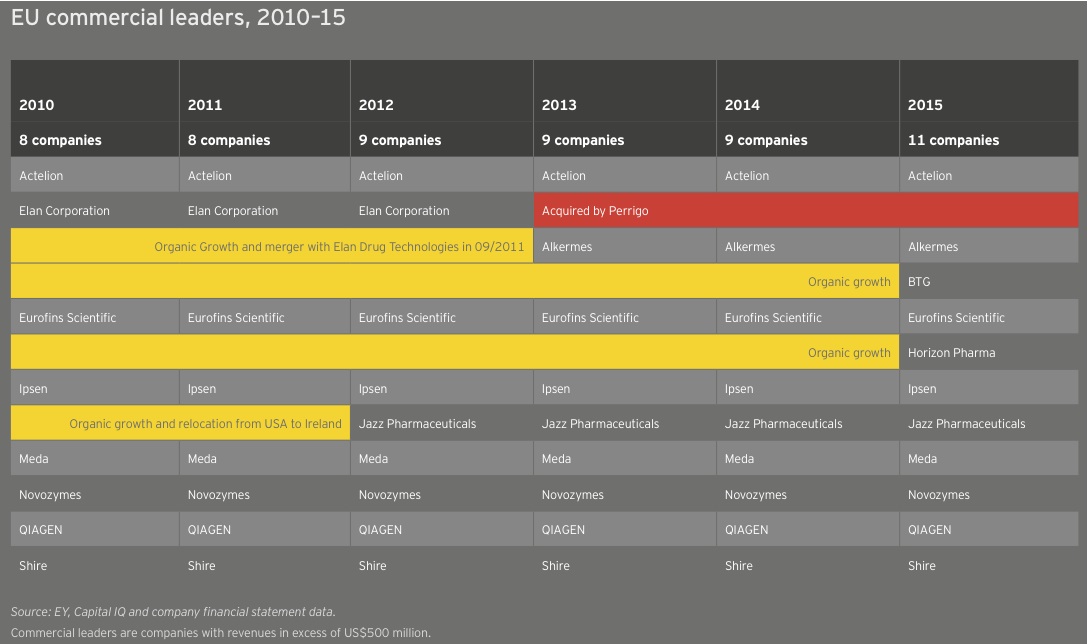
In Europe, two companies joined the ranks of commercial leaders, taking the tally there from 9 to 11. Horizon Pharma, which redomiciled to Ireland in 2014, saw its revenue soar 155% to US$757 million in 2015 as a result of its acquisition of Hyperion Therapeutics. Meanwhile, specialty drugmaker BTG’s revenue jumped 18% to US$562 million. Among all European commercial leaders, 7 of 11 companies boosted their top lines, up 10% in aggregate to US$21.4 billion. This total comprised 85% of all European biotech revenue in 2015.
United States
In 2015, the market embraced pre-revenue companies of a certain type: companies with technology platforms and late-stage oncology therapies. Two-thirds have a lead product candidate in Phase III trials or registration; more than a third are oncology-focused. And roughly a third (9 of 30) are public market newcomers with IPOs during 2014 or 2015.
RNA interference pioneer Alnylam Pharmaceuticals topped the list with a year-end market cap of nearly US$8 billion — its second year as the most valuable precommercial biotech. Though it retained that status as of mid-May 2016, its updated market valuation of US$4.6 billion illustrates just how much investors have cooled on the sector. Measuring the drop from Alnylam’s June 2015 valuation peak of about US$11.8 billion throws industry’s slide into even sharper relief.
Alnylam is hardly alone in suffering a declining valuation since the end of 2015. Not a single company on this list saw its market value rise in the first several months of 2016. Oncology-focused Five Prime Therapeutics came the closest, essentially breaking even on the year so far. Indeed, as of mid-May 2016, only three companies have lost less than 10% of their value, while six have lost more than half their value. In the same time frame, the market caps of 10 biotechs have fallen below US$1 billion.
Of course, even a precipitous decline in market value isn’t necessarily a sign of bad news. CNS-focused Acadia Pharmaceuticals has disqualified itself from 2016’s list of precommercial players for the best possible reason. In early May, FDA approved Acadia’s lead asset Nuplazid to treat hallucinations and delusions associated with Parkinson’s disease psychosis. Despite this inaugural regulatory success for Acadia, or paradoxically perhaps because of the daunting reimbursement task now before it, its market cap was down slightly more than 10% as of mid-May 2016.
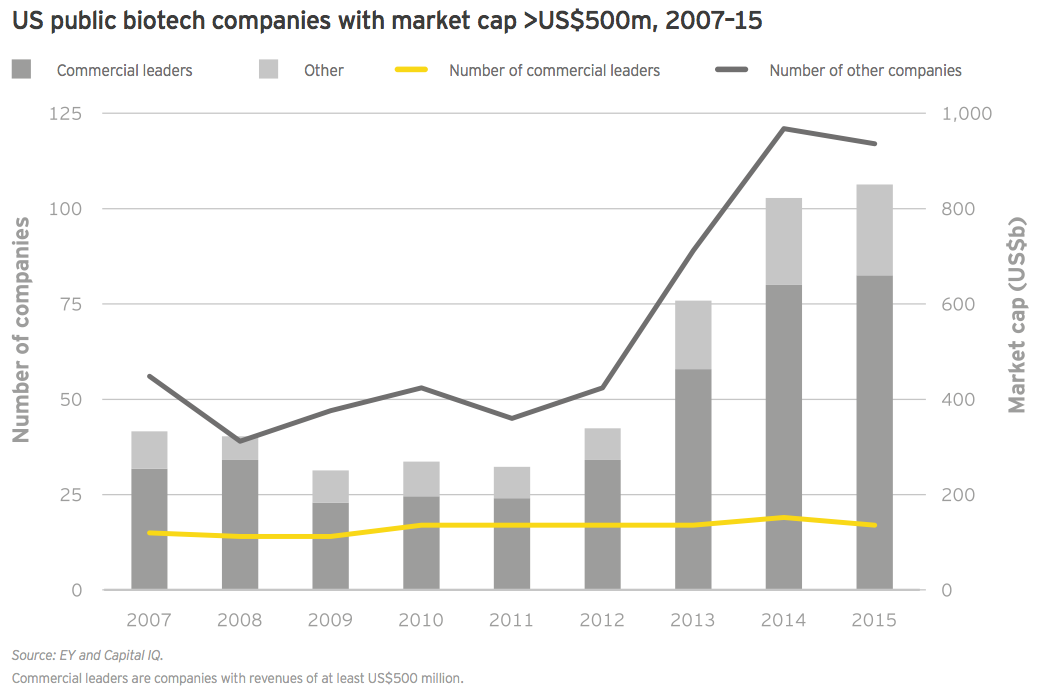
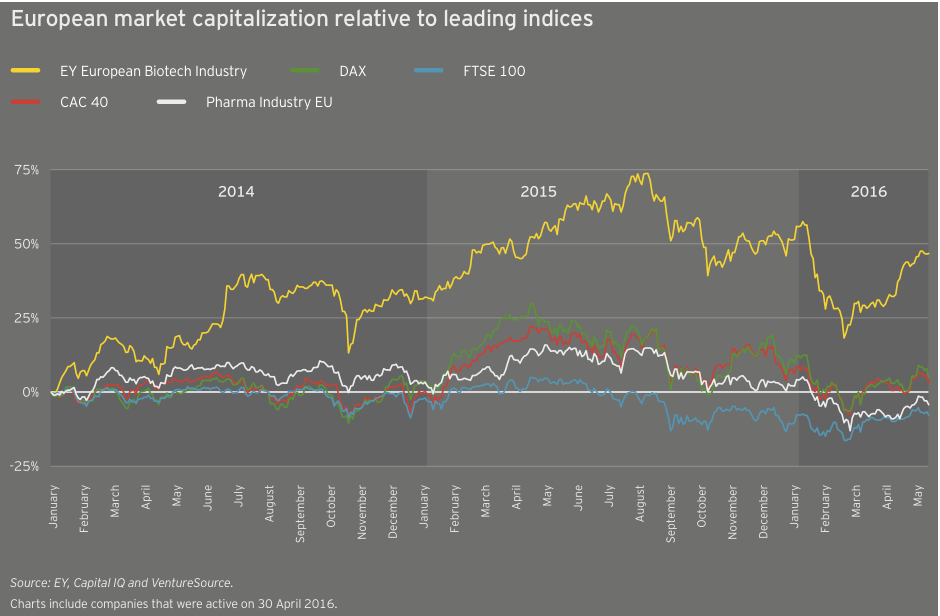
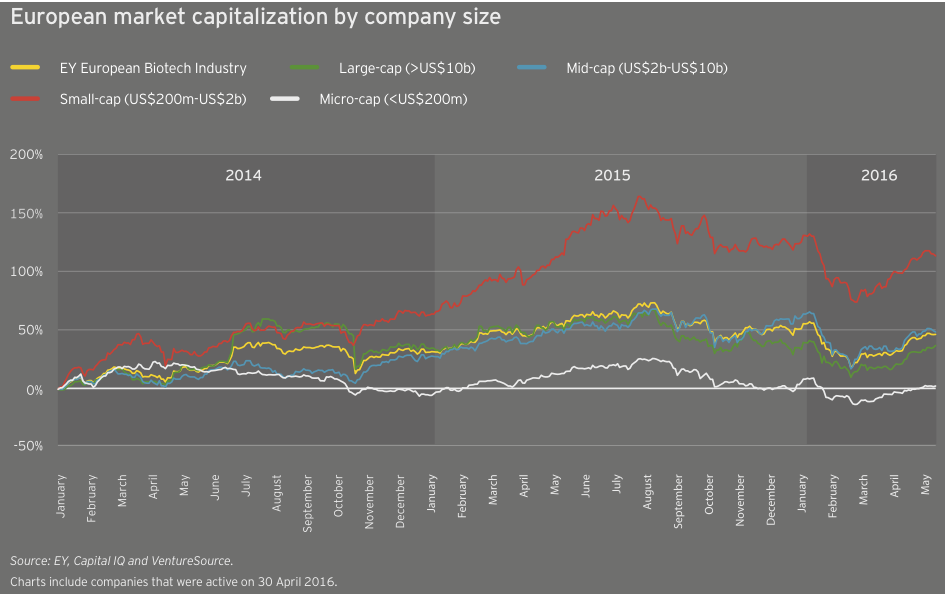
Overall, market values have soared since 2012. Given the cyclical nature of the biotech industry’s relationship with the public markets, it shouldn’t be surprising that the industry’s aggregate value would begin its return trip to earth at some point. In 2015, the number of companies ending the year with a greater than US$500 million market cap declined to 117 from 121 in 2014. But that figure is still well above the 63-company average from 2007–2015.
Commercial leaders, too, have seen an explosion in value over the past several years. Like their precommercial counterparts, these companies have seen their values erode since the end of 2015, in some cases dramatically. As of mid-May, for instance, Gilead had lost about US$35 billion in market cap since the start of 2016.
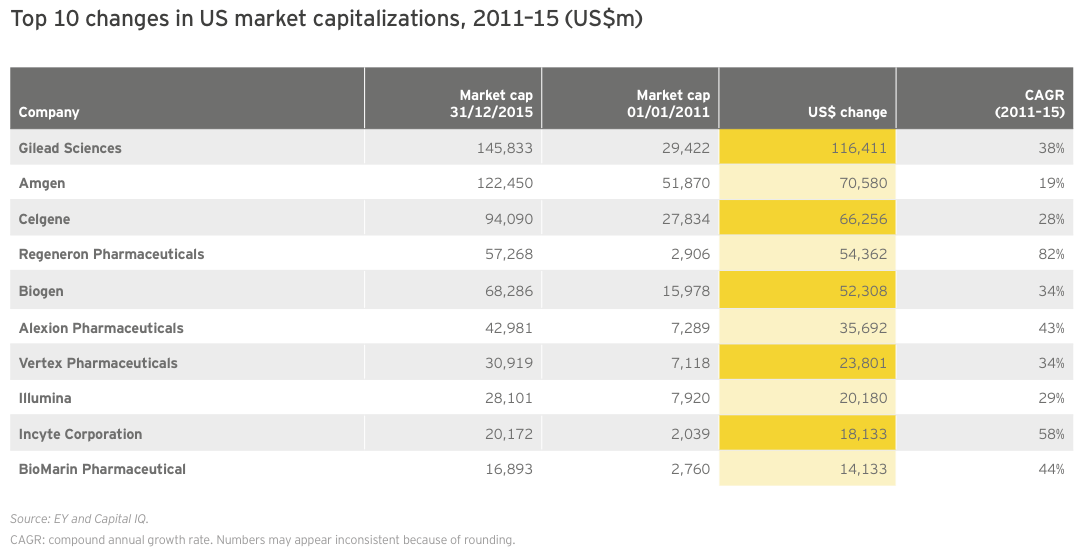
Again, taking a five-year view demonstrates the phenomenal growth the biotech industry has enjoyed this decade. Indeed, during this time frame, only 10 biotechs added nearly US$500 billion in combined market value on the strength of breakthrough therapies across a variety of therapeutic indications.
Regeneron’s extraordinary 82% CAGR from 2010 to 2015 reflects that company’s transformation from a promising R&D-stage platform biotech to a commercial company with a US$2.7 billion blockbuster in its portfolio. Although Eylea’s growth is likely to slow (the drug’s revenue was up more than 50% in 2015), the company has predicted a 20% bump in revenue for its flagship product in 2016. Despite this forecasted uptick, Regeneron has slumped along with the broader market in 2016, losing nearly US$20 billion in market cap since the beginning of the year.
Part of the market’s pessimism can be chalked up to the slow start of Praluent, the hotly anticipated cholesterol-lowering drug approved in July 2015 that Regeneron sells with partner Sanofi. With fourth-quarter 2015 and first-quarter 2016 sales of only US$7 million and US$13 million, respectively, it’s clear that payers have so far successfully limited use of the injectable anti-PCSK9 antibody. Amgen, which markets a competing therapy, Repatha, which launched shortly after Praluent, reported US$16 million in first quarter 2016 sales for its drug.
Given the cyclical nature of the biotech industry’s relationship with the public markets, it shouldn’t be surprising that the industry’s aggregate value would begin its return trip to earth at some point.
Europe
Led by Shire, Europe’s commercial leaders increased their revenues by 10% in 2015. Shire’s net income trough also dragged down the group’s performance on this metric. Beyond Shire, only four companies breached US$2 billion in revenue, and the variable composition of this group reflects Europe’s heterogeneous mix of revenue-generating biotechs. Sweden’s Meda boosted revenue only 4%, to just over US$2.3 billion, but its mix of specialty prescription, consumer and generics products drove a spike of 140% in net income. French toolmaker Eurofins Scientific ramped up revenue 16% to US$2.2 billion as net income dropped slightly (-8%). Swiss pulmonary arterial hypertension play Actelion was up by 4% to US$2.1 billion in revenue. And the Danish industrial biotech specialist Novozymes’ revenue fell 6% to nearly US$2.1 billion.
Among noncommercial leaders, Swedish Orphan Biovitrum (Sobi) led with US$382 million in revenue, but with the continued roll-out of Elocta and Alprolix (for hemophilia A & B), there are hopes the company will join the ranks of commercial leaders soon. Flamel Technologies’ revenue spiked more than 1,000% to US$173 million due to rising sales of the formulation specialist’s myasthenia gravis treatment (Bloxiverz) and blood pressure therapy (Vazculep).
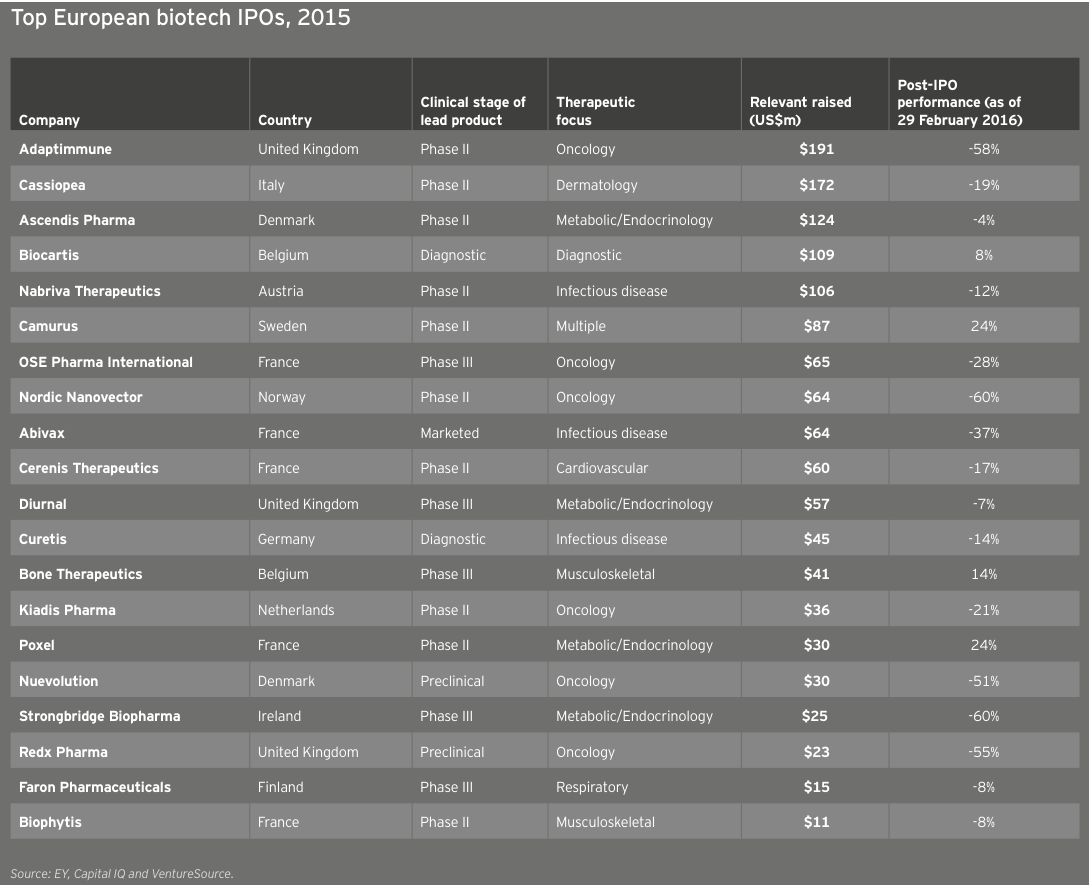
The UK biotech Adaptimmune Therapeutics highlighted a strong year for European IPOs when the immuno-oncology company raised more than US$191 million in its May 2015 debut. But newly public companies in Europe hardly made a dent to revenue totals, adding only US$78 million over 2014. Of the cohort, only German molecular diagnostics company Curetis turned more than a nominal profit. That US$15.4 million in net income was, however, due entirely to a one-time accounting boost.
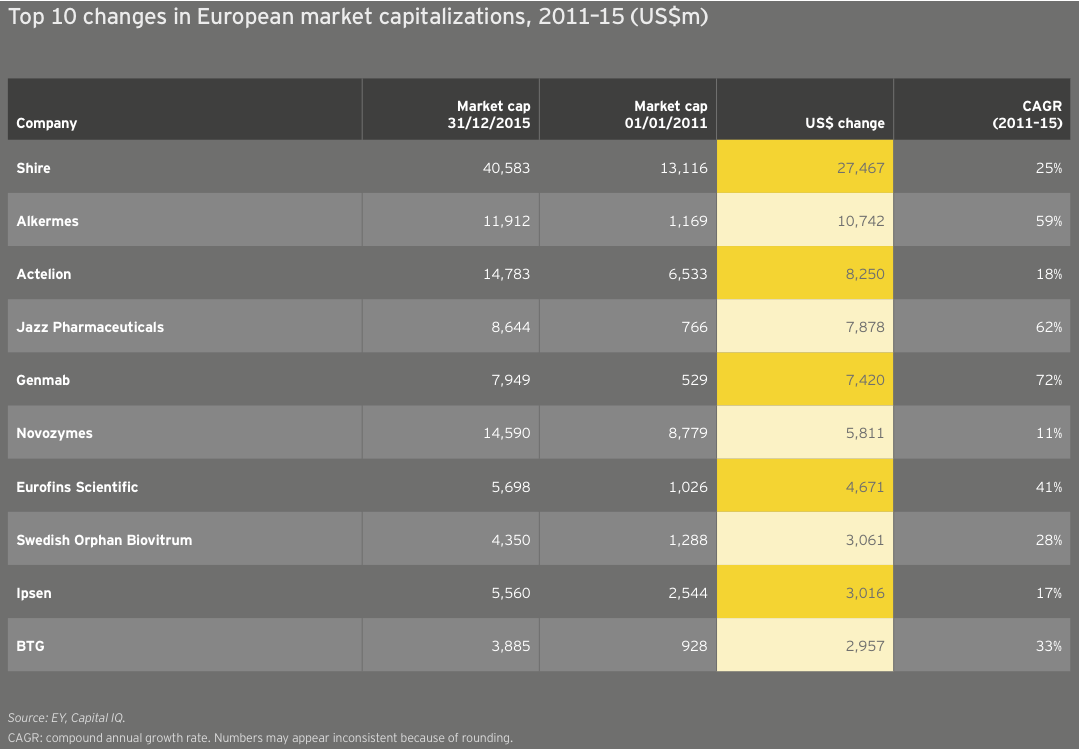
Europe’s larger biotechs have enjoyed increased market values from 2011 to 2015 as a result of sustained commercial successes and growth via acquisition. Actelion, for example, more than doubled in value from the beginning of 2011 to the end of 2015 on the strength of its pulmonary arterial hypertension franchise, which includes Tracleer and two recently launched medicines, Opsumit and Uptravi. Meanwhile, Shire, the continent’s largest biotech, spent nearly US$20 billion acquiring at least a dozen biotechs during that same time frame, including NPS (US$4.9 billion) and Dyax (US$5.5 billion). With its US$32 billion acquisition of Baxalta, Shire has remained active in 2016. Like its US counterparts, Shire has seen value erosion through late May 2016, falling about 7% to about US$38 billion on the year.
Several US expats are among the European biotech growth leaders. Alkermes and Jazz Pharmaceuticals, each now Dublin-based by virtue of previous acquisitions, have grown significantly since 2010, with CAGRs of 59% and 62%, respectively. Alkermes has dropped about 35% through late May 2016, primarily due to failed Phase III trials of its most advanced clinical candidate, ALKS5461, in major depressive disorder. Jazz, meanwhile, has been one of the few larger biotechs to buck the downward trend in 2016. The specialty oncology and sleep therapeutics company’s market cap is up 12% through late May 2016.
Topping the growth chart at the outset of 2016, the Danish biotech Genmab has outperformed peers this year on the strength of clinical success and regulatory approvals for its oncology therapies, Arzerra and Darzalex, sold by partners Novartis and Johnson & Johnson, respectively. Genmab’s value is up nearly 30% to roughly US$11 billion toward the end of May 2016.
Europe’s larger biotechs have enjoyed increased market values from 2011 to 2015 as a result of sustained commercial successes and growth via acquisition.
To create value, put the right assets in the right hands
We live in an age of increasing uncertainty and complexity. There is a growing need to demonstrate value to health care stakeholders, which has put pressure on biopharma business models. As an industry, we need to embrace models that provide better capital efficiency and utilization of assets. It’s really about putting the right assets in the right hands to do the right work.
For drug developers, this requires asking: where do we, as innovators, create real value? For most biopharmas, the answer to this question is drug development and commercialization — not the manufacturing and supply chain spaces.
The biggest players in the industry struggle because they have manufacturing and supply chain processes that were designed for the past, but are not suited for the future. Too often we find companies that source drug substances from one supplier, the finished dose form from another maker and packaging from a third party. The question is, why? Apple doesn’t touch its products until they arrive in the stores. Should drug manufacturing be any different?
In the past, innovative biopharmas had to build manufacturing and supply chain capabilities to reach the value-creating event — the launch of a product in the marketplace. But that’s not the case today. Indeed, there’s no reason for even the biggest biopharma to be asset-heavy in today’s market. Contract and development manufacturers such as Patheon can take advantage of their end-to-end supply chains to create the same high-quality products for 30%–40% less than what a client company would need to invest in its own network. We are the ones who know how to really work the assets, building flexible, multi-product factories and laboratories that are optimized for operational excellence.
Lean in
Improving capital efficiency isn’t only about taking costs out of the system. There is this premise that lean companies have to run closer to the edge. In our business, it isn’t about cutting corners, especially when it comes to quality and inventory. Biopharmas that make chronic care or life-saving products shouldn’t be taking so much working capital out of the supply chain that a single perturbation — a quality issue with an active pharmaceutical ingredient, for instance — results in missed drug shipments.
The truth is, even as big pharma companies focus on capital efficiency, there is still plenty of fat to cut in basic business practices. For drug developers, being lean means simplifying operations and building robust, repeatable processes that yield high-quality, “right first time” products.
In today’s uncertain times, all companies need to think about how they create agility. Our business proposition requires that we be flexible and adapt quickly to make the necessary changes to a manufacturing or development process so there is as little production downtime as possible.
In this environment, our only certainty is that there will be uncertainty. We don’t want delays, but the nature of the work means technical problems will arise. For a company that is trying to manufacture a handful of molecules, that kind of disruption is hard to manage efficiently. But we can, because we have the law of large numbers on our side. In 2015, Patheon launched 22% of all the drug products that were approved by the FDA in the US. At any one time, we are developing 150 different molecules. To keep processes on track, we’ve invested in agile systems that can reduce the production uncertainty for clients.
In the past, innovators viewed contract manufacturers as simply extra capacity. But really we offer scientific capabilities, access to specialized capacity, flexibility and risk mitigation. We’re asset heavy because we have to be; it’s what we do. Biopharma innovators, however, can improve their return on invested capital by devoting less effort to manufacturing and supply chain and more to creating intellectual property around the new molecules themselves. As the pressure to be efficient with capital grows, more companies will shift to asset-light strategies.
And, these companies will look to reduce their supply chain risks. Uncertain demand at the time of product launch and different regulatory rules across markets increase the complexity — and risks — of product manufacturing. We now have more frequent conversations with clients about larger concerns that go beyond supply chain to business continuity.
As the pressure to be efficient with capital grows, more companies will shift to asset-light strategies.
(James Mullen, Chief Executive Officer, Patheon)
Financing
Bountiful harvest leaves biotech well prepared for winter
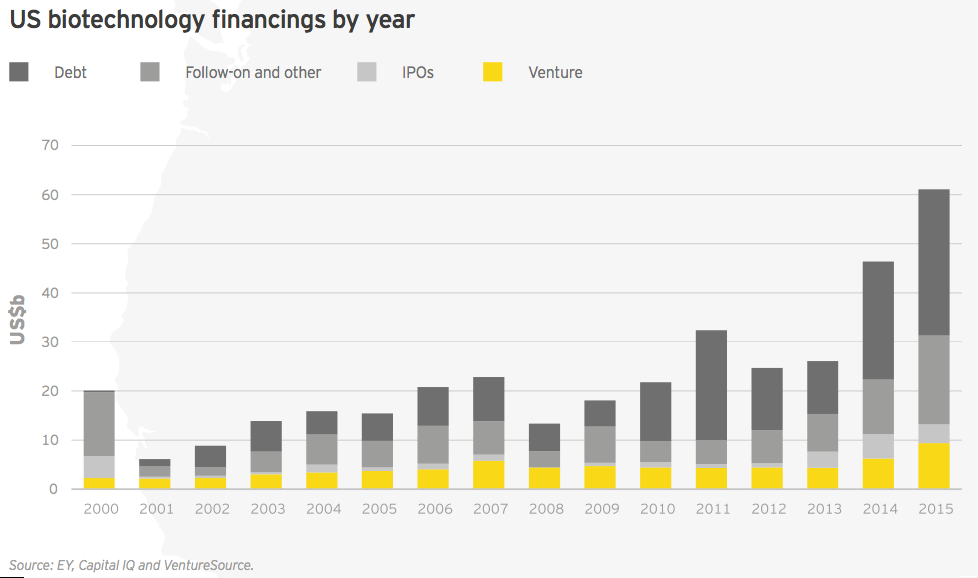
For the second year in a row, the biotechnology sector’s financing total reached unprecedented heights. Biotechnology companies raised nearly US$71 billion in 2015, easily surpassing the record-setting US$56 billion amassed the year prior.
Fueling this best-ever financial picture were record capital raises in three categories: follow-on public financing rounds, debt and venture capital. It was also another stellar year for initial public offerings (IPO), with more than US$5.2 billion raised in IPOs, the third-highest total on record.
Whether large or small, public or private, biotech companies across the industry have been able to take advantage of the free-flowing capital over the past two years. During this period, they have filled (or refilled) their coffers with cash to drive future research and development, and business development agendas.
Biotech is an industry known for cycling between booms and busts. Despite its record financial harvest, its inevitable winter is coming, and numerous signs suggest that public capital is becoming more scarce. The biotech indices have relinquished the past years’ enormous gains, and the queue of companies lining up for public offerings has dwindled. In this environment, the question to ask isn’t whether the climate is changing, but just how long this winter will last.
Slowdown ahead?
Since the US garners the vast majority of all biotech financing (86% in 2015), it makes sense to view it as a proxy for the overall health of the industry. And signs of a financial slowdown are readily available.
In the fourth quarter of 2015, for instance, activity decelerated significantly in nearly every fundraising category except venture capital, which held remarkably steady throughout the year. Fourth quarter IPO activity shrank appreciably: biotechs raised US$1.4 billion via 11 offerings in the third quarter, but in the fourth quarter, newly public biotechs raised only US$497 million across eight deals. Most ominously, no biotechs went public, in the US or anywhere else, during December 2015 and January 2016.
The drop in follow-on offerings was even more pronounced: in the third quarter, biotechs pulled in US$4.4 billion across 48 deals, but in the fourth quarter, that fell to US$1.2 billion across 27 deals. Debt practically vanished, too, but the third quarter’s total was unusually high as a result of US$24 billion raised by stalwarts Gilead Sciences, Biogen and Celgene.
Biotech’s financial reservoirs are full
Biotech’s financing drop-off mirrored the decline of the NASDAQ Biotech Index, which fell 21% during the month of January 2016. This current pause in the equity markets provides a good opportunity to examine the biotech industry’s overall financial health,as well as how future capital flows might be affected by ongoing issues, especially continued focus in the US on biopharmaceutical pricing. The drops in financing and valuations may be equally precipitous, but that’s in large part because each rise was historically impressive.
Moreover, the drivers of biotech’s overall success remain intact. They include a favorable regulatory environment, public policy tailwinds (such as support for biopharma-friendly legislation like the 21st Century Cures Act and development incentives like priority review vouchers), exploding scientific opportunities in key therapeutic areas such as immuno-oncology, and big pharma’s unquenchable desire to acquire innovation.
Thanks in part to more than US$32 billion in debt financing in 2015, biotech commercial leaders are equipped to compete for that innovation as well. In September 2015, Gilead raised US$10 billion to add to an already strong balance sheet, which observers expect will be put to use for M&A. Celgene raised US$8 billion in August in part to finance the US$7.2 billion acquisition of Receptos, which will boost Celgene’s prospects in autoimmune diseases such as multiple sclerosis and ulcerative colitis. Amgen and Biogen raised US$3.5 billion and US$6 billion, respectively, and both companies’ capital allocation strategies certainly include a mix of shareholder incentives and business development priorities.
During a dynamic year of financial success, follow-on public offerings stand out not only because of their record total of nearly US$22 billion, but because, unlike debt financing, that largesse wasn’t concentrated in the hands of a few already well-financed commercial leaders. During 2015, at least 66 biotech companies (total of 72 rounds) raised more than US$100 million in follow-on rounds (58 in the US and 8 in Europe), compared with 49 companies (55 rounds) the previous year. There were 26 follow-on rounds that raised more than US$200 million (Intercept Therapeutics had two of those, totaling about US$570 million). Highlights included two January 2015 raises: a US$912 million follow-on from BioMarin Pharmaceutical, the largest biotech follow-on offering in nine years; and Alnylam Pharmaceuticals’ US$517 million deal. Other notable offerings were Bluebird Bio’s US$500 million deal (June 2015) and Horizon Pharma’s US$499 million deal, which was the largest by a European company. (Horizon redomiciled to Ireland after its acquisition of Vidara Therapeutics in 2014.)
Overall, the vast majority of this capital was raised by development-stage biotechs, many of which are developing cutting-edge science in areas such as gene and cell therapy. Thus, despite signals the bull market was losing steam, for most of 2015, investors were still willing to back commercially unproven technologies.
The same scenario held true for the buoyant IPO market, which noted a record-setting 11 quarters of sustained activity, which could set the standard for both duration and total funds raised (US$15.4 billion over 224 IPOs). In 2015, at least one company, gene therapy specialist Spark Therapeutics, pulled off both an IPO (US$185 million in February, good for the second-largest IPO in the US in 2015) and a follow-on round (US$141 million in November). The US$5.2 billion raised in debut public financings ranked below 2014’s US$6.9 billion and 2000’s nearly US$7.8 billion (still the high-water mark after nearly two decades). During the fourth quarter of 2015, seven of the eight biotechs that priced IPOs in the US did so below their intended ranges, suggesting declining interest — or at least a sated investor appetite.
In February 2016, two biotechs — BeiGene and Editas Medicine — both priced IPOs within their announced ranges, suggesting that companies with strong science and expert management teams can still enjoy investor interest even if the broader market for new public listings fizzles. The recent about-face in biotech markets is due in part to the retreat of generalist investors that had helped fuel the previous years’ run-up. It’s also a reminder that investors’ interest in biotech companies can be affected by macroeconomic factors that may spark worry about, or stimulate interest in, the sector regardless of its fundamentals. The biotech and broader health care markets do not exist in a vacuum.
Venture financing accelerates
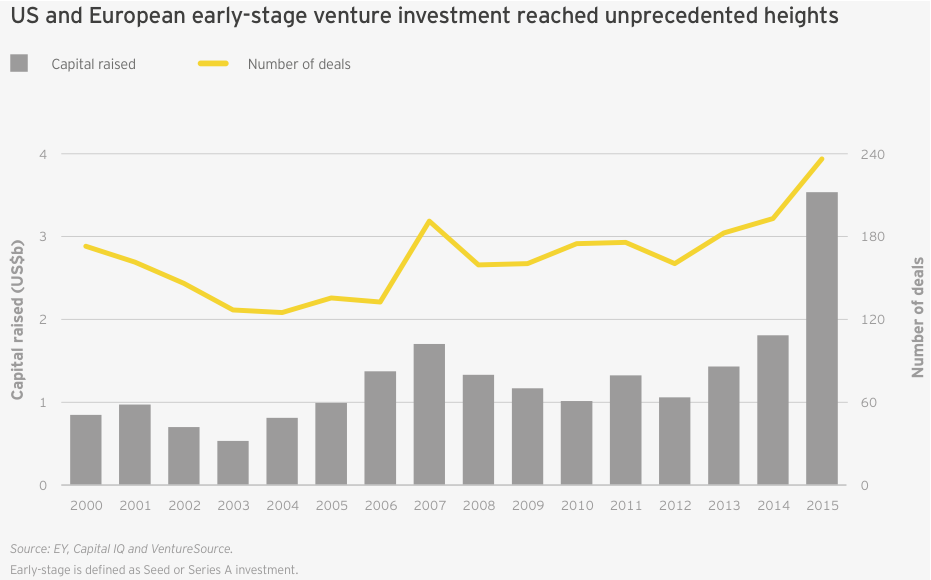
While the public markets may be pausing to digest the last three years’ worth of new biotech offerings, venture activity continues apace. In 2015, venture financing reached a record US$11.8 billion, topping the previous record of US$8.2 billion set in 2014 and more than double the previous 15-year average of US$5.6 billion. Again, the bulk of that activity was based in the US, with 79% of venture dollars deployed stateside. Across both continents, biotech companies raised an unprecedented US$3.5 billion over 235 early-stage financing rounds (seed and Series A). Despite the pullback in the public markets, there’s reason to believe continued venture support for biotech remains sustainable.
For starters, that’s because of the extraordinary scientific progress underpinning much of the ongoing company creation — see, for example, enabling tools like CRISPR in gene editing and new insights into immuno-oncology. But the recent renaissance also has its roots in the extended downturn of 2008–12. That lull fueled a burst of business model and financing creativity from existing biotech venture capitalists (VCs), including asset-centric and tax-efficient limited liability company (LLC) umbrella structures.
The lull also expanded and cemented the importance of corporate venture capital as a permanent fixture in biotech financing, whether strategics invested directly or acted as limited partners in traditional venture funds. In fact, the National Venture Capital Association cites biopharma corporate venture support to the tune of US$1.2 billion across 133 deals in 2015.
Meanwhile, as a result of hot IPO and M&A climates, venture investors of all stripes have enjoyed atypical successes and, importantly, liquidity. This has helped to pull other non-traditional VC investors, including crossover investors, into biotech deals. For example, the Alaska Permanent Fund invested in both the Series A round of Denali Therapeutics (May 2015) and Codiak Biosciences’ Series A and B rounds (late 2015 and early 2016).
However long the current lull in public-market biotech financing, the industry is better equipped for the biotech winter than during past downturns in biotech’s funding cycle.
Overall, the vast majority of follow-on capital was raised by development-stage biotechs, many of which are developing cutting-edge science in areas such as gene and cell therapy.
Key financing insights
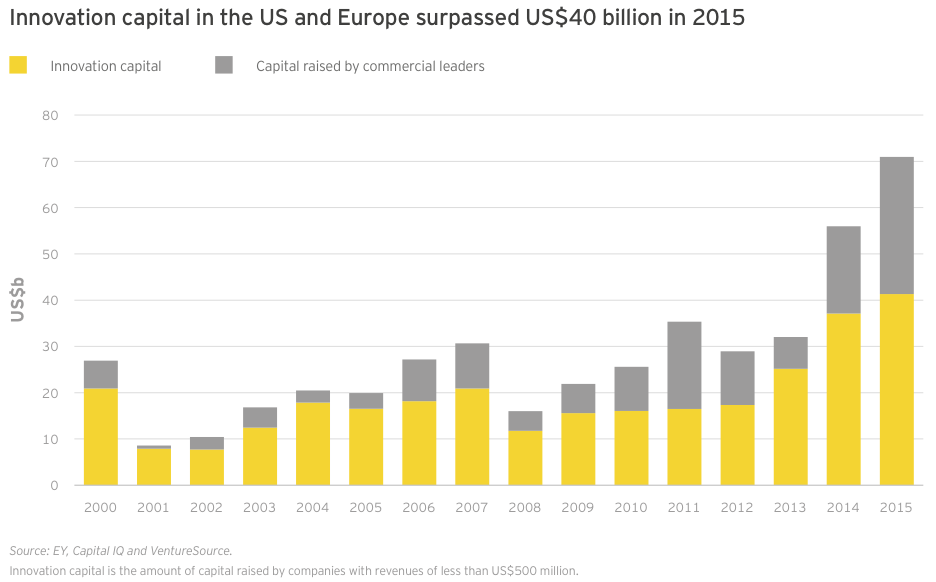
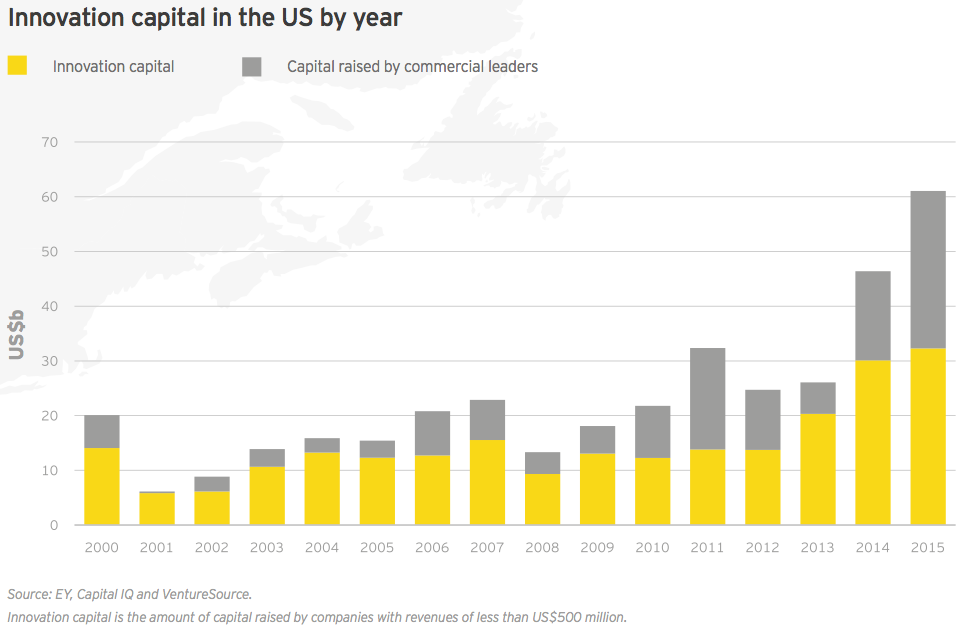
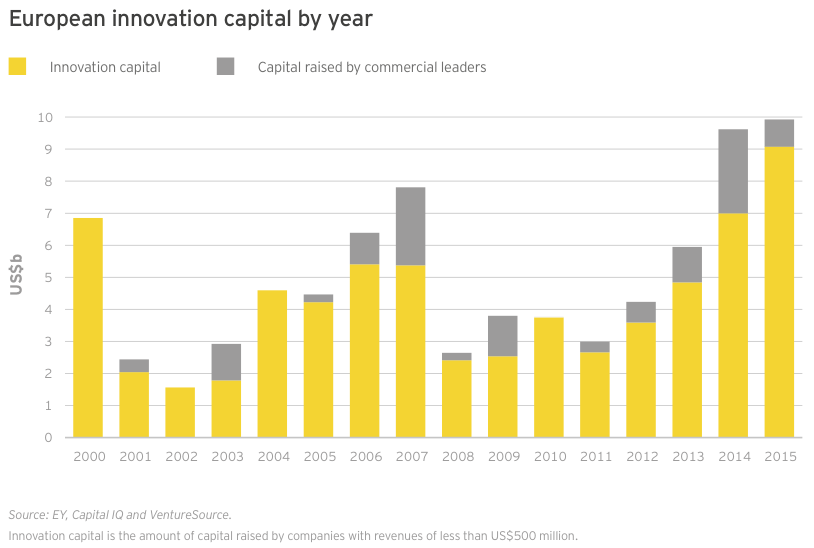
Innovation capital — cash raised by companies with revenues of less than US$500 million — in the US and Europe combined to reach its highest-ever total in 2015, eclipsing US$41 billion (dwarfing the 15-year average of US$17.4 billion). This total included all venture, IPO and nearly all follow-on deals for the year, as well as a smattering of smaller debt offerings. Large debt offerings by Gilead, Celgene, Amgen and Biogen comprised the vast majority of the US$29.7 billion raised by the sector’s commercial leaders, making innovation capital’s share of total financing only 58% for the year.
Biotechs in the US and Europe raised an impressive US$3.5 billion in 235 seed and Series A financings, setting records for both dollars raised and deal volume. Boston Pharmaceuticals raised the largest-ever biotech seed investment, pulling in US$600 million in November 2015 from Gurnet Point Capital, a US$2 billion life sciences and health care investment firm founded by Serono billionaire Ernesto Bertarelli and helmed by former Sanofi CEO Chris Viehbacher.
Gurnet is not an ordinary VC, and Boston Pharma isn’t an ordinary biotech. The company is pursuing an alternative search-and-develop model more typical of specialty pharma to bring in early-stage clinical assets and shepherd them through to Phase III.
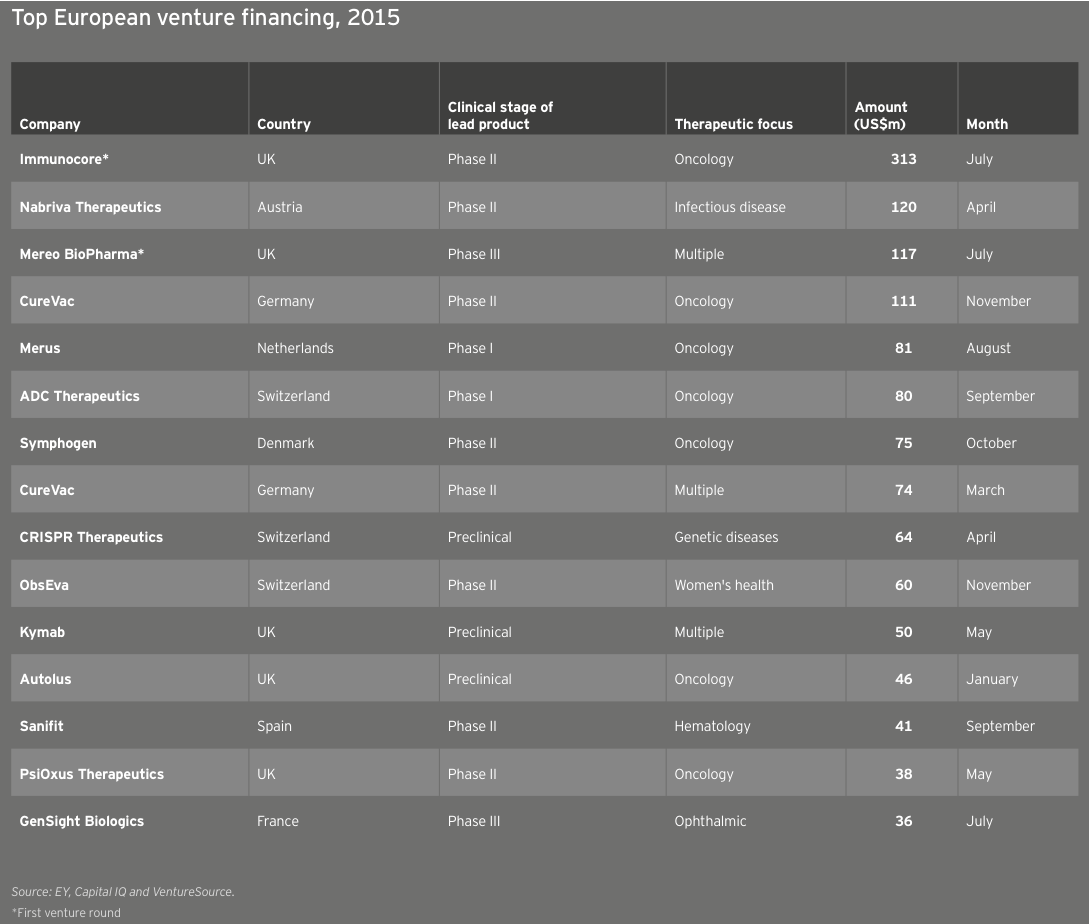
In Europe, the immuno-oncology start-up Immunocore raised a US$313 million Series A and earned a valuation of US$1 billion in Europe’s largest-ever venture round.
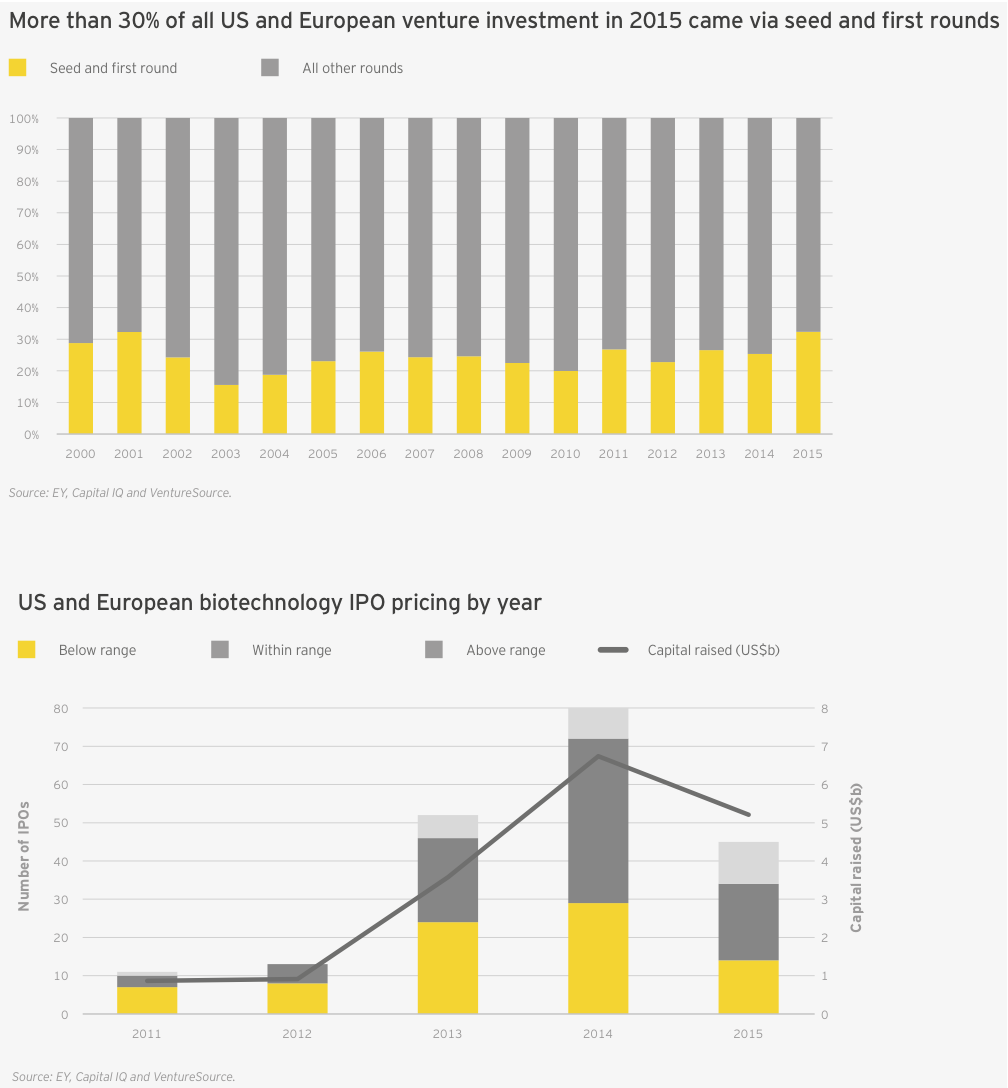
That burst of early-stage financing meant the proportion of venture funds going to early-stage biotech companies was greater than in any year this millennium, topping 30% for the first time since 2001 (up from 25% in 2014; the 15-year average is 24%). This was in large part due to the massive first financing rounds raised by the likes of Denali Therapeutics (US$217 million in May 2015), Boston Pharmaceuticals (US$600 million in November 2015) and the cancer vaccine start-up Gritstone Oncology (US$102 million in October 2015).
In Europe alone, the early-stage share of venture financing was an incredible 41%, a proportion driven by Immunocore’s US$313 million Series A and a US$119 million Series A from Mereo BioPharma Group, which launched in July with three clinical-stage development programs licensed from Novartis. (See Denise Scots-Knight’s perspective, “Partnering with pharma to bring innovations to market”.)
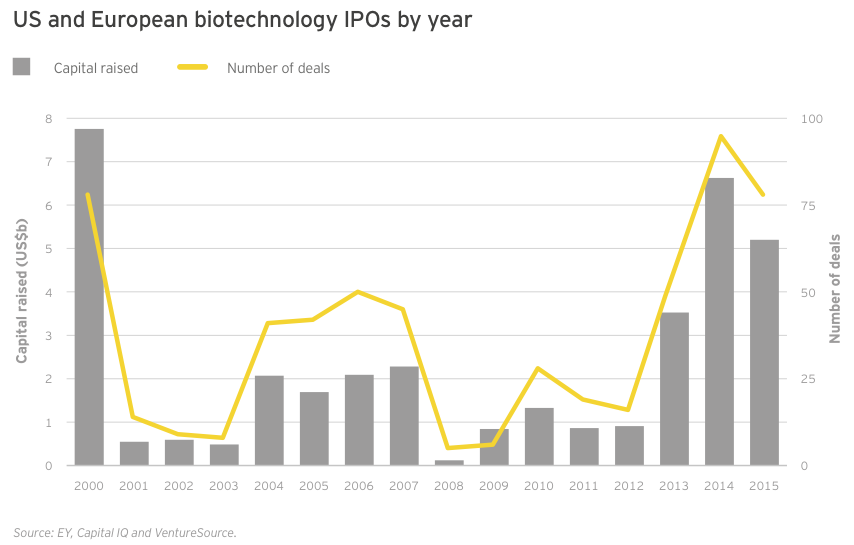
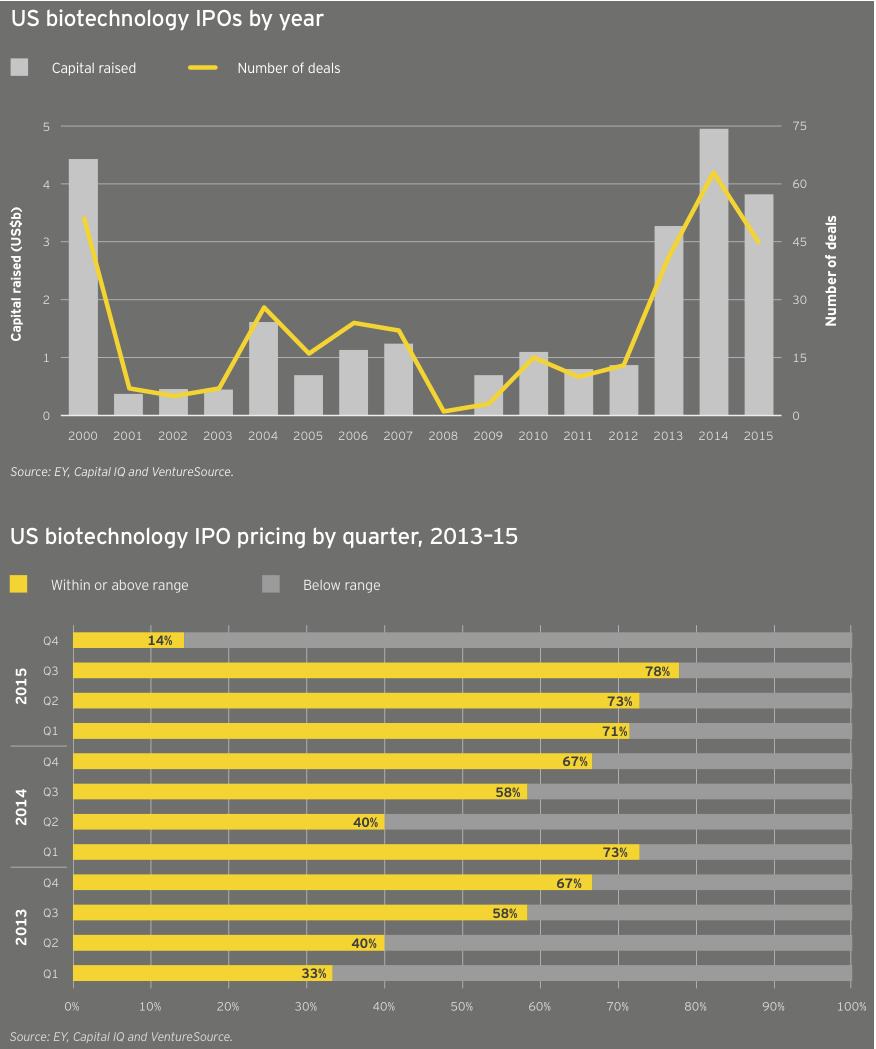
The last quarter of 2015 could point to the beginning of the end in the long-running biotech IPO boom. Still, for the year, 2015 was no slouch. Seventy-eight biotechs went public in 2015, compared with 95 (the all-time record) in 2014. The 2015 figure was still more than twice the annual average over the past 15 years (34) and tied 2000 for the second-most ever.
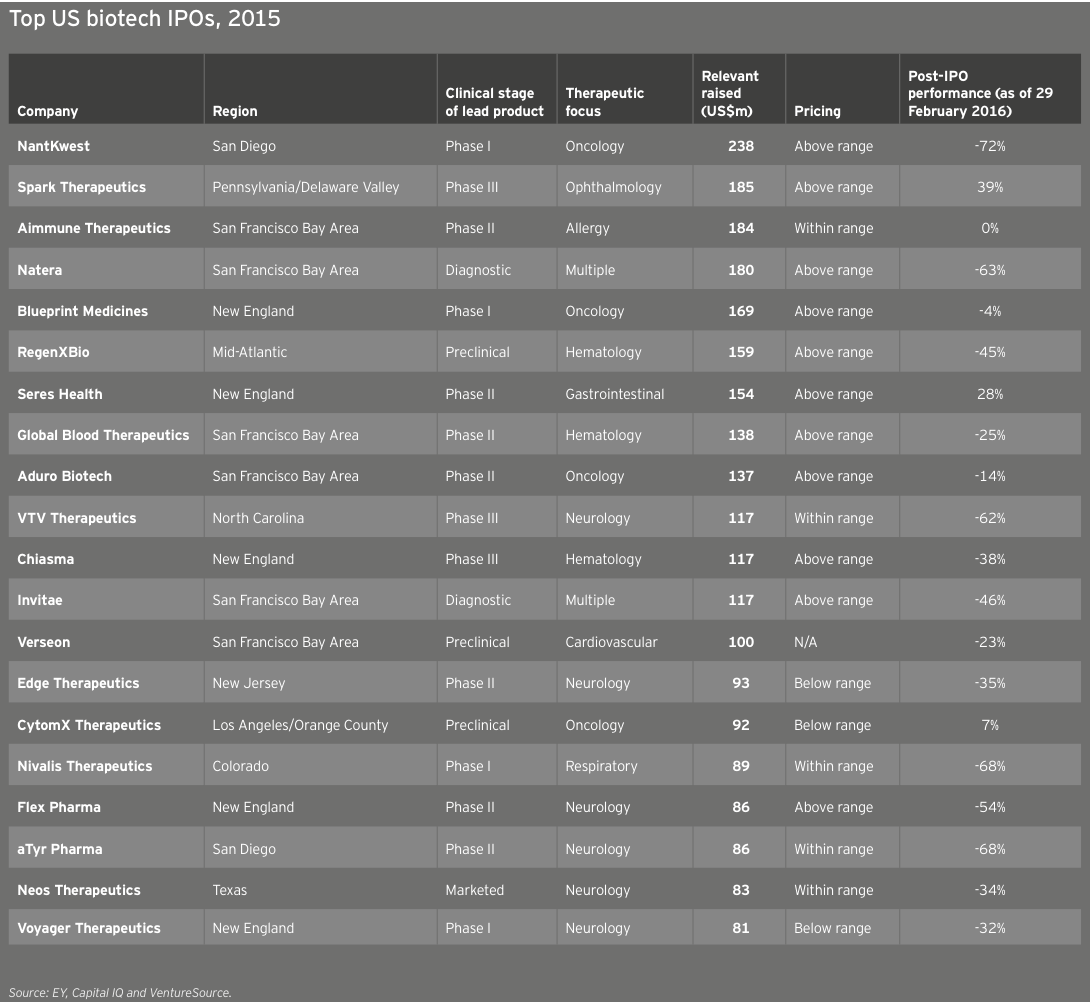
Biotechs raised US$5.2 billion in these debut offerings (down 22% from 2014’s US$6.7 billion), the industry’s third-highest IPO total. The average amount raised was similar to the 2014 mean (US$67 million versus US$71 million), with the top spots going to oncology-focused NantKwest in the US and Adaptimmune in Europe. NantKwest’s US$238 million IPO established a record post-money valuation of US$2.6 billion, quite a feat for a company with a lead product in Phase 1. Adaptimmune’s US$191 million raise showcased investors’ ongoing enthusiasm for immuno-oncology. IPOs in the US accounted for 45 of the deals, of which 34 raised US$50 million or more and 13 raised at least US$100 million.
United States
In the US, 2015 featured strong financing performance across every category. With a total of US$61.1 billion raised (up 32% from 2014’s then-record US$46.4 billion), the year featured the highest-ever venture capital, debt and follow-on financing totals. Fourth quarter financing slowed significantly, with only US$4.6 billion of the year’s total coming during the last three months of 2015.
US commercial leaders conducted only seven financing rounds in 2015, including four large debt deals. However, those financings accounted for US$28.8 billion in new capital, a new record. US innovation capital (US$32.3 billion) also reached a new record in 2015, narrowly topping 2014’s record high of US$30.1 billion.
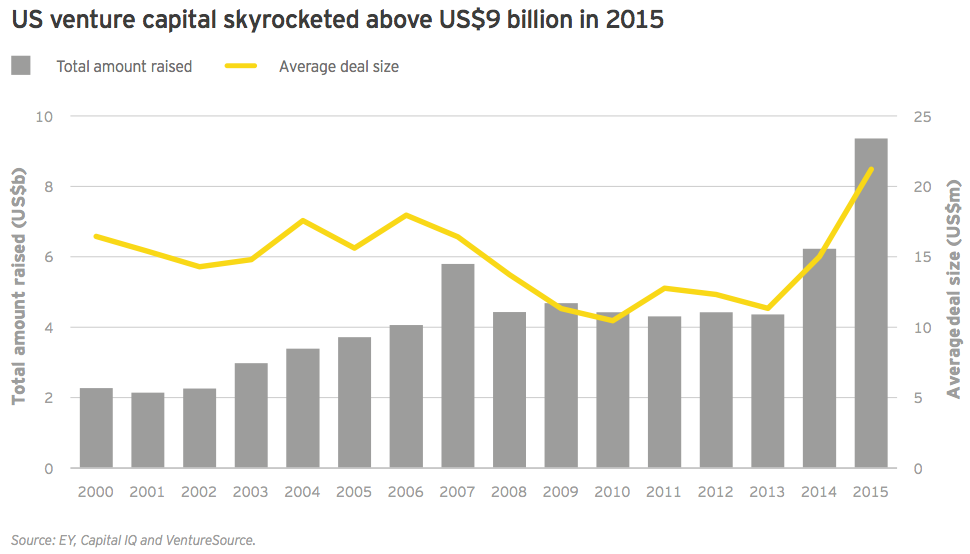
In 2015, US biotechs set multiple records in the venture capital financing category: total dollars raised (US$9.4 billion), largest number of venture rounds (441) and average deal size (US$21.2 million). These figures were no doubt bolstered by record participation from corporate venture funds, which were increasingly motivated by a strategic financing remit, and crossover investors, which saw increasing exit opportunities via the public markets and acquisitive pharmaceutical companies. Importantly, venture capital was the one US financing category that didn’t experience a marked slowdown in the fourth quarter, suggesting that, at least for now, interest in funding private biotechs remains strong amid a reduced public-market appetite.
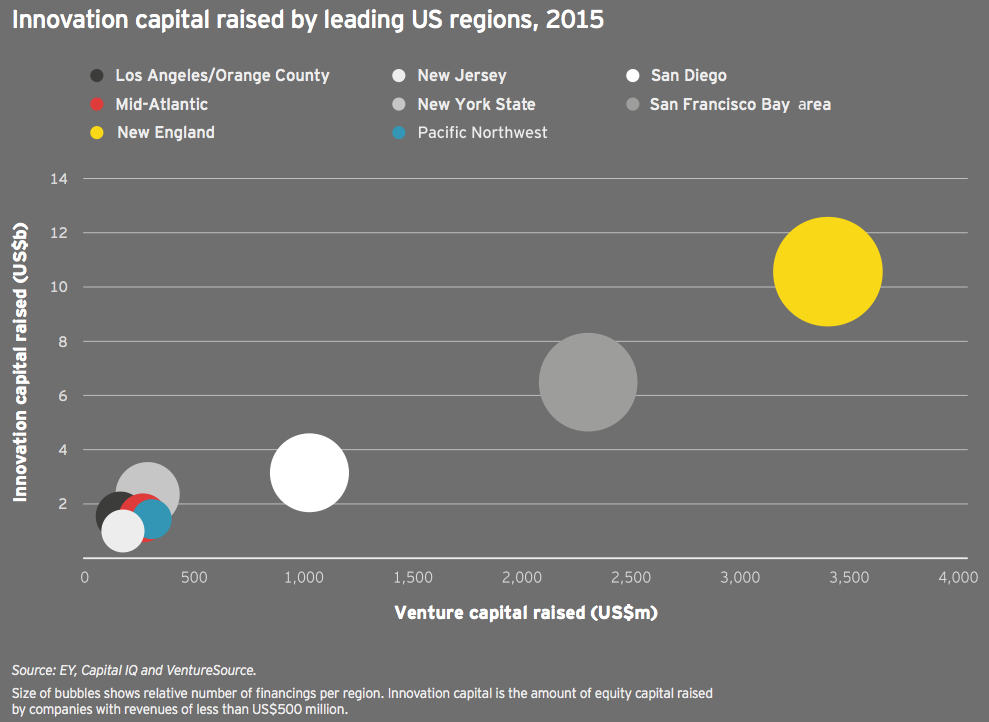
Once again, biotech’s familiar geographic strongholds topped the charts in innovation capital, with New England (US$10.6 billion and 175 deals) maintaining its first place position and adding some distance between itself and the competition. In fact, the top four (and five of the top six) financings went to companies located in Cambridge, Massachusetts. San Francisco Bay area companies raised US$6.5 billion across 142 deals. Looking at just venture capital and IPO investment, New England companies raised US$4.3 billion, while Bay Area companies hauled in US$3.4 billion.
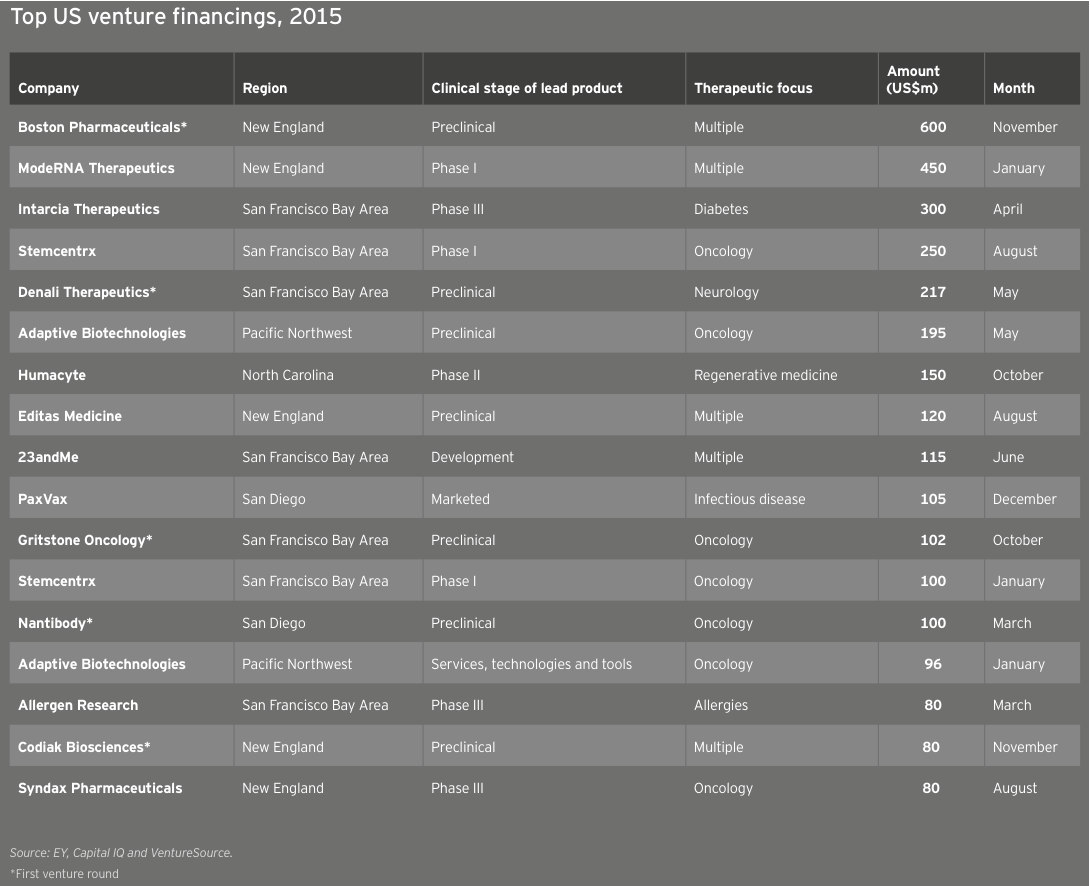
The top US venture financings of the year feature several companies — and investors — that are far from traditional. These include Boston Pharmaceuticals with its specialty pharma approach, Moderna Therapeutics with its several-companies-under-one-umbrella structure and Intarcia Therapeutics, which created a diabetes drug-device hybrid. Another company that made headlines in 2015: Stemcentrx, an oncology stem cell developer that has five therapies in the clinic and raised US$350 million in two rounds.
Although these outliers may sit at the top of the chart, they hardly tell the year’s whole story. Thirteen venture rounds topped the US$100 million mark in 2015, compared with five in 2014. In all, there were 26 venture rounds that each raised at least US$70 million in 2015, versus only 10 in 2014 and 3 in 2013. Oncology-focused biotechs garnered 6 of the top 15 venture rounds. Reflecting a penchant for investors to “go big” in early rounds this past year, 5 of the top 17 venture rounds were for first-round financings.
The ability of companies and bankers to gauge interest in IPOs — as measured by whether the IPOs are priced within their expected ranges — held relatively steady throughout the first three quarters of 2015. But during the fourth quarter, only a third of the 17 US and European biotechs priced within their intended ranges, off from nearly three-quarters in the third quarter. This trend was even more pronounced in the US, where only one biotech was priced above or within its intended range during the quarter.
Overall, only 44% of all newly public biotechs had positive share returns in 2015. The average post-IPO performance at 31 December 2015, was 3.8% (compared with an average 40% gain at the same date for companies that went public in 2013; for companies that debuted in 2014, that gain was an astounding average 87%). Dermatology-focused Aclaris Therapeutics led 2015’s gainers, up 145% on the year since its October 2015 IPO. Notably, both NantKwest (–31%) and Adaptimmune (–29%) were off significantly from their IPO prices by the end of 2015.
Europe
The US wasn’t alone in setting consecutive financing records in 2015. European biotechnology financings nudged upward in 2015 after soaring in 2014. The 3% year-on-year increase to US$9.9 billion is Europe’s all-time high and, as in the US, featured high-water marks for venture funding (US$2.5 billion) and follow-on rounds (US$3.7 billion). Europe significantly trailed the US, however, in debt financing, raising only US$2.3 billion in 2015, about one-thirteenth what US-based companies amassed. A full third of the European debt came from Horizon Pharma’s two offerings totaling US$875 million. In addition to its debt raises, the Ireland-based specialty pharma also secured nearly US$500 million in a follow-on offering, making the company Europe’s most successful fundraiser in 2015.
Europe’s biotech commercial leaders are, on the whole, less mature than their US counterparts, and this long-standing debt divide is likely to remain, unless several US biotech leaders seek mergers with Europe-domiciled competitors.
Of the nearly US$10 billion in capital raised by European biotechs, US$9.1 billion (91%) was innovation capital. This total represents a 29% increase over 2014’s then-record US$7.0 billion. As in the US, European biotech financings dwindled in the second half of the year, especially the fourth quarter. Only about 30% of the total capital was raised in the second half of 2015 (US$3 billion of the total), though venture capital bucked the trend, with about two-thirds of Europe’s 2015 venture financing raised in the second half of the year.
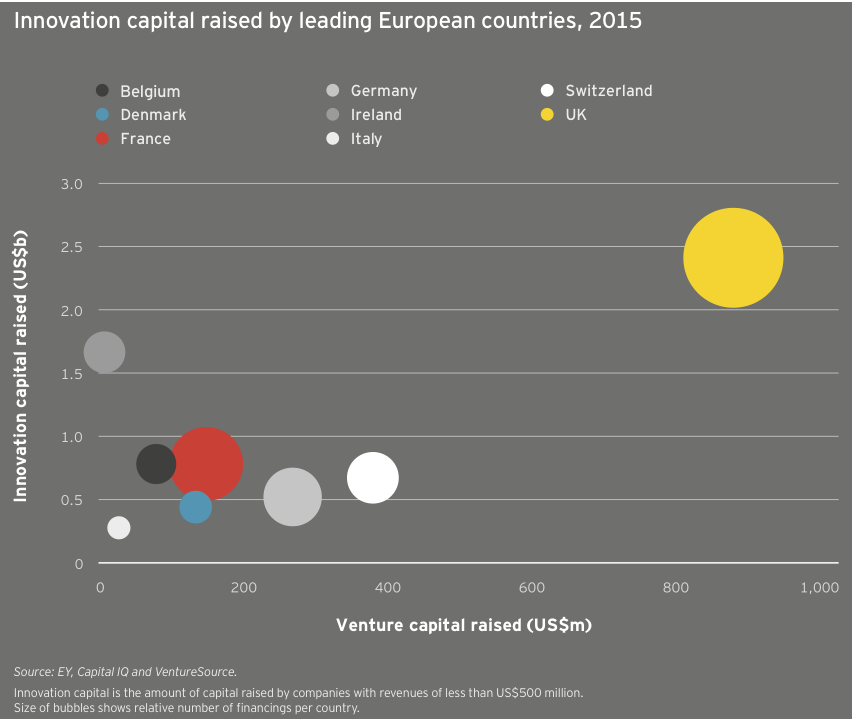
Among European nations, the UK was the top destination for innovation capital in 2015, leading in total funding (US$2.4 billion), venture funding (US$884 million) and number of investments (87). Thanks in large part to Horizon’s debt and follow-on deals, Ireland took second place in total investment with US$1.7 billion, ahead of France and Belgium (US$782 million and US$781 million, respectively). Switzerland and Germany, meanwhile, took second and third place in venture funding with US$381 million and US$270 million, respectively.
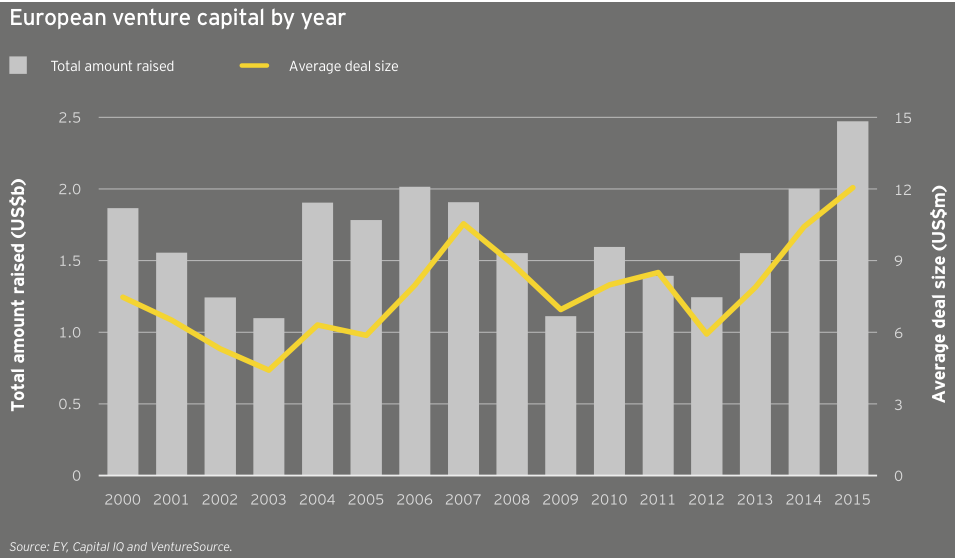
European biotechs raised US$2.5 billion in venture capital in 2015, a new record aided in part by participation from corporate venture capitalists and other non-traditional sources of capital, including the relative biotech newcomer Woodford Investment Management. The average deal size also reached a new high, US$12.1 million. Meanwhile, the 204 venture rounds were the continent’s highest since 2012. The year featured 11 venture rounds of at least US$50 million and four rounds topping US$100 million. Unsurprisingly, oncology-focused biotechs provided a significant funding boost, with Immunocore, Merus, ADC Therapeutics and Symphogen leading the way. The anti-infectives specialist Nabriva Therapeutics, a 2006 spin-out from Sandoz, raised Europe’s second-largest venture round, an April 2015 US$120 million Series B led by crossover investors Vivo Capital and Orbimed Advisors. Nabriva followed that mezzanine round with its NASDAQ IPO, which raised US$106 million in September 2015.
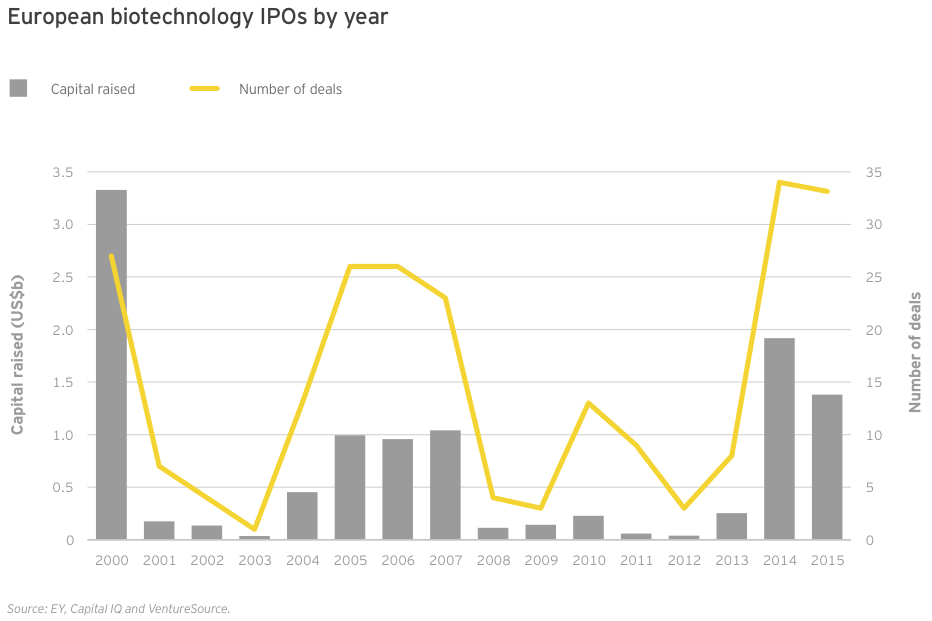
2014 and 2015 were two of Europe’s most impressive IPO years, even as the climate lagged behind that of the US. Thirty-three European companies went public in 2015 (not all of them on European exchanges, as Nabriva illustrates), down slightly from 34 in 2014. Total fundraising via IPOs was also down, from US$1.9 billion in 2014 to US$1.4 billion in 2015, as was the average amount raised (from US$56 million in 2014 to US$42 million in 2015). UK immunotherapy specialist Adaptimmune topped the charts with its US$191 million IPO in May 2015, but like the majority of the top 20 European IPOs, the company’s share price had fallen as of December 31 relative to its IPO price.

Partnering with pharma to bring innovations to market
For the last several years, big pharma companies have been under extraordinary P&L pressure due to a changing reimbursement climate and patent expirations. As a result, even the biggest pharmas have taken a more rigorous look at their portfolios, and a number of promising programs have fallen below the funding priority line.
In 2014, I realized it was the right time to explore the possibility of creating a start-up that leveraged third-party funding to in-license or acquire a portfolio of diversified products from pharmas. With the backing of two institutional investors, Invesco Perpetual and Woodford Investment Management, and exclusivity on a portfolio of three products from Novartis Pharmaceuticals, I and others from Phase4 Partners launched Mereo BioPharma in July 2015.
Our team decided to focus on in-licensing Phase II assets for a few reasons. First, Phase II assets come with clinical proof-of-concept data that helps mitigate the financial risk for us and our backers. Second, this strategy allows us the option to capture value quickly via partnering as products transition from Phase II to Phase III. Third, since most of the P&L pressure comes at this Phase II/III transition, we reasoned that innovative products might fall out of favor not because of their therapeutic potential but because of budgetary considerations.
We licensed three very different mid-stage Novartis products: BPS-804, a monoclonal antibody to treat osteogenesis imperfecta, an orphan disease also known as brittle bone disease; BCT-197, an oral therapy for acute exacerbations of chronic obstructive pulmonary disease; and BGS-649 for hypogonadal hypogonadism. This product diversity was intentional. If one of the products is successful, there is a positive return on the equity story. However, if there is a problem with one of the assets, then because they are so distinct, it doesn’t impact the other ongoing programs.
Right out of the gate, we had considerable data for each of the projects. By the end of the year, just over 18 months from Mereo’s inception and first-round financing, we will have a registration study and Phase II and Phase IIb programs ongoing. That’s a very steep slope for development, but we are able to balance the demands by working closely with the contract research organization, ICON.
Not your typical pharma spinout
In-licensing from pharma is notoriously difficult to do. For these deals to work, there needs to be commitment at the top of the organization. If that level of commitment isn’t there, there can be huge internal resistance to letting the “babies” go. We talked to a number of big pharma companies as we explored this model. It became clear that Novartis was not only interested in the strategic approach but had sufficient Phase II assets and was willing to work with us to build a product portfolio.
Structuring the deal so it was truly an off-P&L financing for pharma wasn’t trivial either. Novartis had to be able to show that it couldn’t indirectly control our activities going forward. That meant no buyback rights or rights of first refusal tied to any of the products. In addition, to create alignment with our investors, there was no up-front cash in exchange for the products. Novartis owns a 19.5% stake in the company and is Mereo’s exclusive partner for new products until July 2016.
There are a number of ways this deal is different from a traditional pharma spinout. For starters, Novartis’ return is linked to the success of the products. The big pharma will receive either a royalty on sales or a share of the licensing income that Mereo receives. There are no intermediate milestones, and, for any out-licensing partnerships we might negotiate, Novartis has no input into how we structure the deals. In essence, other than its equity investment, Novartis carries no product risk. All the risk is being financed by our other investors.
With this kind of deal structure, Novartis still has the potential to win big via its equity stake. And since the value of that equity grows if the products are successful, Novartis remains closely aligned with Mereo’s ambitions to be a fully developed specialty pharma company. It’s also in Novartis’ interest if we in-license products from other biopharmas, since the probability that at least one product will succeed increases as we expand our portfolio.
We’ve structured Mereo such that each asset resides in a separate subsidiary underneath the umbrella organization. It’s asset-centric but not in the way most people use the term, which is to invest in one product and then sell it off. In this instance, our goal is to structure the organization in a tax-efficient manner that can enable partnering, while creating equity value within the core operating company.
We will continue to look for additional in-licensing or acquisition opportunities; our analysis suggests a portfolio of at least five assets gives us optimal diversification. In future deals, we have the flexibility to award additional partners equity. We will continue to be driven by the quality of the assets, but we will try to avoid — never say “never” — up-front cash.
In-licensing from pharma is notoriously difficult to do. For these deals to work, there needs to be commitment at the top of the organization.
(Denise Scots-Knight, Chief Executive Officer and Cofounder, Mereo BioPharma Group)
Winning in immuno-oncology: it takes a portfolio
Immuno-oncology (IO) has changed the game for cancer drug developers. Chasing single-agent cancer blockbusters has been overtaken by clinical exploration of a rapidly evolving kaleidoscope of combinations involving novel cancer immunotherapies. To win in IO, one must use good judgment to balance risks across multiple dimensions.
Immuno-oncology has become a key focus area in oncology drug discovery and development. The complexity of this promising field makes it different in many ways from traditional drug development. IO treatments span many modalities, from cell therapies to antibodies to small molecules. The science is evolving rapidly, and it is difficult to predict which products will ultimately be best-in-class. Furthermore, it has become apparent that achieving optimal treatment efficacy often requires combinations of drugs that engage the immune system across multiple mechanisms.
To create these new IO combinations, companies must go “beyond borders” and bridge barriers between drug classes, technologies and companies.
Building a portfolio of IO assets through strong external relationships and partnering
How does a company assemble the right capabilities to compete in such a rapidly evolving field? A key part of the equation is business development. Collaboration to gain access to early innovation has long been a mainstay for pharmaceutical companies. Ideally, these alliances include many different kinds of players: big companies, smaller biotechs and academic partners.
Of course, building new strategies and assets in a rapidly evolving area like IO begins from the foundation of a company’s existing capabilities. Strong competency in IO requires world-class clinical, regulatory and commercial experience to identify potentially first-in-class IO combinations and the right trials. This is particularly important given the novelty of IO therapies, where there is a very limited foundation of clinical data to build upon.
At Baxalta, we have continually emphasized external innovation. Our size — not too large and not too small — is an asset, allowing us to be nimble as we create IO partnerships. And recently, we have been able to expand our IO capabilities thanks to two new alliances: one with Symphogen, announced in January, to gain access to checkpoint inhibitors and modulators, and another with Precision Biosciences, signed in February, which expands our capabilities in gene editing for CAR-T cell therapies. At the same time, Baxalta’s longstanding capabilities in the complex fields of hematology and immunology, along with our more newly established oncology franchise, have critically informed how we understand and approach IO.
(John Orloff, Global Head of R&D and Chief Scientific Officer, Baxalta)
An IO strategy to “cut a wide swath”: broad capabilities and capital efficiency
Via partnerships, we have implemented a risk-balanced, capital-efficient IO strategy that integrates a range of capabilities. Our IO investments span three major domains, each representing a different level of risk:
► Lower Risk: Established IO areas with approved products and derisked asset classes
► Medium Risk: Fast-follower areas where preliminary proof of concept or emerging clinical data exist
► Higher Risk: Novel therapies where it may be possible to be a leader in first-in-class assets
Prior to investing, we map a portfolio of IO modalities and technologies based on their scientific risk profiles and competitive intensity (see accompanying figure). Products in more developed areas may have lower scientific risk but cost more to license because there is obviously greater demand for products with proof-of-concept data.
Evaluating IO modalities and technologies via such a framework can help a company identify the ones that best fit within its portfolio. Certainly, this strategy has helped Baxalta articulate its “sweet spot” and maintain its strategic focus.
Such single-mindedness is essential given the fierce competition for assets and the breadth of indications that might be treated by these medicines.
In order to implement our strategy while maintaining capital efficiency, we have embraced a range of deal structures, including option-based deals. These deal structures are a cost-efficient way for us to expand our R&D portfolio and are attractive to biotech partners that want to retain their autonomy while leveraging the development, regulatory and commercialization expertise of a bigger biopharma partner with global presence and reach.
Winning IO strategies have advantages far beyond a company’s oncology business. These strategies can be synergistic with other therapeutic areas in a company. For example, the new IO capabilities we have built through our R&D partnerships with Symphogen and Precision BioSciences build on our own internal competencies in immunology, gene therapy and cell therapy, as well as oncology. Also, the new technical skills needed in IO, such as gene editing, can be applied in other disease areas.
Our goal is to create efficacious, patient-focused medicines that are truly differentiated. No matter the disease area, therapeutic complexity is only increasing. Going forward, the successful companies will be the ones that systematically and resolutely create a risk-adjusted portfolio, leveraging partnerships and collaborations to share access to the best assets and technologies and accelerate innovation.
(Stefan Krauss, Senior Director, Business Development and Licensing, Baxalta)

Deals
Biotech deal market soars
The same sector optimism that spurred biotech’s financing renaissance from 2013 through 2015 has also lifted alliance and acquisition activity. In 2015, scientific advances in critical therapeutic areas and a more positive regulatory environment gave both strategic buyers and investors greater confidence when it came time to place their bets.
Facing organic growth challenges, pharma acquirers continued to see M&A as a quicker and less risky way to fill pipeline and revenue gaps. Public investors, meanwhile, continued to provide biotech companies with significant capital via initial public offerings (IPOs) and follow-on raises. This prolonged access to capital and the resulting competition for assets meant biotech management teams enjoyed multiple strategic alternatives, even as valuations began to surpass pharmaceutical buyers’ comfort levels.
Indeed, as 2014’s warm transactional climate extended into 2015, the biotech sector set new standards in multiple categories:
► Potential value of M&A deals (US$100.2 billion)
► Volume of M&A deals (89 deals with disclosed terms)
► Potential value of alliances (US$55.4 billion)
Most of the activity involved US-based biotechs. This cohort accounted for roughly 90% of all M&A dollars (US$90 billion) and about three-quarters of 2015’s deal volume. (Of those 89 biotechs acquired during 2015, 64 were based in the US.) US biotechs also captured 78% of the year’s potential alliance value, a metric that includes milestones and earn-outs, but not royalties.
Strategic alliances: big biotechs flex their muscle
For deals with disclosed terms, 2015’s 173 alliances, worth potentially US$55.4 billion, eclipsed 2014’s already robust totals. The average potential deal value also increased, rising from US$309 million in 2014 to US$320 million in 2015. This increase was due to a notable uptick in biotech–biotech alliances.
The potential value of intra-biotech alliances doubled from 2014 to 2015, reaching a new record of US$20.9 billion. The new high suggests that, on one hand, the industry’s largest biotechs are more regularly competing with big pharma — in terms of both capital and cultural fit — to become smaller biotechs’ preferred partners. (As we will see, biotech–biotech M&A enjoyed similarly impressive growth.) On the other hand, it also underscores the notion that big biotechs have in many cases become saddled with the same growth challenges that have made big pharmaceutical companies such avid dealmakers.
Although a significant percentage of total alliance value was tied up in earn-outs and royalty payments, biotech sellers in 2015 took in more than US$6 billion in total up-front payments, a record total. The ratio of up-front cash to total deal value reached 11%, ticking up slightly for the fourth consecutive year.
A closer analysis reveals a more nuanced picture. Interestingly, those up-front payments included a record amount tied to equity stakes. In 2015, biotechs issued equity worth more than US$1.8 billion to strategic alliance partners, the most in any year since at least 2006. For buyers accessing biotech assets and technologies, buying equity — often at a massive premium — can be both P&L–sparing and a sign of long-term interest in the partnership.
Much of the alliance activity focused on technologies or products in the gene editing, gene therapy or immuno-oncology arenas. Vertex Pharmaceuticals’ October 2015 alliance with Swiss biotech CRISPR Therapeutics is the year’s most potentially lucrative. That deal, worth up to US$2.6 billion, included a US$30 million equity investment as well as an up-front cash payment of US$70 million. It aims to use CRISPR’s gene editing platform to correct mutations in the cystic fibrosis transmembrane conductance regulator (CFTR) gene. In December 2015, CRISPR, which also counts GlaxoSmithKline and Celgene among its investors, signed another strategic arrangement, forming a rare joint venture (JV) with Bayer’s new Bayer Lifescience Center unit. As part of the JV, the German pharma will invest US$335 million to advance therapies in blood disorders, blindness and cardiovascular disease.
Juno Therapeutics, meanwhile, received the year’s largest up-front alliance payment. Celgene paid US$1 billion, including US$850 million for a 10% equity stake in the biotech, to cement the broad chimeric antigen receptor-T-cell (CAR-T) deal, which gives the New Jersey-based biotech commercial options outside the US to Juno’s programs for 10 years. What’s more, Celgene secured rights — under certain conditions — to raise its stake in Juno to up to 30% over about a decade. The deal’s structure enables a symbiotic long-term alliance in the style of Roche–Genentech or Sanofi-Regeneron. It also makes Juno less vulnerable to the ups and downs of the capital markets.
Celgene remains one of the most active strategic investors in the industry; it is also one of the most active dealmakers. In 2015, the big biotech struck a dozen deals and paid US$1.6 billion up front across four oncology alliances, in addition to its US$7.2 billion acquisition of the autoimmune-focused biotech Receptos.
Record year for M&A
Although large biopharma companies have made strides in improving R&D productivity and enjoyed regulatory successes over the past few years, most still require M&A to reach their growth goals. 2015 showcased a variety of biopharma trends: targeted divestitures, focused acquisitions and significant competition for biotech assets, which, along with interest from public market investors, drove valuations higher for much of the year. Interestingly, these higher valuations may have even blunted some pharmas’ naturally acquisitive instincts.
AbbVie’s acquisition of Imbruvica developer Pharmacyclics for US$21 billion was the year’s largest biotech acquisition and illustrated the competitive deal environment. As a result of the acquisition, AbbVie gained an immediate and significant presence in the hematology/oncology marketplace, but only partial ownership of Imbruvica.
Recall that in 2011, Pharmacyclics licensed its key asset to Johnson & Johnson. To most industry observers, that previous alliance meant the diversified pharma was Pharmacyclics’ most natural suitor. Yet competition for the recently approved asset was fierce: in addition to bids by J&J and AbbVie, a proposal by a third undisclosed pharma helped drive the terms above the US$20 billion mark.
Analysts questioned the take-out valuation, which was about a 40% premium to where the biotech’s shares were trading before deal rumors started. However, most understood the underlying strategy: buying Pharmacyclics helps AbbVie diversify its revenue base as potential biosimilar competition looms for its autoimmune therapy Humira. That product, which generated more than US$14 billion in 2015 sales, accounted for more than 61% of AbbVie’s total 2015 revenue.
The AbbVie/Pharmacyclics transaction may be better understood as 2015’s exception rather than its rule. In fact, the biotechnology sector’s record M&A metrics arrive despite the professed reluctance of most buyers to overspend on biotech targets. Throughout 2015, large pharmaceutical companies repeatedly cautioned that biotech valuations were giving executives pause and therefore analysts shouldn’t expect a deal deluge.
Indeed, one of the most talked about “buyers” in 2015 was Gilead Sciences, a company that has historically wielded its M&A acumen and strong balance sheet to bolster its product pipeline. In September 2015, the company raised US$10 billion in debt, a move that increased analysts’ expectations that the big biotech would pursue an acquisition. As 2016 unfolds, Gilead has yet to announce a major transaction. However, biotech valuations have dropped precipitously due to a variety of factors, including concerns over drug pricing, uncertainty in the global market and sector rotation. With deal valuations no longer eye-popping, Gilead and other interested acquirers may be motivated to look anew at others’ promising pipeline assets.
2015 showcased a variety of biopharma trends: targeted divestitures, focused acquisitions and significant competition for biotech assets.
Key dealmaking insights
Merger and acquisition activity in the US and Europe reached new heights in 2015 as total potential value and volume records were set for our universe of biotechnology companies. Cumulative deal value jumped 120% over 2014, and, at more than US$100 billion, nearly exceeded the previous three years’ combined value.
The year’s 89 M&A deals easily surpassed 2014’s 69 deals, the previous 10-year high. Seven megadeals — deals worth US$5 billion or more — were responsible for a significant chunk of that aggregate total. Overall, the sector saw 20 acquisitions valued at over US$1 billion, compared with 10 each in 2013 and 2014.
Celgene’s US$7.2 billion acquisition of Receptos and Alexion’s US$8.4 billion acquisition of Synageva helped to push biotech-biotech M&A metrics to all-time highs and signaled robust competition for the kinds of assets only big pharma might have been able to acquire in years past. Thanks largely to half a dozen large acquisitions, biotech-biotech M&A deals were valued at US$37.1 billion in total, nearly doubling the metric’s previous high.
With the exception of Valeant Pharmaceuticals’ US$11 billion purchase of Salix Pharmaceuticals, specialty pharmaceutical companies were less active acquirers in 2015. As Valeant contends with leadership changes and a re-examination of its M&A-driven business model, the subsector will likely remain largely on the sidelines in 2016. The one exception could be Allergan. That Irish specialty pharma, newly independent after new US Treasury rules helped to scuttle its mega-merger with Pfizer, may look for additional buying opportunities once the sale of its generics business to Teva Pharmaceutical Industries closes.
The astounding growth in biotech-biotech strategic alliance value and volume pushed 2015’s cumulative potential deal value (again, for deals whose terms were disclosed) above 2014’s already robust and record total.
Overall, there were 17 alliances forged in 2015 with total potential value greater than US$1 billion, compared with 12 in 2014 and only five in 2013. Vertex’s alliance with CRISPR Therapeutics was the most potentially lucrative of several deals in which larger biopharma players secured access to innovative technology platforms.
Of the top 15 strategic alliances by potential deal value, nine give large biotechs or pharmaceutical companies broad, or expanded, access to a biotech’s technology platform. The latter situation was true for Sanofi and Regeneron, whose partnership around Regeneron’s antibody technology platform dates back to 2007.
These alliances, which tend to mete out fractions of their impressive milestone payments across multiple potential drug candidates, drove biobucks totals ever higher. Bristol-Myers Squibb’s deal with Dutch gene therapy specialist UniQure, for instance, spans 10 potential cardiovascular gene therapy programs and is worth as much as US$2.3 billion. Likewise, Amgen’s US$1.75 billion deal with Xencor covers six different bi-specific antibody programs. Ultragenyx Pharmaceuticals’ US$1.57 billion deal with messenger RNA platform play Arcturus Therapeutics features an even smaller up-front/biobucks ratio. Arcturus will receive only US$10 million initially for two rare disease programs. The deal may be expanded to include as many as 10 programs, and the US$156 million tied to each of those possible candidates includes development, regulatory and sales milestones.
For the second year in a row, the most active in-licensor was Johnson & Johnson. The big pharma announced 20 alliances, of which eight featured disclosed terms worth an aggregate US$4.2 billion in biobucks. Sanofi (including its Genzyme division) inked 16 alliances, including seven with disclosed terms worth up to US$7.1 billion.
There were 17 alliances forged in 2015 with total potential value greater than US$1 billion.
In 2015, 15 strategic alliances featured up-front payments worth US$100 million or more, compared with 13 in 2014 and 12 in each of the prior two years. These deals, like the year’s top alliances by potential value, often granted buyers access to sought-after technologies. Interestingly, the up-front payments often included an equity purchase that represented a significant portion of the total payment, a practice that has become de rigueur for certain buyers, such as Celgene.
Gilead’s US$725 million up-front payment in its alliance with Galapagos for the latter’s Phase 2 JAK-1 selective inhibitor filgotinib, for instance, included a US$425 million equity stake (good for 15% of the biotech, and purchased at a 20% premium to the shares’ 30-day trading average). In all, eight of the top 15 alliances by up-front value included equity stakes. For some deals, such as Janssen’s hepatitis C alliance with Achillion Pharmaceuticals, equity comprised the entire up-front.
As illustrated by the Gilead/Galapagos deal, mid- and late-stage clinical assets continue to fetch premium pricing, particularly in important therapeutic spaces like immuno-oncology or autoimmune disease.
Another trend to watch: big biotech’s growing dealmaking clout. Big biotechs such as Gilead and Celgene were active dealmakers in 2015, often taking significant equity stakes in their new partners. Celgene also stepped up to do the kind of peer deal usually pursued by big pharma, paying AstraZeneca US$450 million up front for development and commercialization rights to the big pharma’s anti-PD-L1 checkpoint inhibitor MEDI4736 in hematological malignancies.
Access to products that inhibit Bruton’s tyrosine kinase (BTK), a key oncology target, drove two deals worth a combined US$28 billion in 2015. AbbVie’s US$21 billion acquisition of Pharmacyclics centered on the BTK inhibitor Imbruvica; AstraZeneca’s acquisition of Acerta Pharma, meantime, gave the UK pharma rights to the Phase III molecule acalabrutinib. AZ’s buyout of Acerta also included one of the year’s largest earn-outs: AZ agreed to a US$1.5 billion guaranteed milestone payment that, together with a US$2.5 billion up-front payment, will pay for AZ’s initial 55% stake in the biotech. What’s more, each partner has an option, contingent on US and EU acalabrutinib approval, to trigger a US$3 billion sale for the other 45%.
The AZ/Acerta deal was announced in mid-December 2015, even as the biotech financing market sputtered and biotech market indices began to lose steam. Along with a few big early-2016 buyouts like Shire’s US$32 billion deal for Baxalta, announced in January, such transactions suggest that biotech M&A momentum may continue despite a pullback by public market investors.
Three rare disease-focused deals also added more than US$20 billion to the year’s combined deal value. Alexion Pharmaceuticals’ May acquisition of Synageva Biopharma valued the Lexington, Mass.-based biotech at US$8.4 billion. The deal added Kanuma, a then-registration-stage enzyme replacement therapy to Alexion’s stable of rare disease therapies. (Kanuma was approved by the FDA in December to treat lysosomal acid lipase (LAL) deficiency, which earned Alexion one of the agency’s still-rare and coveted priority review vouchers.)
Before it announced the Baxalta deal in 2016, Shire bookended its 2015 with the acquisitions of NPS Pharmaceuticals (January, US$5.2 billion) and Dyax (November, US$6.5 billion). Those deals add a mix of late-stage clinical candidates and marketed therapies to Shire’s stable of orphan drugs, including NPS’s Gattex for short bowel syndrome and Natpara for hypoparathyroidism, as well as Dyax’s hereditary angioedema candidate DX-2930.
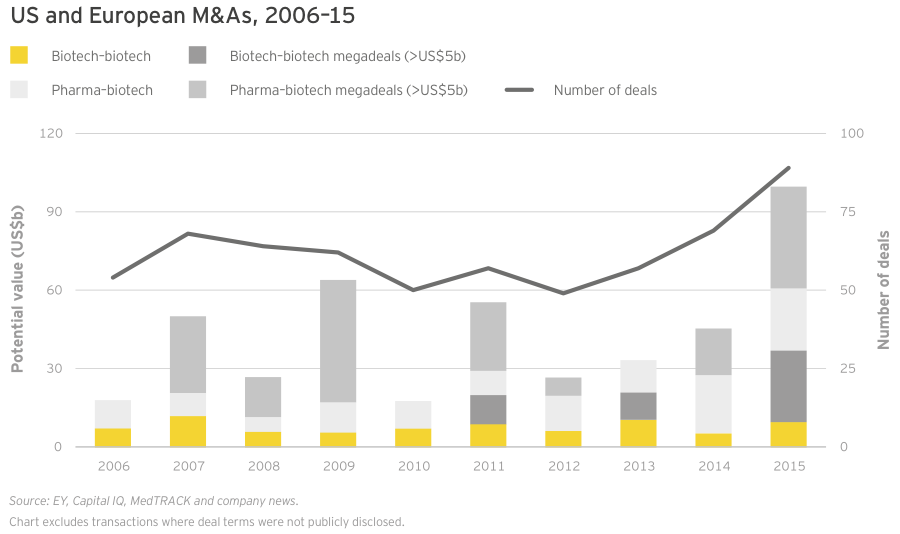
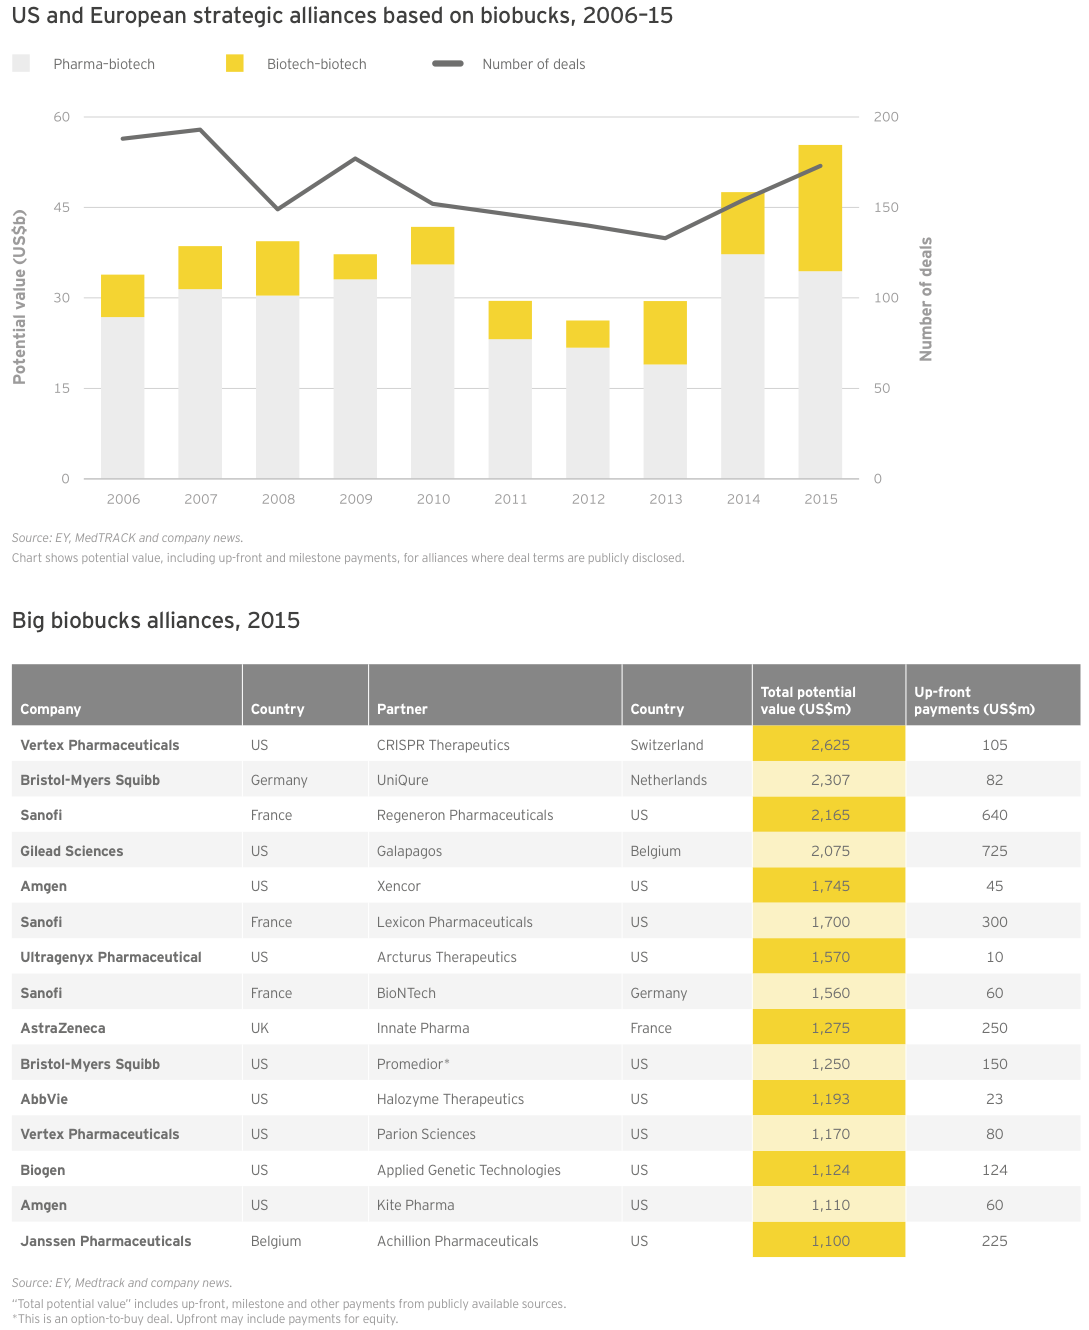
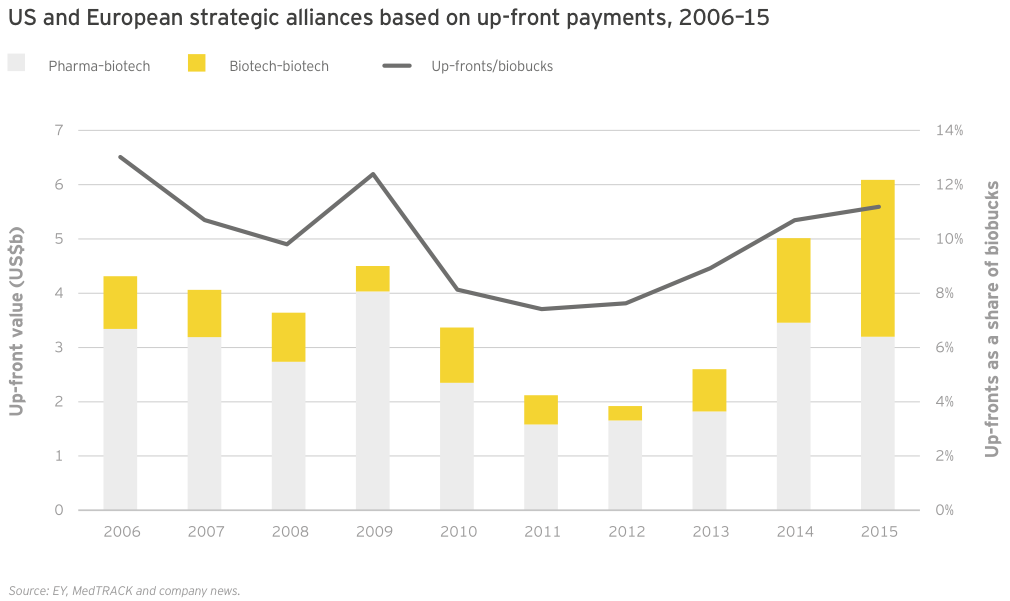
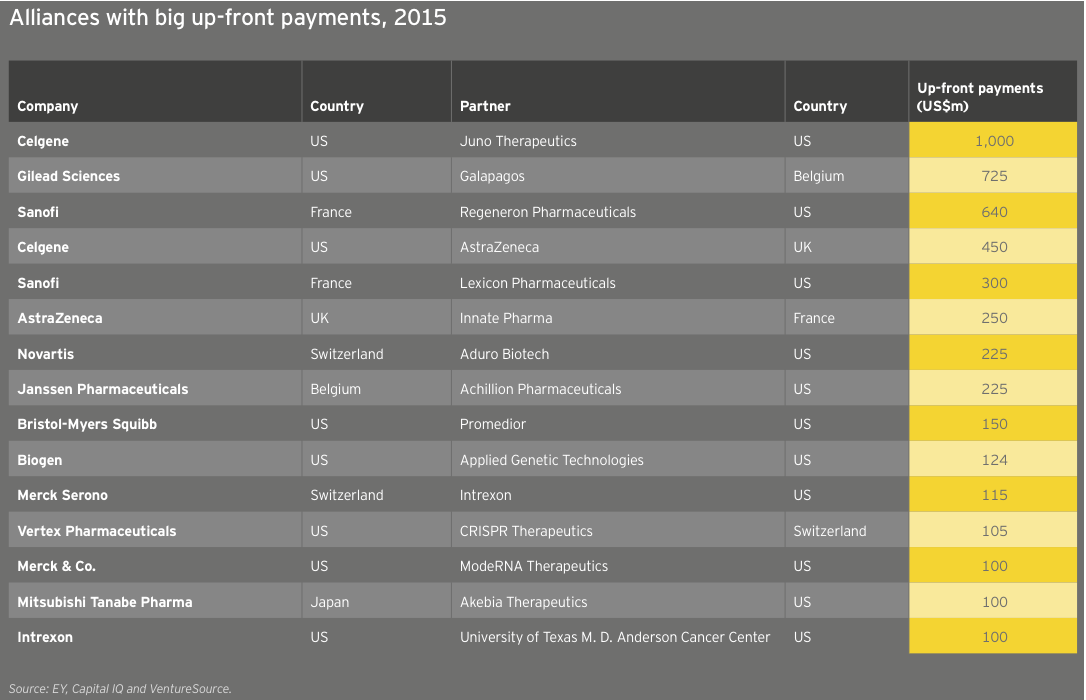
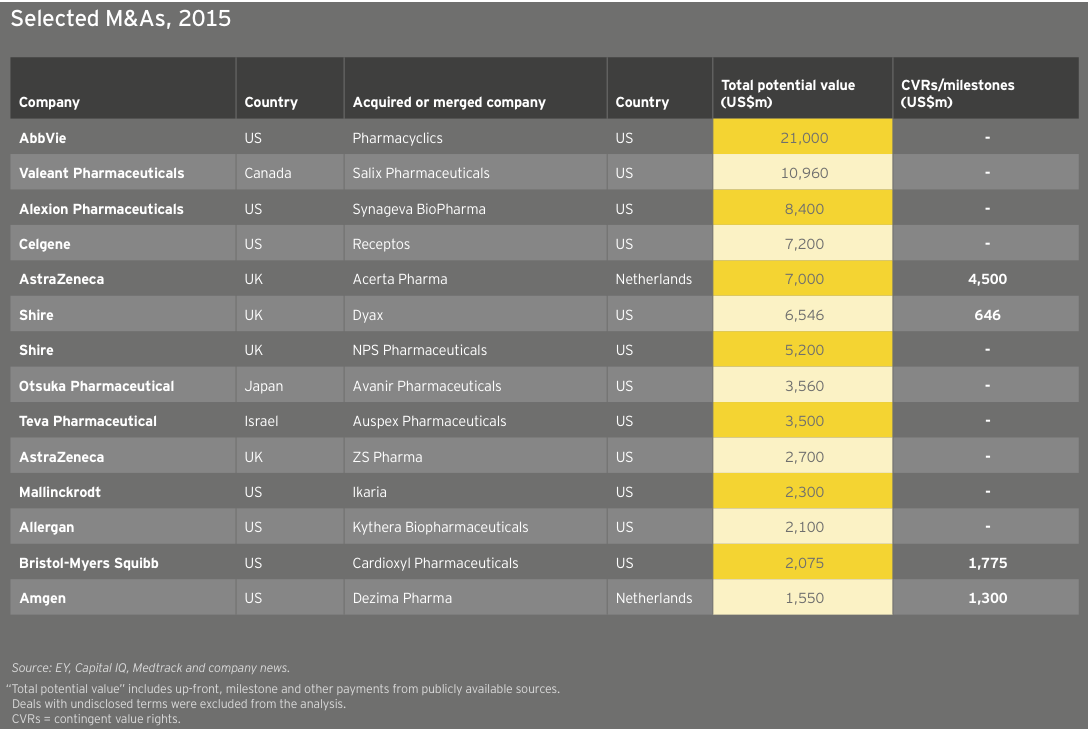
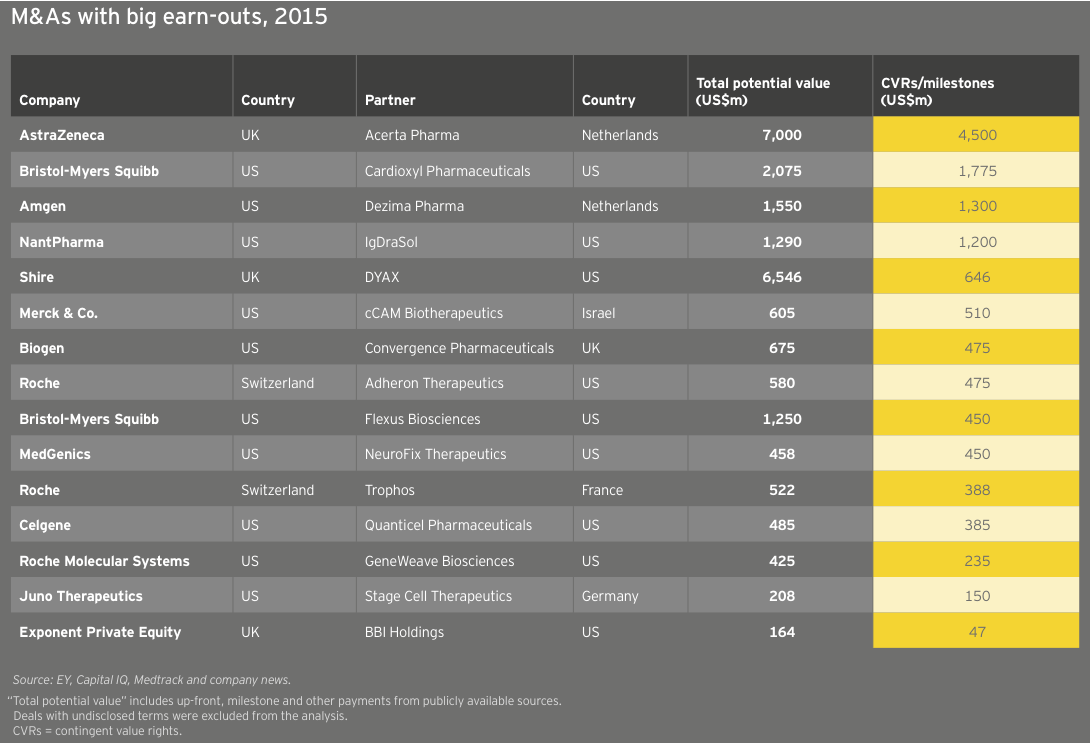
United States
US biotechs enjoyed record volume (64 deals) and cumulative deal value (US$90 billion) in 2015, each metric significantly besting 2014’s totals (50 deals for US$40.3 billion). This boost was largely driven by biotech-biotech M&A, especially US$27.3 billion worth of biotech-biotech megadeals (the category’s highest-ever total, spread across four deals).
Alexion’s US$8.4 billion acquisition of Synageva and Shire’s purchases of Dyax and NPS (described above) for a combined US$11.7 billion led the way. Rounding out the foursome, Celgene’s US$7.2 billion acquisition of Receptos for that biotech’s Phase III S1P modulator ozanimod will help the big biotech build its immunology and inflammatory disease portfolio.
Stateside strategic alliance volume also ramped up in 2015, with 132 deals with disclosed terms. And those terms were impressive – and impressively back-end loaded. Total potential deal value reached a record US$43.3 billion in the US. Once again, biotech-biotech dealmaking accounted for the surge, with a record US$20.5 billion in potential deal value (up 101% from 2014). Pharma-biotech deal value fell 11% to US$22.8 billion but remained healthy, exceeding the decade’s average of US$19.5 billion.
The year’s average potential deal value (US$328 million) trounced the decade’s US$229 million average. This increase was likely driven by the number of multi-program platform deals, where biobucks totals are often inflated by deals involving the development of “up to” 10 or more products.
Biobucks totals may be misleading, but aggregate strategic alliance up-front values also continue to rise. And importantly, the ratio of up-front payments to potentially inflated biobucks totals, at more than 12%, reached a decade-long high. In other words, the money is real, or at least as tangible as at any time in the recent past. To be sure, this includes nearly US$2 billion in equity payments – but those payments typically come at a significant premium to companies’ share prices when the deals are struck. And regardless of dilution, as the tide of biotech financing begins to recede in early 2016, up-front alliance payments will give many companies more strategic alternatives during a possibly extended dry spell.
In 2015, cumulative up-front payments in deals with disclosed terms reached US$4.3 billion, up 16% from 2014 and nearly twice the decade-long average of US$2.5 billion. Once again, biotech-biotech deals stand out: at US$1.8 billion, up-front payments from one biotech to another reached an all-time high thanks to equity-heavy payments in deals such as Celgene/Juno.
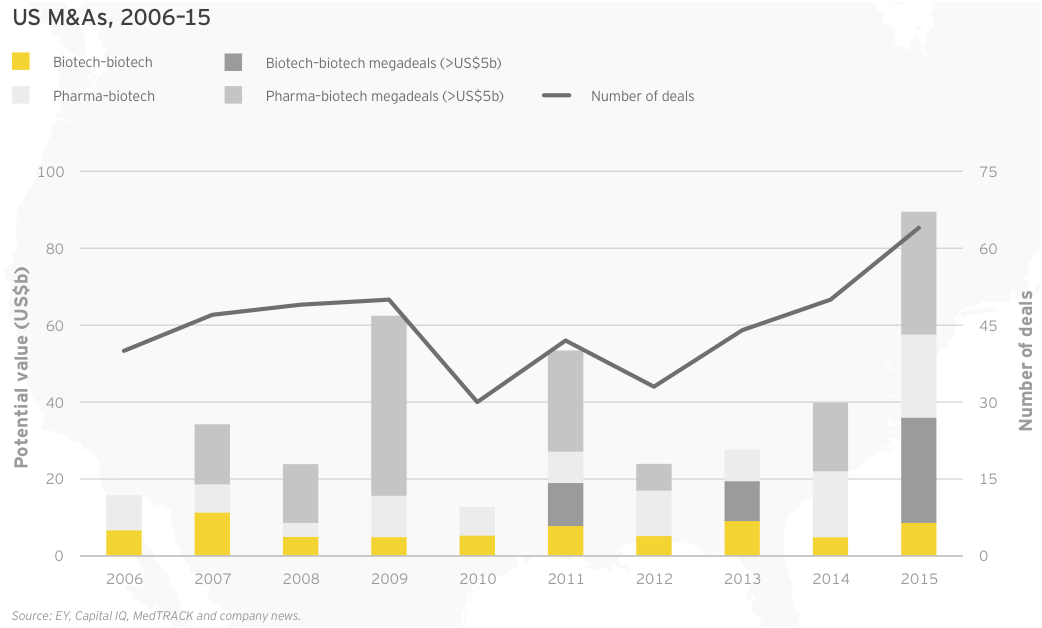
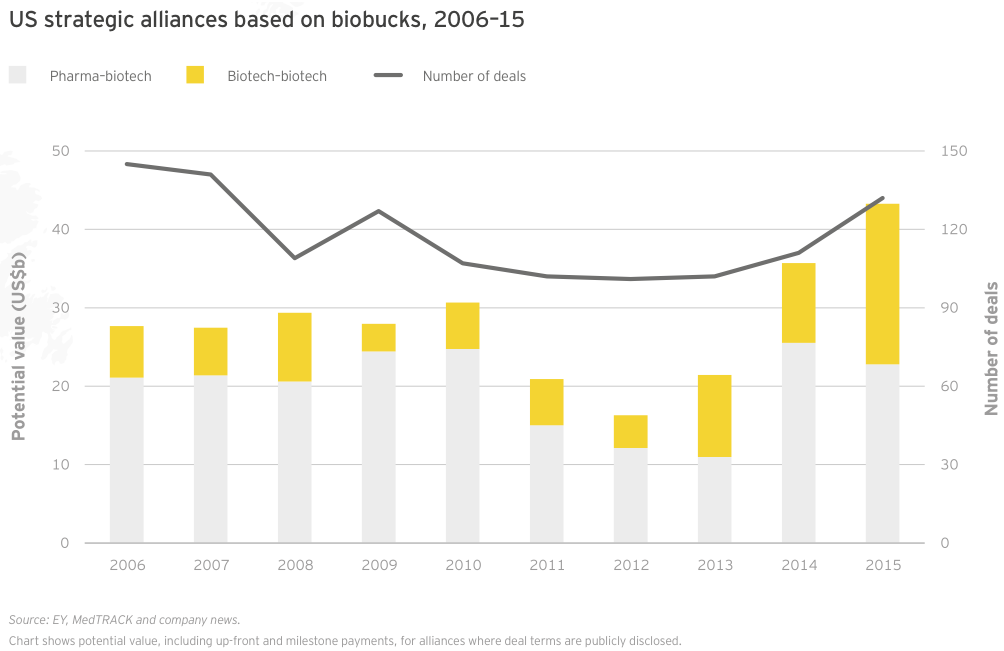
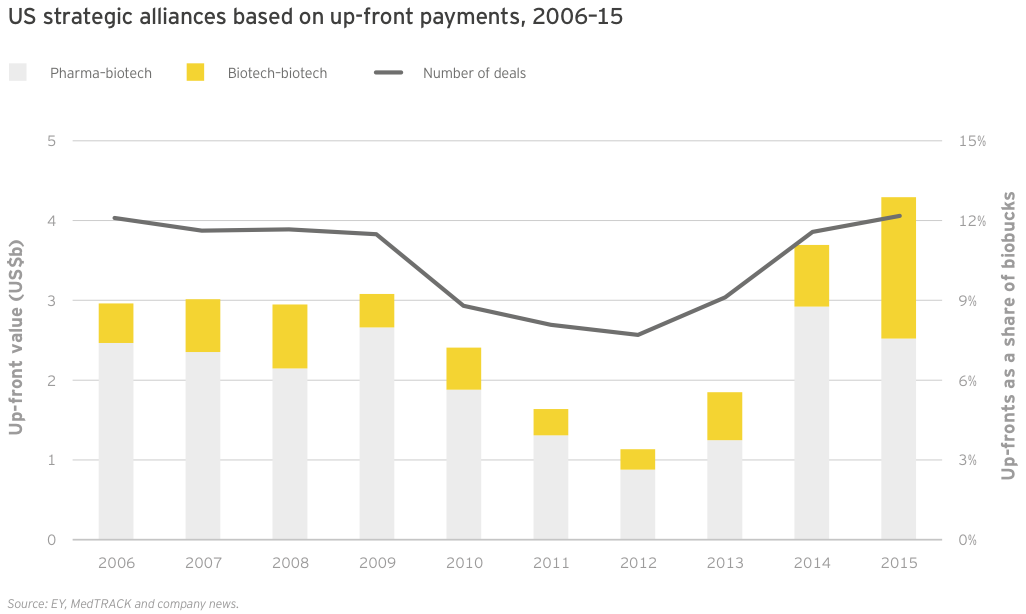
Europe
As in the US, the number of M&A deals involving a European biotech set a new record. The 41 deals inked in 2015 were nearly double the 10-year average of 23. At US$15 billion, potential deal value for European acquisitions reached its second-highest level since 2006. Average deal value rose markedly, from US$244 million in 2014 to US$367 million in 2015, the third-largest average in the past 10 years.
The year’s total deal value was also up significantly from 2014, thanks to a single pharma-biotech megadeal, AstraZeneca’s US$7 billion buyout of the Netherlands’ Acerta Pharma. AZ paid US$2.5 billion up front and is committed to a US$1.5 billion guaranteed milestone payment.
2015 European strategic alliance value, as measured by potential biobucks, trumped 2014, itself a previous record, even as deal volume fell slightly from 57 to 54 alliances. Europe’s biotechs inked deals worth potentially US$17.8 billion, up 11% over 2014 and easily beating the decade average of US$11.2 billion.
Biotech-biotech platform alliances, such as Vertex Pharmaceuticals’ US$2.6 billion deal with Basel-based CRISPR Therapeutics, were one reason why. The largest alliance between two European companies was Sanofi’s US$1.56 billion cancer immunotherapy deal with Mainz, Germany-based BioNTech. That deal, worth US$60 million up front, will see the companies collaborate on up to five mRNA drug candidates.
Up-front strategic alliance payments to European biotechs continued to climb as a share of total deal value, reaching 9.7% in 2015. Total up-front payments of US$1.7 billion broke new ground, up from US$1.3 billion in 2014.
As in the US, equity purchases accounted for a significant portion of cumulative deal up-fronts. Gilead’s deal with the Netherlands’ Galapagos featured a US$725 million up-front and included a US$425 million payment for a 15% stake in the biotech.
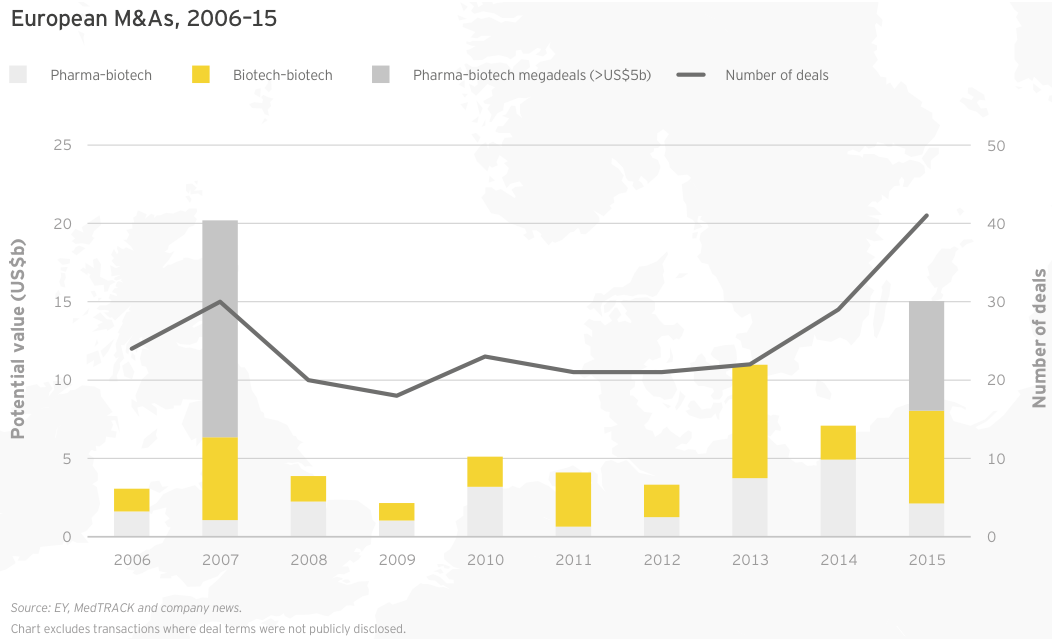
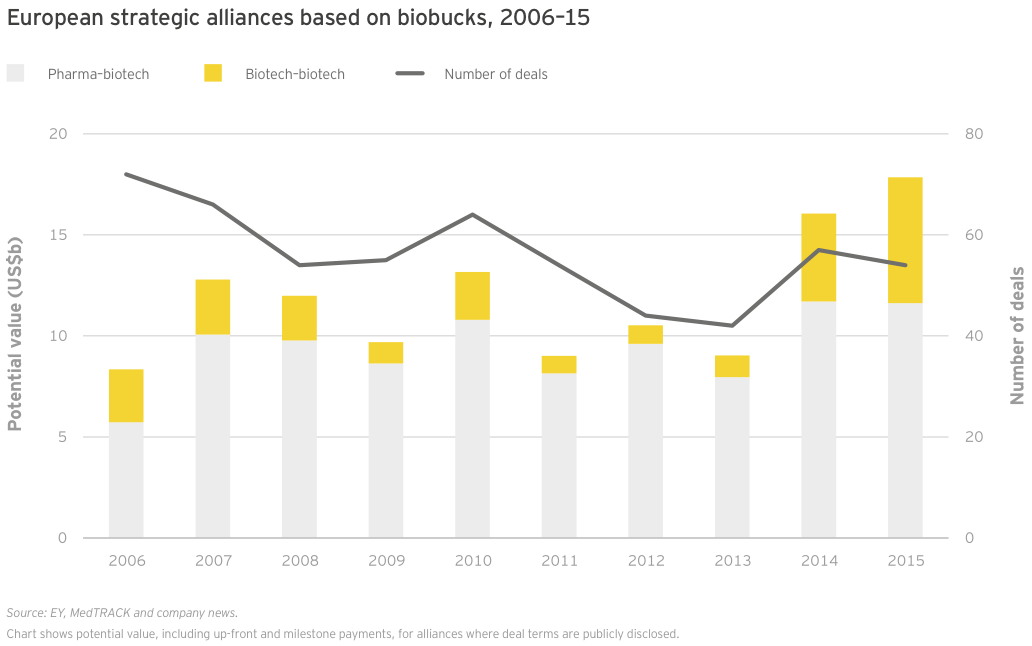
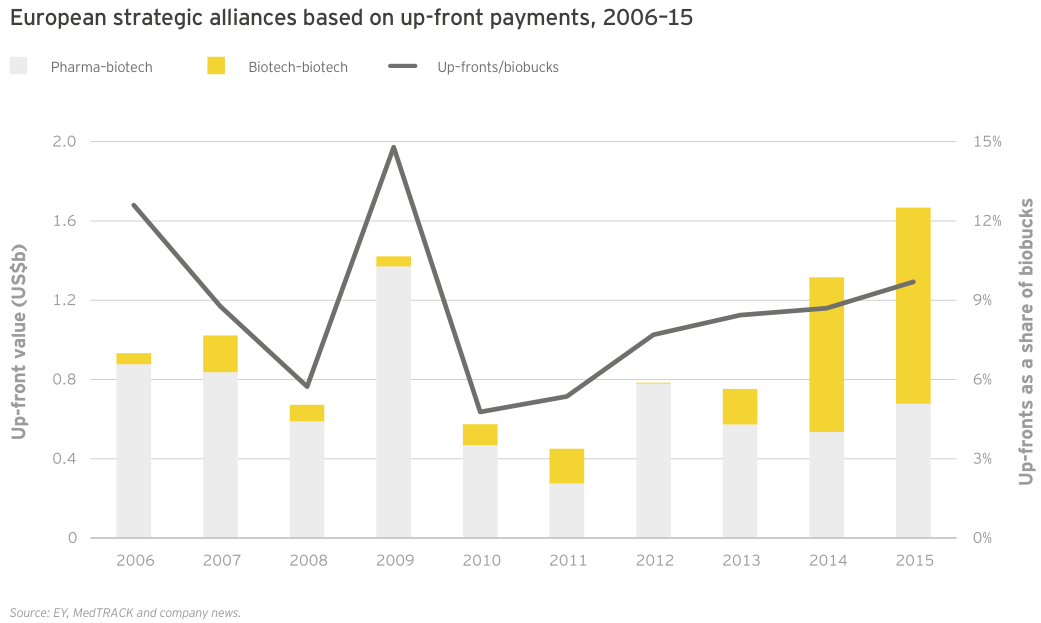
Acknowledgments
Project leadership
Glen Giovannetti, Ellen Licking, Chris Morrison and Jason Hillenbach
Data analysis
Niharika Agarwal, Richa Arun, Stavita Bell, Ulrike Trauth, Ellen Licking, Kim Medland and Jason Hillenbach
Editorial assistance
Russell Colton and Troy Smith
Design
Public relations and marketing
TAGS:


Stay up to date with M&A news!
Subscribe to our newsletter


