

Quarterly Deal Performance Monitor: Q1 2016
By Steve Allan – Willis Towers Watson
First-quarter 2016 M&A remains strong, but sees lower volumes and a significant drop in market performance.
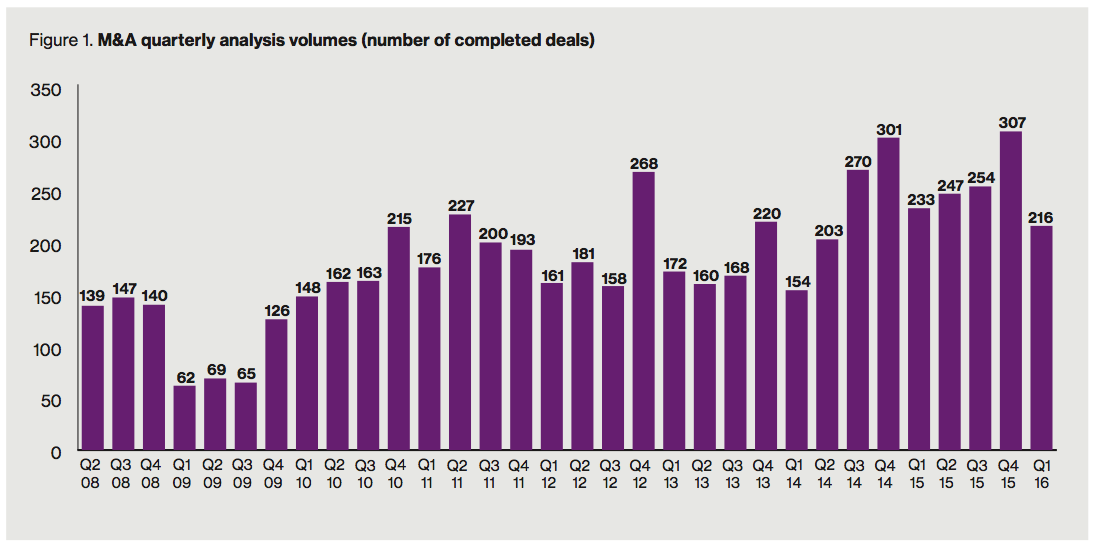
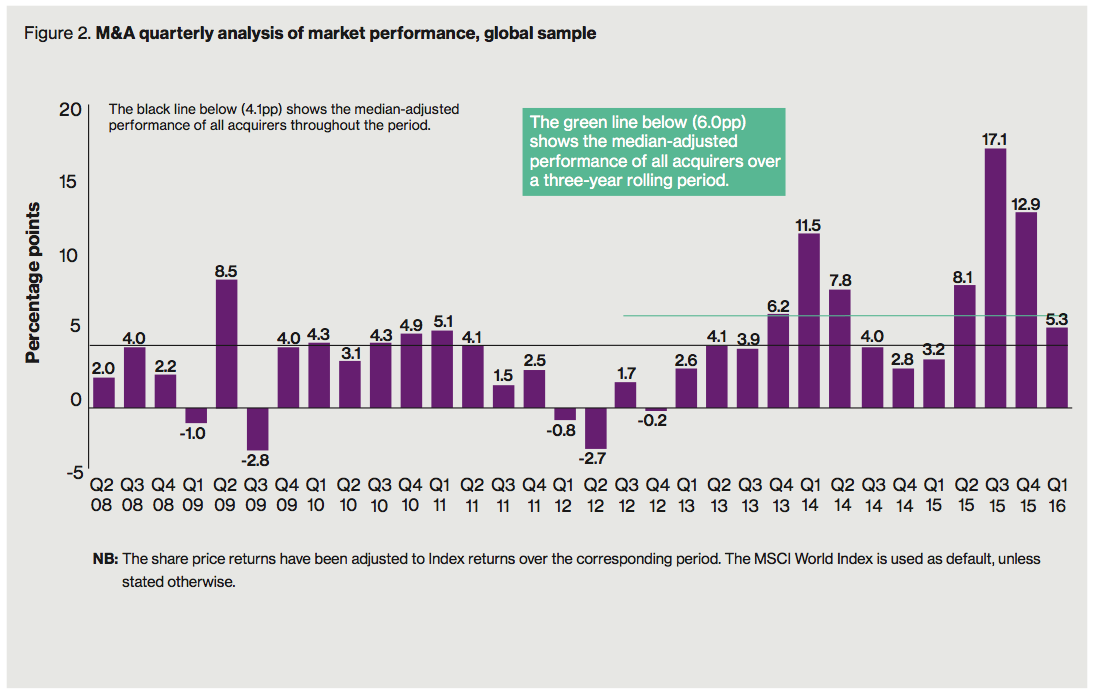
The number of M&A deals completed in the first quarter of 2016 was the lowest for two years according to Willis Towers Watson’s Quarterly Deal Performance Monitor (QDPM). The research, run in partnership with Cass Business School, shows that despite the fall in completed deals over $100m this quarter (216) compared to 233 in Q1 2015 (and 307 in Q4 2015), financial outperformance for companies completing M&A deals remains positive at 5.3 percentage points (pp) above the MSCI World Index. However, this is below the three-year rolling average of 6.0pp.
A regional breakdown of M&A deals shows Asian acquirers have maintained the top spot in the performance league, with their outperformance of 21.5pp above their regional index. Acquirers from Europe outperformed by 8.0pp above their regional index, but have declined in the last two quarters and are followed by North American acquirers, which underperformed their index at -0.07pp. This is the first time North American acquirers have underperformed for two consecutive quarters since the same period in 2012.
North America’s underperformance could be the sneeze that starts a worldwide M&A cold, however it could be just a regional phenomenon. The research shows an apparent correlation between US election years and M&A underperformance in the first two quarters, this having also occurred in both 2008 and 2012. Deal completion volumes traditionally drop off in the first quarter of the year so it is no surprise that we are seeing a drop from last year’s record levels. It is therefore an open question whether the drop in volumes and the drop in North American performance figures signals a true downturn in the M&A market performance, or just a reflection of the uncertainty currently seen in the region and where we are in the annual deal cycle. – Steve Allan, Human Capital M&A Leader (EMEA) at Willis Towers Watson
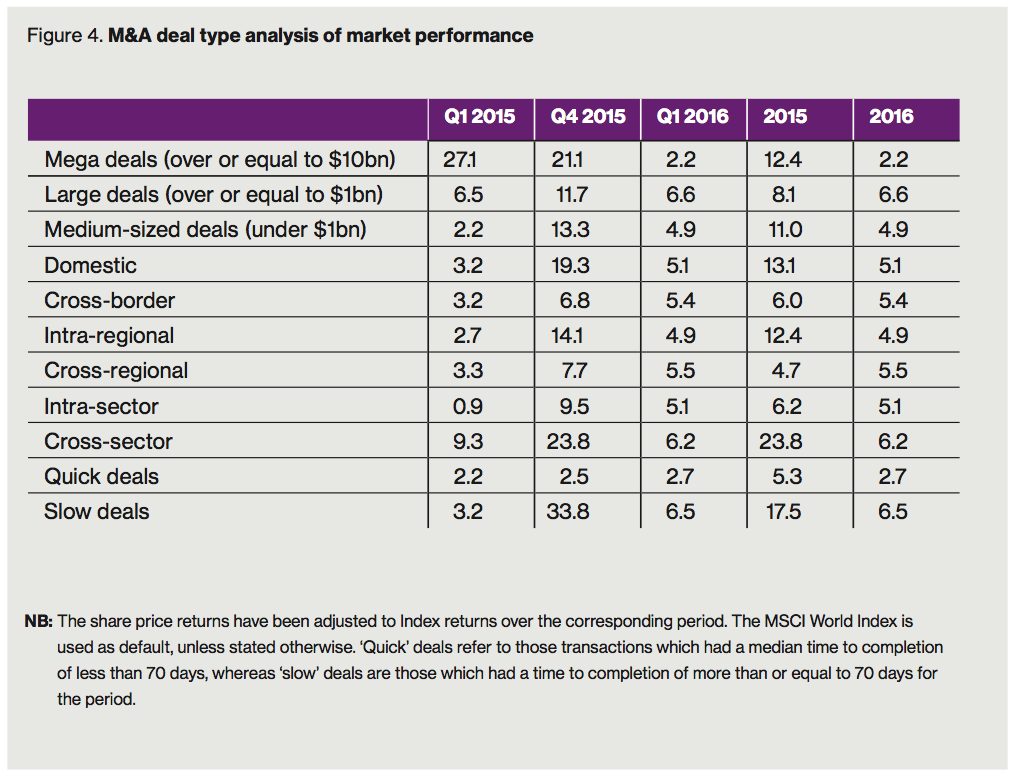
According to the research, cross-border, cross-regional and cross-sector deals outperformed the Index by 5.4pp, 5.5pp and 6.2pp respectively compared to domestic, intra-regional and intra-sector outperformance of 5.1pp, 4.9pp and 5.1pp respectively. In addition, quick deals in Q1 2016 underperformed compared to Q1 2015, whilst the outperformance of slow deals doubled from 3.2pp in Q1 2015 to 6.5pp this quarter.
The outperformance of the cross-sector, cross-border and cross-regional deals compared to domestic deals shows that those prepared to be bold are still reaping the rewards. But quick deals, traditionally those that are domestic or intra-sector, creeping into negative performance could serve as a warning sign for those looking for industry consolidation opportunities. – Steve Allan, Human Capital M&A Leader (EMEA) at Willis Towers Watson
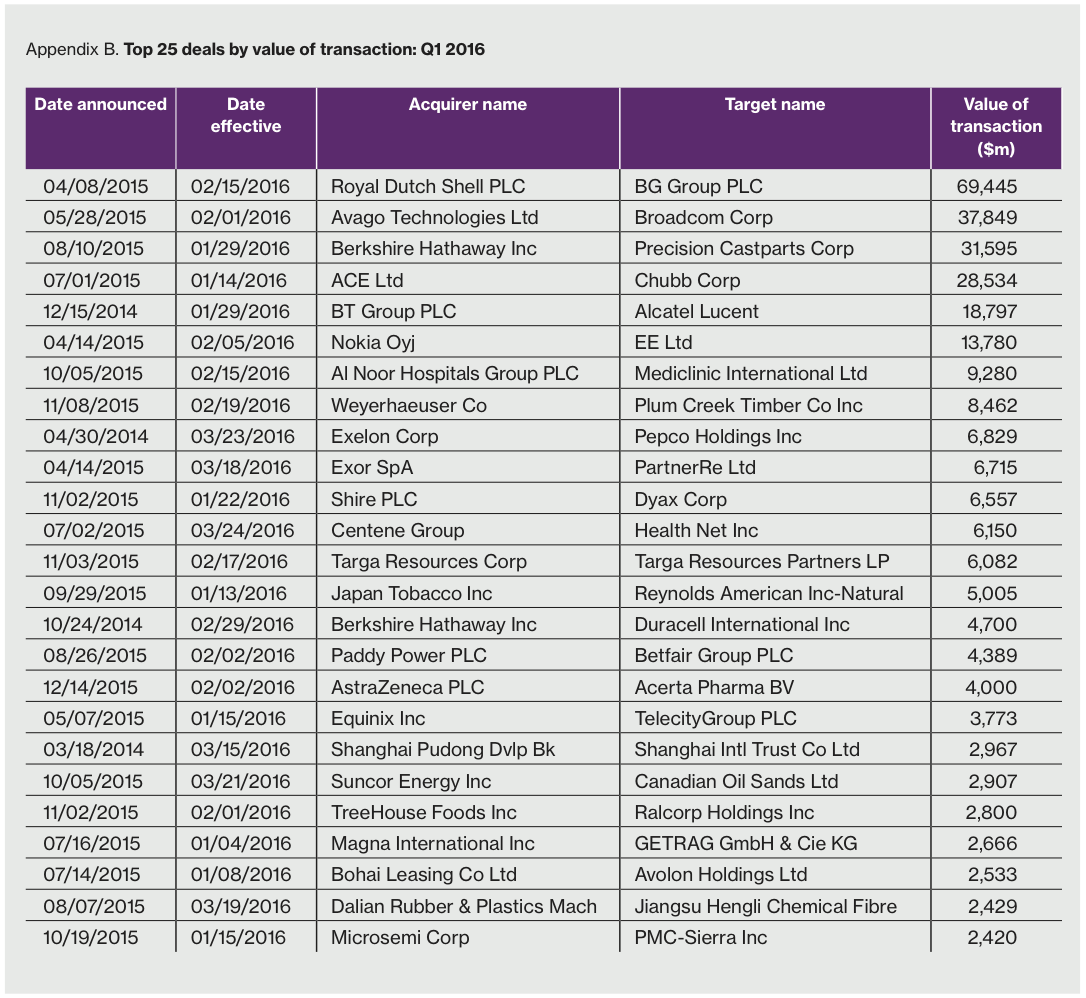
The research also highlights that the number of mega-deals (over $10 billion) is up in Q1 2016 with six deals completed compared to four in Q1 2015, an all-time high for any first quarter since our analysis began in 2008.
Our study highlights a number of interesting findings:
- Following an impressive outperformance in the last three quarters of 2015, acquirers closing deals in Q1 2016 posted an outperformance of ‘only’ 5.3pp over the MSCI World Index compared to 12.9pp in Q4 2015.
- The quarterly volume of deals was the second highest for any Q1 since 2008. The market for mega-deals was up in Q1 2016 with six deals, following an aggressive year of mega-deals, and is at an all-time high for any first quarter since our analysis began.
- Asia was once again the outstanding performer this quarter, followed the an outperformance of Europe and the underperformance of North America.
- The performance of acquirers in Q1 2016 declined for medium-sized, domestic, intra-regional and cross-border, as compared to Q4 2015, but was higher than Q1 2015.
Mega-deal M&A activity has increased unabated, with deals closing despite the economic turmoil. But as deal volume overall decreases, it will be interesting to see if the drop in smaller deals is a leading indicator that we are reaching the crest of the M&A wave. While M&A activity remains high, it is too early to say if we have just paused for breath before an upturn in Q2 or if we have reached a plateau in activity and are at a turning point. Either way, with M&A deals still outperforming the World Index, acquisitions are likely to remain an attractive growth strategy for many companies in the year to come. – Steve Allan, Human Capital M&A Leader (EMEA) at Willis Towers Watson
Warranty and indemnity insurance
Warranty and indemnity insurance (W&I) has become a familiar and often essential part of many transactions, with particular prevalence in the private equity transaction space. The product continues to grow in sophistication, breadth and capacity. There is now approximately US$1 billion worth of insurance capacity available on any European transaction for example, which is double what it was a few years ago.
W&I indemnifies loss arising out of the acquisition agreement on a transaction, including for breach of warranty, under a tax indemnity or an indemnity in respect of an insurable known issue. The insurer effectively ‘steps into the shoes’ of the person giving the contractual promises and tax indemnity. The vast majority of policies are buy-side as opposed to sell-side, enabling a buyer to claim directly against an insurer, without having to pursue recourse against the seller or warrantor. Increasingly often we are seeing a buy-side policy instigated, and initially negotiated, by the seller. The W&I is ‘stapled’ to the transaction and inherited by the purchaser (as the insured) at the appropriate time, who then fine-tunes the policy to adhere to their specific requirements.
Amongst other things, W&I can facilitate:
- A cleaner exit for a seller who can limit their liability to a minimum, reducing the need for an escrow arrangement
- A better level of indemnification for the buyer (for example, a higher liability cap or a fuller suite of warranties)
- More certain or feasible recourse for the buyer (for example, where the seller is a special purpose vehicle, individuals, or remains part of the business)
- The completion of a transaction where the parties cannot agree on specific issues (for example, a potential tax liability)
An increase in the number of insurers participating in W&I has put positive pressure on prices, retention levels and coverage generally. It has also resulted in the need for insurers to differentiate themselves with regard to the breadth of cover they offer, the service they provide and the types of risk they specialise in (jurisdiction, industry and so forth). All of this is obviously positive for the insured.
Regular users of W&I are comfortable with the ability of the product to facilitate the completion of a transaction. It would seem that the next stage in its development will be the continued focus on the minutiae of the product itself, pushing the boundaries of coverage on each deal. As clients, and their advisers, become more familiar with the product, they are seeking to apply it to more complex transactions, including in jurisdictions that insurers are less familiar with.
We have seen a decrease in the volume of transactions in the UK in the first quarter of 2016. This seems predominantly due to uncertainty caused by a potential ‘Brexit’, with private equity houses and investors stalling their transactions. However, globally we have advised on, and witnessed, a steady flow of transactions, including a significant amount of cross-border investments. We are continuing to see a high number of transactions involving the manufacturing, real estate, retail, healthcare and energy sectors.
Willis Towers Watsons Quarterly Deal Performance Monitor Methodology in partnership with Cass Business School:
- All analysis is conducted from the perspective of the acquirer.
- Share price performance within the quarterly study is measured as a percentage change in share price from six months prior to the announcement date to the end of the quarter.
- All deals where the acquirer owned less than 50% of the shares of the target after the acquisition were removed, hence no minority purchases have been considered. All deals where the acquirer held more than 50% of target shares prior to the acquisition have been removed, hence no remaining purchases have been considered.
- Only completed M&A deals with a value of at least $100m are included in this research.
- Deal data sourced from Thomson Reuters.


Stay up to date with M&A news!
Subscribe to our newsletter