
Publications Automotive M&A Deals Insights – First Half Of 2016
- Publications
Automotive M&A Deals Insights – First Half Of 2016
- Christopher Kummer

SHARE:
By Jeff Zaleski, Christopher Becker, Christopher Sutton. – PricewaterhouseCoopers
Contributor: Steve Shanker
Executive summary
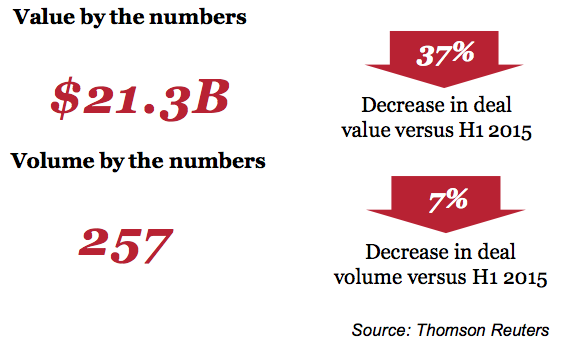
Automotive M&A deal value for the first half of 2016 (H1 2016) was down 37%, significantly off the pace experienced in 2015. However, with 257 deals, volume was only down 7%.
Despite the overall decline in deal value for the first half of 2016, the overall strength of the automotive industry remains strong as global vehicle assembly is expected to grow at a CAGR of 3.3% through 2022. Several factors are impacting automotive deal volume including global economic factors, regional differences within the global industry, and an overall softening of the M&A markets (as seen across all sectors).
While 2016 was off to a slow start for M&A activity, compared to the record year of activity in 2015, a variety of factors indicate that this could be another strong year of M&A activity, especially in the U.S. Some positive factors impacting automotive M&A activity in 2016 include companies and private equity with large cash balances, continued pressure from shareholders and new competitors, and the increased pace of innovation.
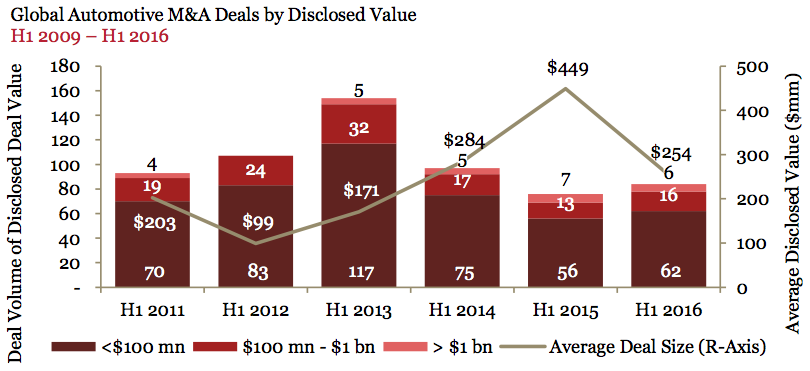
In the first half of 2016, average global automotive deal size decreased 43% from $449 million to $254 million, primarily driven by a lower number of megadeals (six deals) compared to the first half of 2015 (seven deals). It is important to note that in 2015 the industry experienced historically high deal values with the largest deal being ZF Friedrichshafen AG’s acquisition of TRW Automotive Holdings Corporate for $12.5 billion. Excluding this transaction, deal value for the first half of 2016 is down only 1%.
“While automotive M&A activity is off to a slow start in 2016, we believe disruptive trends will continue to drive M&A headlines. The increased pace of investment around the Smart Car, electric and autonomous vehicles, and ride sharing will drive deal activity in the next 12 to 24 months.” — Jeff Zaleski, US Automotive Deals Leader
Key trends/highlights
• Six megadeals with a total aggregated disclosed value of $11.6 billion, representing a 56% decrease in megadeals from the first half of 2015.
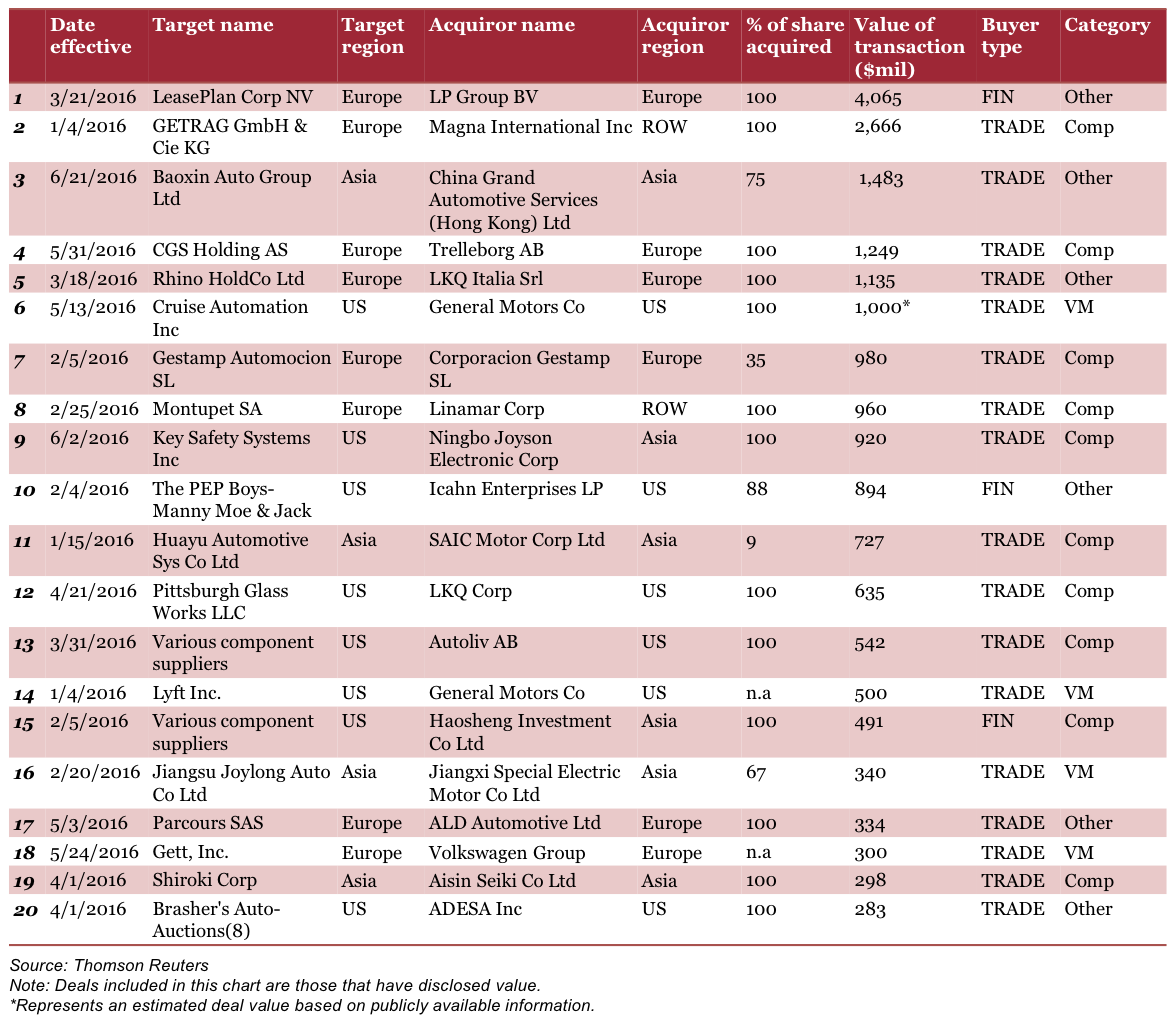
• The largest megadeal for the first half of 2016 was LP Group BV’s acquisition of LeasePlan Corp NV for $4.1 billion, which is one-third the size of the largest megadeal in 2015 of $12.5 billion.
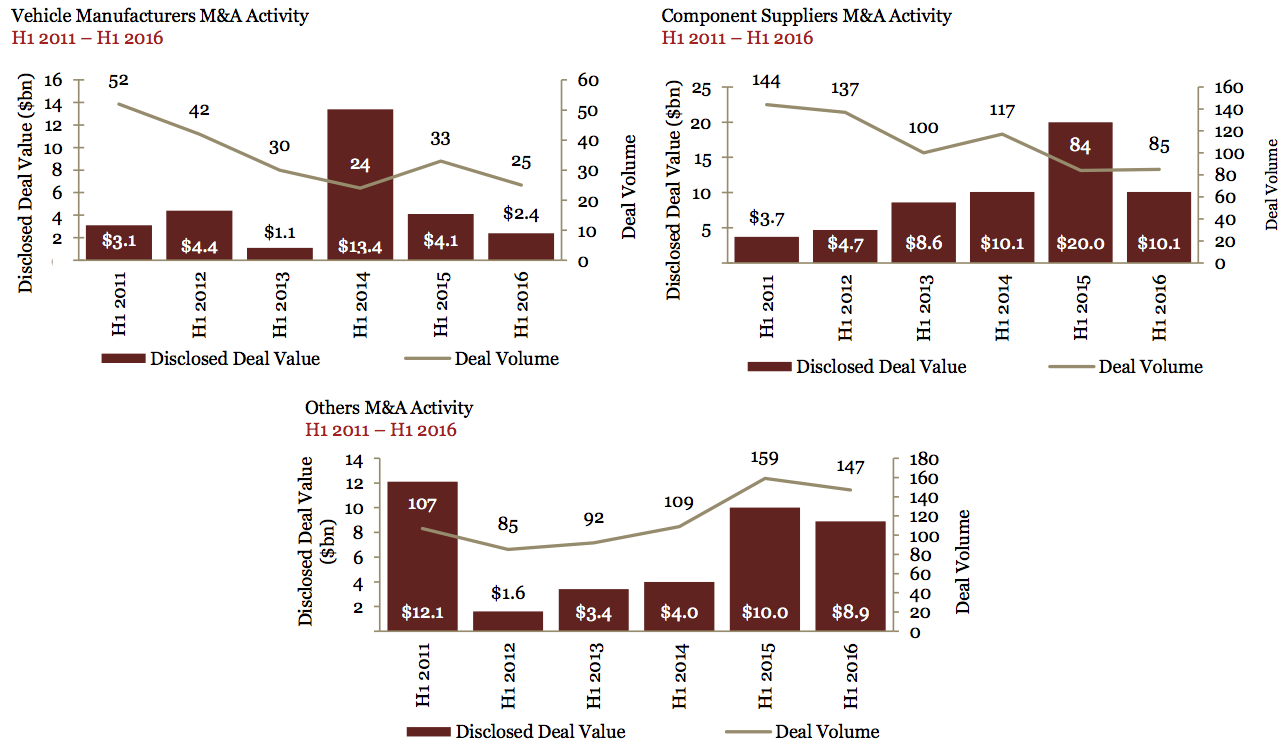
• Component suppliers deal volume remained flat at 85 deals in the first half of 2016.
• 50% of the top 10 deals targeted component suppliers.
• Financial buyers’ share of global automotive M&A deal volume decreased to 29% compared to 31% in 2015.
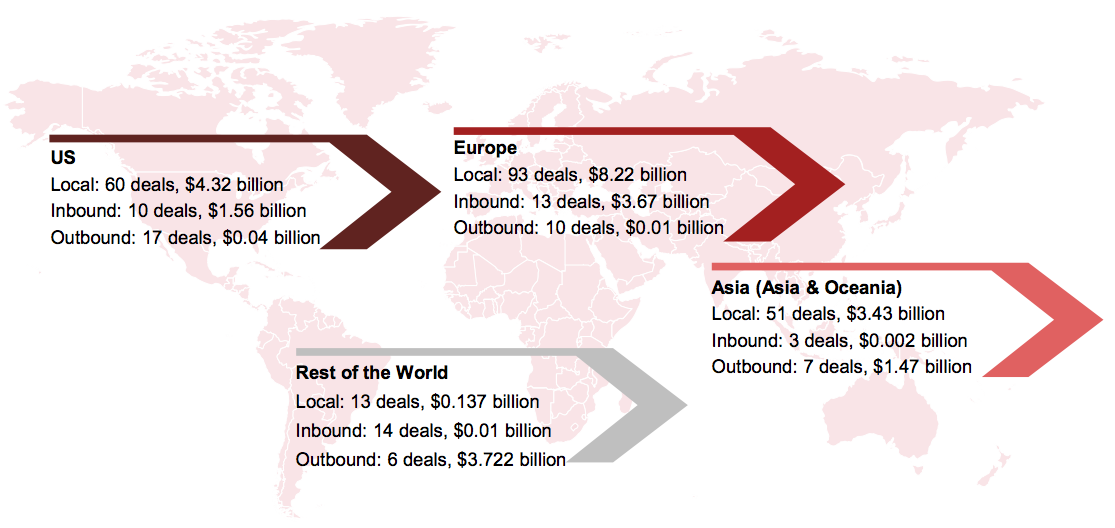
• 84% of total deal volume was transacted locally within the same region, consistent with historical trends.
• Europe maintained its position as the most active region, transacting 103 deals.
• Predicted global automotive assembly growth of 3.3% CAGR between 2016 and 2022.
Highlights of H1 2016 deal activity
M&A market activity stalls
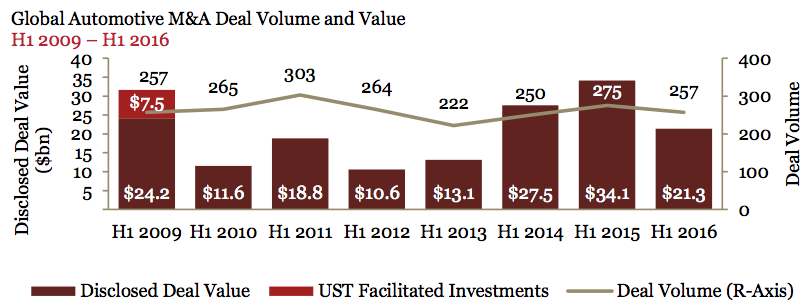
The first half of 2016 underperformed in relation to the first half of 2015, both in terms of deal value and deal volume. Total first half of 2016 transaction value of $21.3 billion is down 37% from the first half of 2015. 257 deals were closed during the first half of 2016, down 7% from the first half of 2015, but up 3% from the first half of 2014.
Largest transaction
LP Group BV’s $4.1 billion acquisition of LeasePlan Corp NV – a provider of car leasing services. This transaction accounted for approximately 19% of the total disclosed deal value in the first half of 2016.
Megadeals slow down
There were six transactions in H1 2016 exceeding $1.0 billion (compared to seven in H1 2015 and five in H1 2014), making up 54% of total disclosed deal value.
Automotive assembly
According to PwC Autofacts, the industry is expected to add 19.6 million units of production between 2016 and 2022 for a compounded annual growth rate (CAGR) of 3.3%. Not surprisingly Asia-Pacific is driving much of this growth, making up 62% of the contribution to growth (CTG) in this time period. China alone is expected to add nearly 7.7 million units of assembly, making up 39% of this global growth. North American growth continues as well, with 11% CTG to the global topline. Much of this is due to the surge of capacity investment in Mexico that is already underway. The EU follows in terms of volume growth as the market continues to recover, reaching 20.3 million units. Given the current struggles, Eastern Europe is expected to rebound and grow by 1.5 million units by 2022, while increasingly open markets in the Middle East & Africa is expected to expand production by 1.2 million units by the end of the forecast window. Finally, South America regains some footing and surpasses the 4.0 million unit mark for annual production by 2022. While global assembly continues to grow at a modest pace, automotive companies will need to focus on finding a balance between reducing costs while maintaining expected quality.

Key trends and insights
Driving M&A activity: Emerging technologies and business models
Three disruptive forces will continue to drive automotive M&A headlines in 2016 and beyond:
Smart car
• The Smart Car is an automobile designed with direct access to the internet, enabling links to all other connected objects, including smartphones, tracking devices, and even home appliances. A wide range of startups are offering Smart Car capabilities around infotainment, driver safety, cybersecurity and other capabilities.
• M&A strategy, both for automotive and non-automotive companies, revolves around acquiring innovative capabilities offered by these startups. For instance, Verizon recently acquired Telogis, a cloud-based location intelligence platform provider, to gain a foothold in the Smart Car market.
• Other new entrants gaining traction in automotive includes Apple’s CarPlay and Google’s Android Auto which is forcing traditional automotive participants to think differently about their strategies.
Autonomous Vehicles (AV)
• The vigorous debate about exactly “when” fully autonomous vehicles will arrive should not blind us to the fact that autonomous driving is directly impacting M&A strategy today.
• General Motors’ acquisition of Cruise Automation, a San Francisco-based developer of autonomous vehicle technology, is evidence of the investments the industry is making in redefining the future of personal mobility.
• Toyota Research Institute (TRI) has made an investment of $1 billion in artificial intelligence (AI) to facilitate research automotive safety and other mobility products.
Ride sharing
• Partnerships between traditional automotive vehicle manufacturers and new entrants are addressing changing consumer preferences around shared mobility.
• General Motors announced a $500 million investment in Lyft, while Toyota announced a collaboration with Uber to create new leasing options that will facilitate the opportunity for car payments by Toyota car purchasers to be made through Uber driver earnings.
• Other new entrants in this space include Apple’s announcement of a $1 billion investment in Didi, China’s largest ride-sharing company, in early May.
Transaction multiples
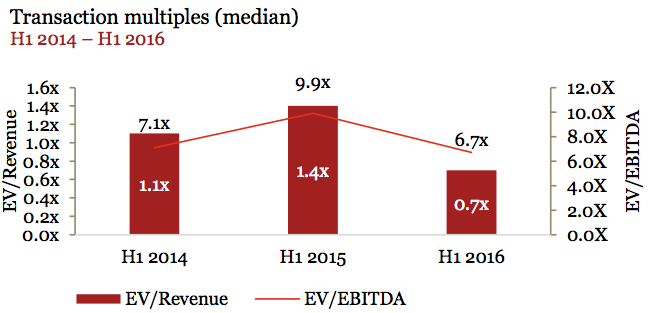
Transaction multiples decreased from the historical highs seen in H1 2015. The implied EV/revenue multiples for automotive transactions announced during H1 2016 decreased relative to H1 2015, from 1.4x to 0.7x, respectively. In the same regard, the implied earnings (EBITDA) multiples declined, from 9.9x in H1 2015 to 6.7x in H1 2016. These trends highlight that the decrease in deal value is a combination of declining deal activity and lower transaction multiples.
Industry sub-sector (category) analysis
Deal value diminished in the first half of 2016 compared to the first half of 2015 across the industry sub-sector categories (component suppliers, vehicle manufacturers, and others) with the largest reduction ($9.9 billion) being with component suppliers.
Component suppliers
This marks the first period of decreasing deal value for component suppliers since 2010. However, year over year, excluding the acquisition of TRW Automotive Holdings Corp by ZF Friedrichshafen AG, component suppliers deal value increased 34% ($7.5 billion in H1 2015 to $10.1 billion in H1 2016). Two of the six megadeals in the first half of 2016 were transacted amongst components suppliers. In terms of deal volume, components suppliers transacted 85 deals in the first half of 2016.
Vehicle manufacturers
Deal value among vehicle manufacturers decreased by 42% in the first half of 2016, the lowest level since 2013. The downward trend in deal value is partly driven by having only one megadeal ($1.0 billion) within the category in the first half of 2016, compared to two megadeals in the first half of 2015 ($2.4 billion). Additionally, deal volume reversed gains achieved in the first half of 2015, returning to levels experienced in the first half of 2014.
Others
The Others category includes retail/dealership, aftermarket, rental/leasing and wholesale. Despite a year-over-year decrease in deal volume and value, the Others category continues to show resilience as it recovers from historical lows experienced during the peak of the recession. Deal value decreased by 11%, which is primarily due to a decrease in deal volume (7.5%). The largest deal (in terms of value) and two other megadeals transacted in the first half of 2016 were within the Others category.
Financial vs. trade buyers
Financial buyers
Financial buyers saw decreases in both deal value and deal volume in the first half of 2016, down 45% and 13% as compared to the first half of 2015, respectively. The decrease in deal value is primarily driven by having only one megadeal transacted by financial buyers in the first half of 2016 at a total value of $4.1 billion. In comparison, four megadeals were backed by financial buyers in the first half of 2015 with a total value of $7.9 billion.
Overall, financial buyers’ share of M&A activity dropped slightly from the first half of 2015 to 29% of total deal volume. However, this is still the second highest volume share in the last five years.
Trade buyers
Deal value and deal volume decreased for trade buyers for the first half of 2016 as compared to the first half of 2015. Volume decreased 4% and value dropped 34%. The strong results in past years by trade buyers were significantly driven by large megadeals, as the three trade megadeals for 2015 were valued at a total of $18.7 billion. However, in the first half of 2016, the five megadeals for trade buyers totaled only $7.5 billion.

Regional analysis
Local deals (transactions by targets and acquirors within the same borders) dominated the M&A landscape again in the first half of 2016, as 84% of the total deal volume was within the same region (referred to as local deals). 75% of deal value (or $16.1 billion) was attributable to these local deals.
U.S.
Share of deal volume and value by U.S. acquirors increased to 30% and 20%, respectively, as compared to 28% and 13%, respectively, for 2015. The share of deal volume where U.S. companies were the target remained consistent with 2015 at 27%. Conversely, the share of deal value related to U.S. targets dropped to 28% as compared to 49% in 2015, which was primarily driven by ZF Friedrichshafen AG’s acquisition of TRW Automotive Holding Corp.
Europe
Europe held the majority share of the deal volume and value for the first half of 2016. European assets experienced the greatest benefit from the megadeals transacted during the period, with four of the six deals being with an European target and three of six megadeals being with an European acquiror. European deal value by target region increased more than twofold to its highest since 2008 at 56% for the first half of 2016. On the contrary, the share of deal value by European acquirors decreased by seven basis points and volume by European acquirors decreased slightly compared to 2015.
As the world continues to react to the United Kingdom’s (UK) vote to leave the EU on June 23, it’s important to note that, at this point, there are many more questions than answers. However, the likely impact on several key components of the automotive industry hang in the balance, including Capex, R&D and Talent Acquisition. The UK produced nearly 1.7 million light vehicles in 2015, of which, a vast majority of these units are exported. The UK’s largest export market was the EU, accounting for 57% of vehicle exports.
Asia
While both the share of deal volume which targeted Asian assets and share of deal volume by Asian acquirors increased slightly for the first half of 2016, the share of deal value by both Asian target and acquiror fell in the first half of 2016 compared to 2015.
Top 20 automotive transactions, 2016
TAGS:


Stay up to date with M&A news!
Subscribe to our newsletter
