

Introduction
Total reported global oil and gas deal value and volume down sharply in 2015
The dramatic drop in both crude oil and natural gas prices across the year combined with a high level of uncertainty about their future trajectory challenged oil and gas merger and acquisition (M&A) activity in 2015. Crude oil prices, which began the year at US$55 per barrel (Brent), declined to US$37 per barrel by December, the lowest level since May 2004 with natural gas prices experiencing a similar journey. With crude oil production continuing to outpace demand by 2 million barrels per day, and with no clear sign when the market will rebalance, prices have continued to decline in 2016. While there is general consensus that there will be no rapid recovery in prices, the expectation continues that eventually the market will balance to full cycle marginal cost and that will support a recovery.
A range of factors led to greater price volatility, which included uncertainty about the sustainability of US and other production at lower prices, the impact of the lifting of Iranian sanctions, geopolitical instability (particularly related to the impact of lower prices on countries reliant on oil revenues), the economic outlook for China, and concerns more broadly about global energy demand.
The oil and gas industry is in the midst of a significant structural shift — a move from an era when capital investment decisions were driven by the perception of “resource scarcity” to an era of “abundance” when oil and gas reserves seem plentiful. Excellence in operational and project execution has become essential not only to success but to survival. For many, 2015 was a difficult and turbulent time as traditional energy business models had to change in order for companies to survive in a new “resource abundant” world.
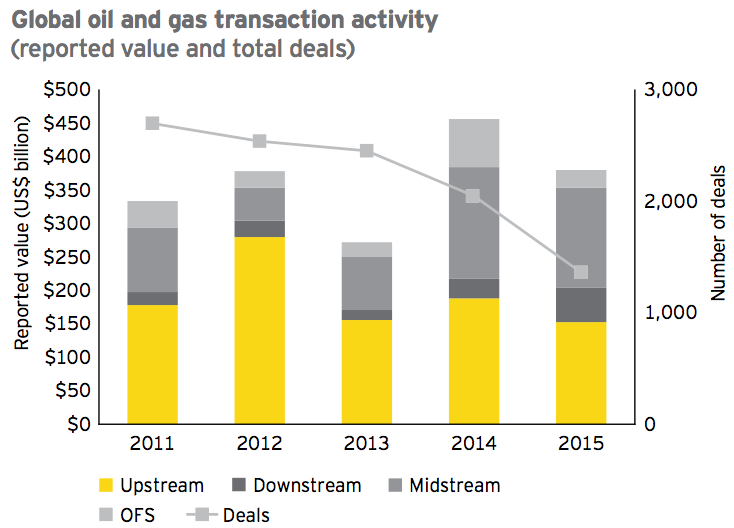
Against this back drop, total global reported deal value declined in 2015 to just under US$380 billion, a reduction of 17% compared with 2014, while the total number of oil and gas transactions declined by almost 33%.
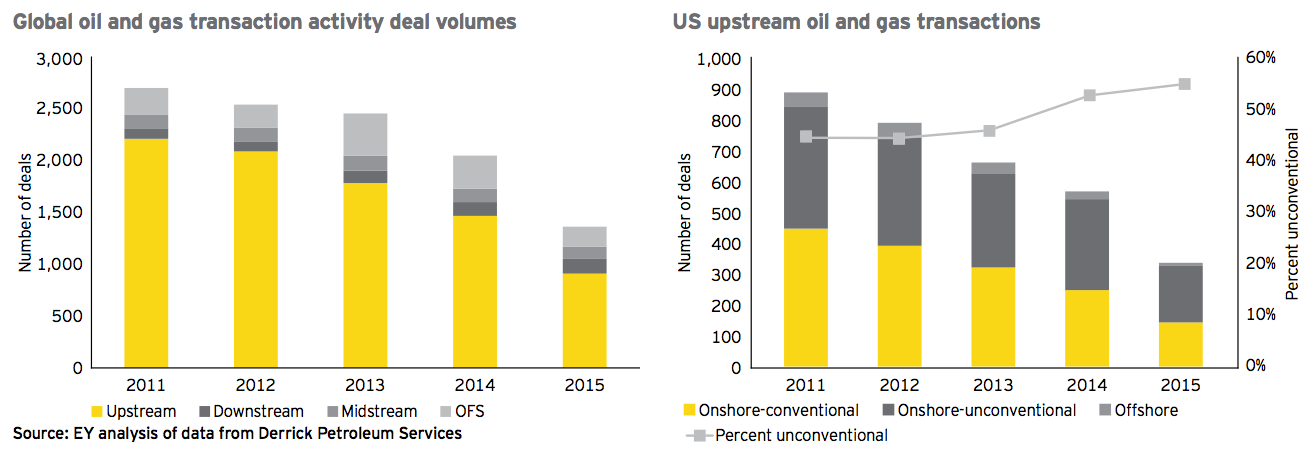
Deal volume was down in nearly all sectors in 2015 compared to 2014, most notably in OFS where the number of deals decreased by almost 40% from 320 to 193, and in upstream where deal volume dropped from 1,467 in 2014 to 910 in 2015, a 38% decline.
Deal value declined in most sectors as well. In OFS, deal value was down by almost 63%, perhaps unsurprising given the declining rig count and substantial cuts in capex. Upstream deal value was down 19% and would have been hit even harder but for one announced deal, Royal Dutch Shell’s pending acquisition of BG Group, which accounts for 54% of the 2015 total disclosed upstream deal value. Downstream, deal value increased reflecting a number of sizeable transactions involving refining assets in the United States.
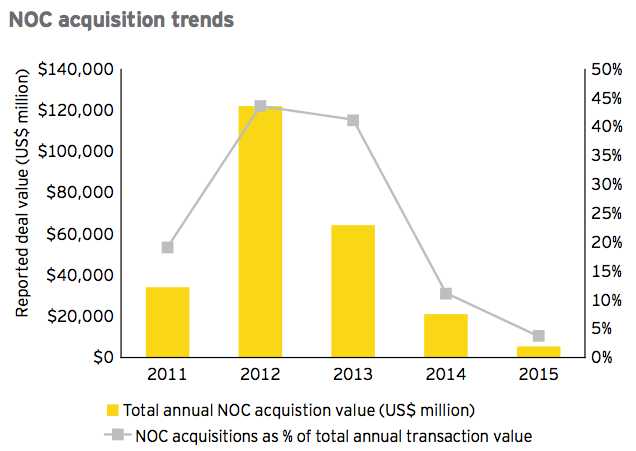
Some 2014 trends continued into 2015. The decline in national oil company (NOC) M&A activity continued in 2015, and total NOC deal value dropped to US$6.1 billion from about US$21 billion in 2014, down significantly from the 2012 record of almost US$122 billion. In our 2014 report, we expected Chinese and Asian NOCs to take advantage of attractively priced assets, but the combination of lower oil prices and oil price volatility challenged such activity with many NOCs focusing more on their portfolios than on growth.
Oil price outlook uncertainty and concerns over whether acquisition prices would fall further also limited private equity M&A activity in oil and gas in 2015. There is, however, a significant pool of industry and financial investor capital targeting the sector which could be very busy in 2016.
In upstream, oil-weighted deals continued to dominate over gas-weighted deals in 2015. However, Royal Dutch Shell’s pending acquisition of BG Group is a hallmark example of an acquisition more equally weighted between oil and gas. In addition, several large-scale gas development projects were able to attract capital during 2015. Volatility had a particular impact on North America where transaction volume fell sharply.
As in prior years, midstream transaction activity, both in volume and value, was dominated by North America, which accounted for 84% of all deals and about 97% of the global midstream disclosed value. In the downstream, the US accounted for nearly half the transactions, while activity in the Middle East, Asia and Africa was limited given the high levels of state ownership.
During 2015, oilfield services companies focused on streamlining operations and cutting costs to generate the efficiency savings required to operate in a new low oil price environment. Oil price uncertainties and this focus on operational performance were key reasons for the markedly lower OFS M&A activity.
Looking forward to 2016, we expect to see more motivated sellers and more consensus on valuations in a period of “lower for longer” prices. Consolidation will be driven by overcapacity, intense margin pressures and generally weaker capital markets.
Deferring transactions until prices return to higher levels and/or become less volatile will no longer be a viable option for many oil and gas companies, and, as a result, transaction volumes should increase in 2016 as companies re-evaluate their positions and strategies. We also expect that some companies under severe liquidity pressure will be forced to transact, whether driven by lenders, shareholders, activists and/or management. This may accelerate the process of price discovery in the asset market, which was a key blocker to M&A activity in 2015.
Although the increasing consensus of lower for longer will also bring price expectations between buyers and sellers closer together, deal value, especially in the upstream, is expected to be lower given the low-price environment. Prices are expected to stay low throughout 2016 with some expectation of an increase by the end of 2016, as non-OPEC production declines in reaction to sustained low prices (and absent supply disruptions). This is now subject to further uncertainty depending on the speed at which Iranian crude comes on to the market.
In the upstream, we expect distressed transactions of higher-quality assets and portfolios will feature as hedges run out and lender covenants can no longer be stretched. Distressed companies may be available at lower prices than in 2015, and there will likely be an increased level of stress-driven sale processes. In addition, transaction structures may increase in complexity as swaps and strategic alliances become more common. A relentless focus on capital discipline will continue such that only those transactions with sustainable economic returns will attract large capital investment.
In the midstream, we expect deal activity to continue in 2016 as upstream companies look to monetize their midstream assets to de-leverage balance sheets and fund capital programs. The launch of the Mexican FIBRA E, a newly designed public structure that will be used to hold primarily Mexican midstream and infrastructure assets, could also support increased deal activity. The FIBRA E is expected to allow the Mexican markets to raise capital for much-needed Mexican infrastructure build-out. In Europe, the newfound appetite for “infrastructure plus” funds for midstream assets should motivate divestments.
In the downstream, fundamentals driving transaction activity remain robust. We expect oil majors will continue to review their downstream portfolios, which could result in divestments of non-core downstream operations to improve capital returns as well as increased investment in core regions. However, this expected trend could be moderated by substantially lower upstream returns that put increased focus on the benefits of the integrated business model and the current ability of downstream assets to generate substantial operating cash flows.
In oilfield services, we expect larger companies with strong balance sheets as well as private equity to acquire companies with over-leveraged capital structures, a development we have already seen in the seismic, offshore drilling and construction space. Specialist debt investors, such as hedge funds and distressed funds, have also amassed war chests to target struggling companies. We also expect companies will consider financial solutions such as sale and leasebacks or farm-down agreements to reduce balance sheet pressure. The valuation gap that challenged deal completion in 2015 is expected to narrow in 2016, and deal structure variations in the near term are expected to help reconcile valuation gaps that persist.
As the oil industry transforms itself to become profitable at lower price levels, the OFS industry will have to mirror this to survive and thrive. In particular, the increased focus on technology and supply chain integration is expected to continue supporting OFS transactions that build vertical integration. We expect consolidation will continue to be a theme with a focus on mega mergers (deals valued at US$1 billion+) and related follow-on activity as merging companies divest to comply with regulatory requirements.
While it is always difficult to “call the bottom,” the belief in 2015 was that 2016 was going to be more challenging from a price and financing perspective. Looking further forward, one could hope that 2017 will see the beginnings of a recovery — if 2016 is indeed the low-water mark, then a wave of opportunistic transactions, perhaps deferred from 2015, can be anticipated this year.
Upstream
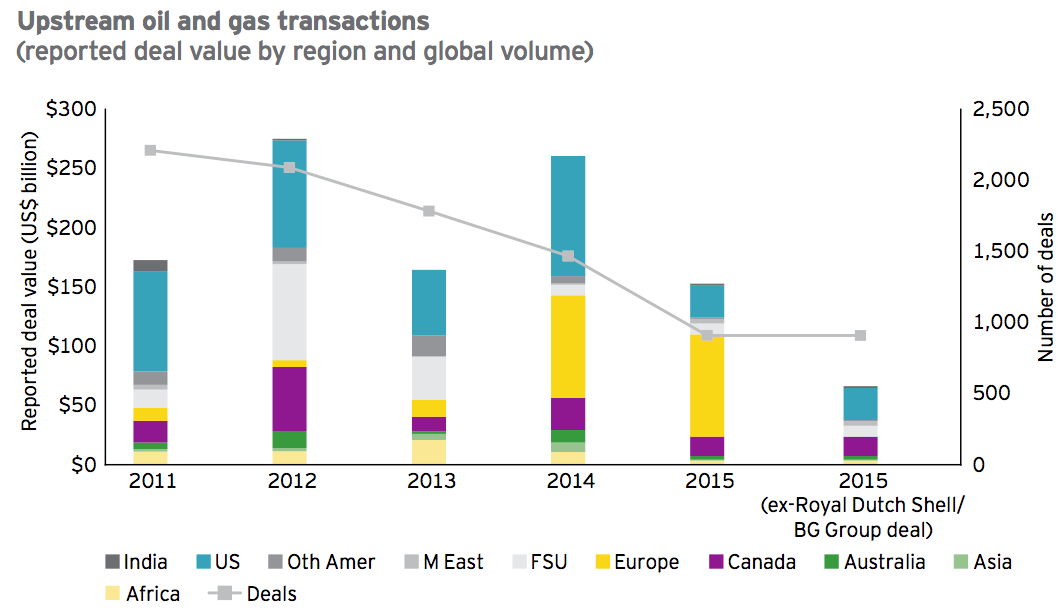
2015 tested the oil and gas industry’s threshold for sustained depressed oil and gas prices, driving home the message that capital discipline is critical. In 2015, the largest upstream acquisition in over five years — Royal Dutch Shell’s pending acquisition of BG Group — was announced. Indeed, the Royal Dutch Shell-BG Group transaction accounts for 54% of the 2015 total US$153 billion disclosed upstream deal value. And in 2015, upstream capex was cut by a record US$147 billion as public and national companies of all sizes moved to preserve precious cash.
When the Royal Dutch Shell-BG Group transaction is taken out of the equation, the number and value of upstream M&A transactions was the lowest in the past five years. Nine hundred and nine (909) deals for a total value of US$71 billion were disclosed — a more than 55% reduction from the 2014 disclosed value of almost US$189 billion. Although some of the decline in value from 2014 to 2015 can be attributed to lower commodity prices, data also highlights a steady five-year decline in deal volume. In 2015, just under half the number of deals were disclosed as compared with 2014 volume, and just under a third as compared with 2011.
What happened in the world of upstream M&A in 2015 and what might be in store for 2016 as we start the year with dramatically lower oil and gas prices?
2015 — a year in transition for upstream M&A
The past 12 months have continued upstream’s transition from a sector of growth and opportunistic M&A to one of capital discipline and targeted transaction activity. While several independents restructured, distress-led deal flow was lower than expected as those with stronger balance sheets focused on portfolio optimization and acted conservatively in light of oil price volatility.
In such a complex environment, price consensus has been an understandable barrier to activity. Lenders, rating agencies and companies have all lowered their expectations for price recovery with several noting that lower prices may persist for years. Additionally, there has generally been increased short-term use of the forward curve in bid evaluations.
However, commodity price has not been the only challenge in the transaction landscape with project break-even prices, remaining reserve life and agreeing the quantum of decommissioning liabilities also proving to be major barriers to M&A transactions. Deals related to development and late-life assets slowed because of the sensitivity of there owner’s valuations to the short-term price outlook and the potential impact of earlier cessation of production.
The key upstream themes observed during 2015 were:
1. Comprehensive portfolio management by majors and some NOCs
2. Aggressive capex reductions across the board
3. Fewer distressed M&A transactions than anticipated
4. Cooperation amongst all stakeholders to protect common interests, recognizing the interdependencies of many parties and projects
5. A rude awakening for mature basins as talk of decommissioning liabilities takes priority
6. Continued drop in NOC investment and failure of several countries to attract investment
Upstream M&A themes for 2016
At the start of 2015, crude oil prices were $55/bbl, the lowest in four years ($54 as at 6 May 2009), and there was hope, and in some cases expectation, that prices would climb higher. However, with prices now well below $35/bbl and given OPEC’s resolve to protect market share rather than price, there is a consensus developing that prices will be lower for longer as supply and demand fundamentals reset, capital requirements continue to be stripped down and high-cost projects are shelved. However, many question when the lack of capital investment in both exploration and development will bite, causing prices to stabilize at higher levels that are more in line with the breakeven of most newly discovered basins.
We predict four themes for upstream oil and gas M&A in 2016:
1. Continued low M&A value with some recovery in volume
We expect deal value to remain depressed, especially given lower crude oil and natural gas prices, but foresee increased deal volume in 2016. Distressed transactions of higher-quality assets/portfolios will feature as hedges run out and lender covenants can no longer be stretched. Distressed companies may be available at lower prices than in 2015 as capital commitments loom, the low-price environment depletes cash and as financing structures become increasingly strained. There will likely be an increased level of creditor-driven sale processes.
2. Increasingly complex transaction structures
Transaction structures may increase in complexity as swaps and strategic alliances become more common. The Statoil–Repsol multi-asset swap at the end of the year is an example of larger players leveraging their portfolios to bridge potential valuation challenges. In addition, transactions with milestone payments rather than pure cash up front may become the norm as both buyers and sellers look to manage their exposure to commodity price volatility and other future uncertainties, such as potential decommissioning liabilities.
3. Relentless focus on capital discipline
Large-scale development projects will be reworked, and only those transactions with sustainable economic returns will be able to attract large capital investment from both existing and new participants. Farm-outs will feature as companies with capital- constrained quality projects seek to attract the interest of those with strong balance sheets. The oversupply of farm-outs with near-term capital requirements is likely to continue.
4. Fewer megadeals
In 2016, there will likely be fewer transactions valued at US$1 billion+ as valuations drop/reset and because quality opportunities continue to be scarce. We expect to see portfolio optimization transactions and some more sizeable divestment campaigns. It would be surprising if some of the larger well-capitalized companies do not use lower prices to opportunistically refresh their portfolios and this could involve some sizable corporates becoming acquisition targets.
Regional overview of upstream M&A activity
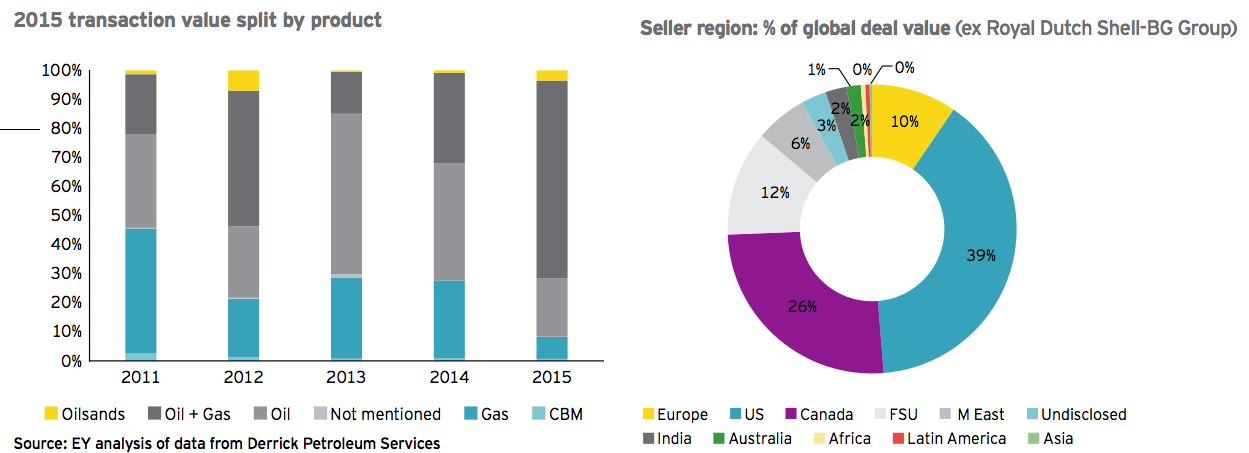
Regional nuances layered additional complexity on to the overarching impact of sustained lower commodity prices. Transaction volume and value were materially lower in 2015 as compared with 2014 in every region except Europe and the Middle East, with the former Soviet Union holding steady. Transaction value in Latin and South America was the lowest in five years, down from the previous four-year average of just over US$11 billion to a mere US$1 billion in total 2015 value, despite the highly anticipated Mexican licensing rounds and Petrobras’ planned divestment of deepwater offshore oil province assets.
Europe was prominent as a region in 2015 because of the announced Royal Dutch Shell-BG Group transaction; both companies are headquartered in Europe. When the Royal Dutch Shell-BG Group deal is excluded, North America was the clear leader in upstream transactions by value in 2015, as it usually is, with over 61% of total deal value. However, the total transaction value recorded in the US was just 27% of 2014 levels.
The dramatic decline in value of US activity is a function of the degree to which many US companies are capital-constrained and the price volatility that has challenged valuation. Just 13 transactions valued at more than US$500 million (totalling US$16 billion) were reported in 2015. There were approximately 321 lower-valued transactions with a total disclosed value of approximately US$0.90 billion). Deals involving US unconventional assets featured prominently as they did in 2014 and included three megadeals with value totalling US$7.9 billion:
► Noble Energy’s US$3.8 billion acquisition of US unconventional player Rosetta Resources
► US independent WPX Energy’s US$2.75 billion Permian entry with acquisition of RKI Exploration
► Shanghai-listed Yantai Xinchao Industry Co’s acquisition of multiple Midland basin oil fields from US private equity-backed oil and gas companies for US$1.31 billion
In Canada, 2015 disclosed transaction value totalled US$16.3 billion, including, rather uncharacteristically, four megadeals (US$1 billion+) with a total value of approximately US$10 billion and the second-largest global transaction of 2015 — Suncor Energy’s US$5 billion pending acquisition of Canadian Oil Sands. As the relatively mature and high-cost Canadian oil and gas industry continues to struggle under the pressure of combined low crude oil and natural gas prices as well as limited access to equity capital markets, the future for hundreds of small oil and gas companies remains challenged. Going forward, it may be useful to consider a broader universe of potential buyers in transactions; for example, Ontario Teachers’ Pension Plan was the acquirer of royalties from Cenovus Energy for $2.7 billion. Royalty transactions were featured in the remaining three Canadian megadeals as companies looked to monetize future cash flows:
► Ontario Teachers’ Pension Plan’s acquisition of royalties from Cenovus Energy for US$2.7 billion
► Prairie Sky’s acquisition of royalties from CNR for US$1.35 billion
► Crescent Point Energy’s corporate takeover of Legacy Oil + Gas for US$1.25 billion
Disclosed transaction value in the former Soviet Union held steady in 2015 with a total of approximately US$9.2 billion concentrated in four transactions:
► US$4.7 billion cash injection into NOC KazMunaiGas by Sovereign Wealth Fund Samruk-Kazyna in exchange for 8.4% of the Kashagan Field
► Middle East’s Emirates NOC completed their ~US$2 billion takeover of Dragon Oil (whose principal asset is in Turkmenistan)
► Acquisitions of Rosneft’s assets by Indian NOC ONGC and BP made up an additional US$2 billion
In Europe, M&A activity was primarily dominated by changing strategies of the European utilities, and the regulator-driven sale of UK assets by LetterOne Energy. Excluding the Royal Dutch Shell-BG Group transaction, the remaining ~122 disclosed deals had a total value of just under US$5 billion, US$2.25 billion of which was from two Letter One Energy transactions — the sale of its UK position to upstream newcomer INEOS, and its acquisition of European utility E.ON’s Norway portfolio. A sale of a partial stake in Total’s gas development project in the UK North Sea for US$876 million attracted upstream newcomer UK utility SSE. Wintershall’s ~US$600 million Norwegian divestment to Sequa Petroleum was the only other European transaction in excess of US$175 million. Numerous UK North Sea processes continued without closure as decommissioning liability timing and valuation uncertainty continued to be major transaction barriers.
Worthy of note in the Middle East is Saudi Arabia’s successful sale of production concessions for a total of approximately US$3.8 billion. In a year where multiple licence rounds failed to attract investment, this was a positive example of the successful restructuring of nationalized assets.
Overall, there were fewer megadeals in 2015, only partly driven by lower commodity prices and future outlook. The 18 deals that were valued at more than US$1 billion included the following:
► Canada: 4 deals totalling US$10 billion
► US: 3 deals totalling US$7.9 billion
► FSU: 3 deals totalling US$7.9 billion
► Middle East: 2 deals totalling US$3.1 billion
► Africa, Australia, Asia, North Sea: 1 deal in each region
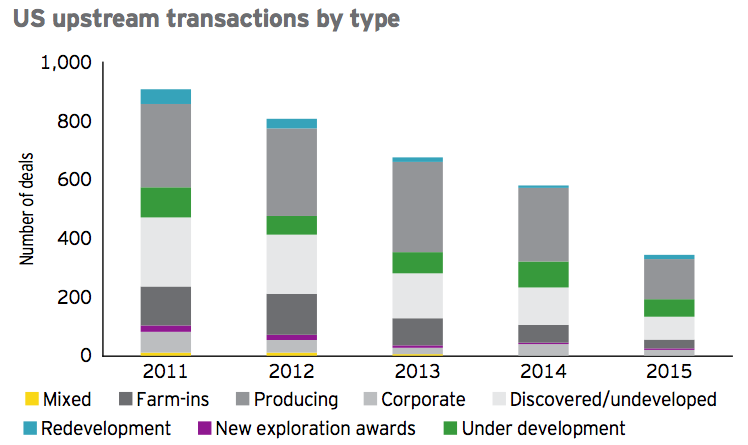
Type of transaction and characteristic of assets
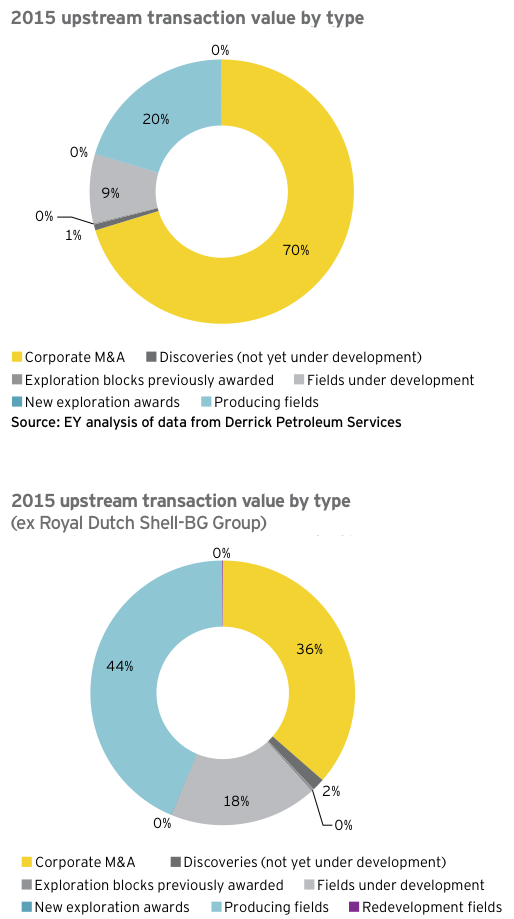
As predicted, M&A capital flowed to oil-weighted opportunities (with LNG featuring via the Royal Dutch Shell-BG Group transaction).
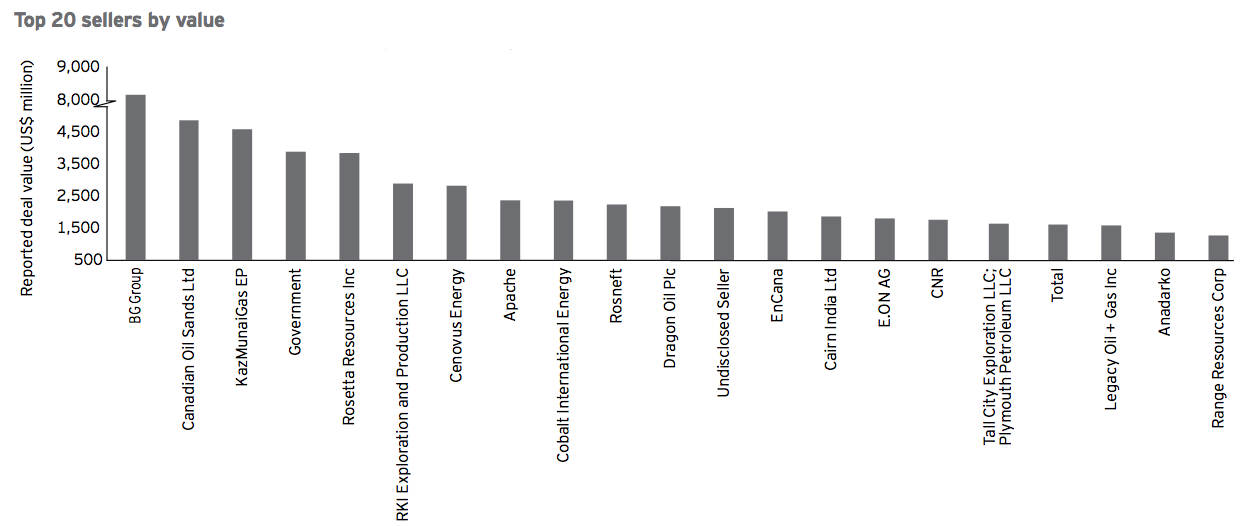
Over 86% of 2015 upstream M&A divestments concentrated in 20 sellers
In 2015, 83% of total deal value was concentrated in 20 sellers. Excluding BG Group, close to 63% of global upstream transactions (US$45 billion) were concentrated in the remaining top 20 sellers, which is up from 2014 when the top 20 sellers had just over half of the total transaction value. As was the case in 2014, international oil companies (IOCs) continued to dominate the top seller list. However, Saudi Arabia and KazMunaiGas were in the number three and four spots, respectively. In 2015, Saudi Arabia sold new production concessions and KazMunaiGas sold a stake in the Kashagan Field. Total sold the highest number of individual packages (8) with the majority of sellers announcing one or two deals in 2015.
IOCs continue to dominate buyers with a few exceptions
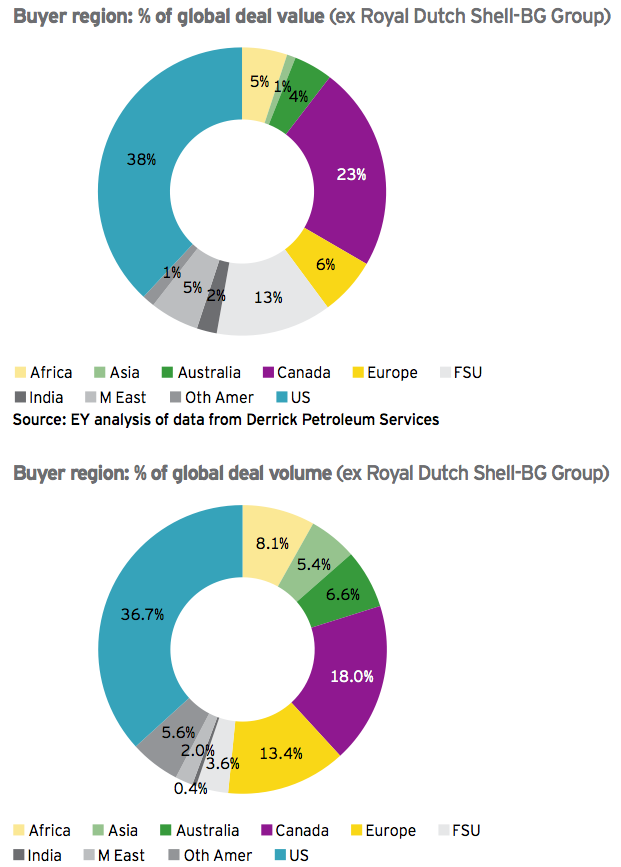
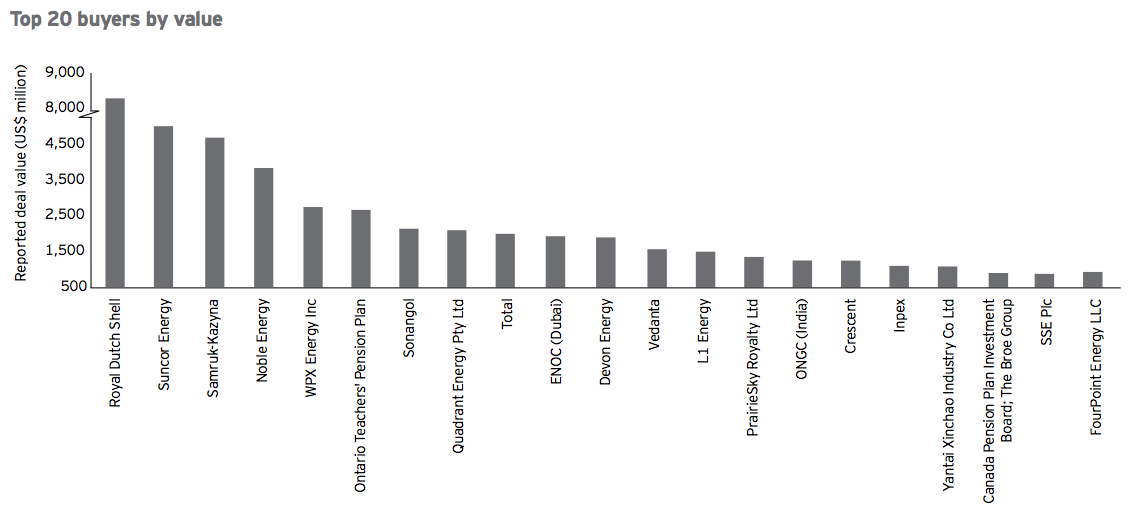
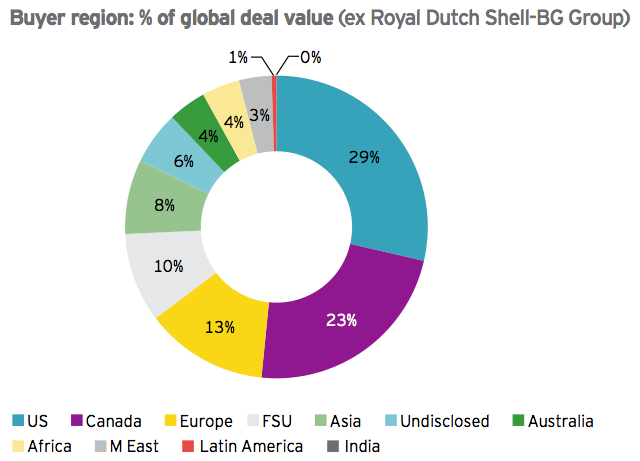
IOCs also dominated the list of top 20 buyers in 2015. With 85% of total disclosed transaction value and excluding Royal Dutch Shell, the top 20 still accounted for 65% of total deal value. Buyer location continued to be geographically diversified, although in keeping with 2014, close to 70% of buyers (excluding the pending Royal Dutch Shell-BG Group transaction) were in North America and Europe.
Although four of the top 20 buyers by value in 2015 were NOCs and Sovereign Wealth Funds (totaling US$10 billion), NOC spending continued to decline and NOC acquisitions dropped to an all-time low in 2015. Deals in which NOCs were buyers made up only 4% of total transaction value.
While NOCs have not historically been sellers, several are conducting portfolio rationalization reviews in anticipation of potential divestments. The timing of the return of NOC’s to the M&A market remains uncertain.
In 2016, sellers will need to continue to identify non-traditional buyers and new market entrants, particularly as some M&A may be accomplished through the sale of debts, refinancing or other non-traditional structures.
Midstream
Midstream transaction volumes and disclosed values decreased in 2015. With 105 announced deals, deal volume was down 8% as compared with 2014. Although reported deal value of US$149.5 billion was down from US$166 billion in 2014, this remains at a historically high level recognizing the record values posted in 2014.
As in prior years, midstream transaction activity, both in volume and value, was dominated by activity in the US and Canada, which accounted for 84% of all deals and about 97% of the global midstream disclosed value. The following table details how deals were split across asset type:
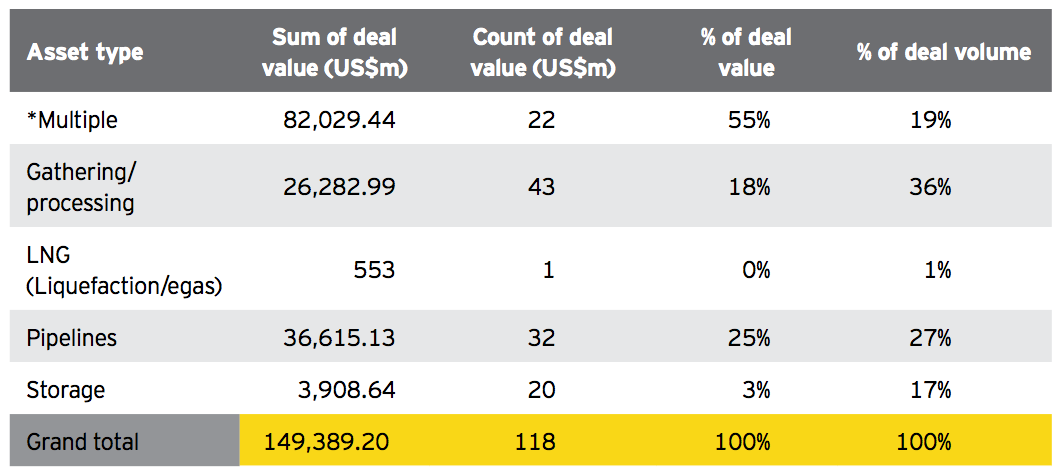
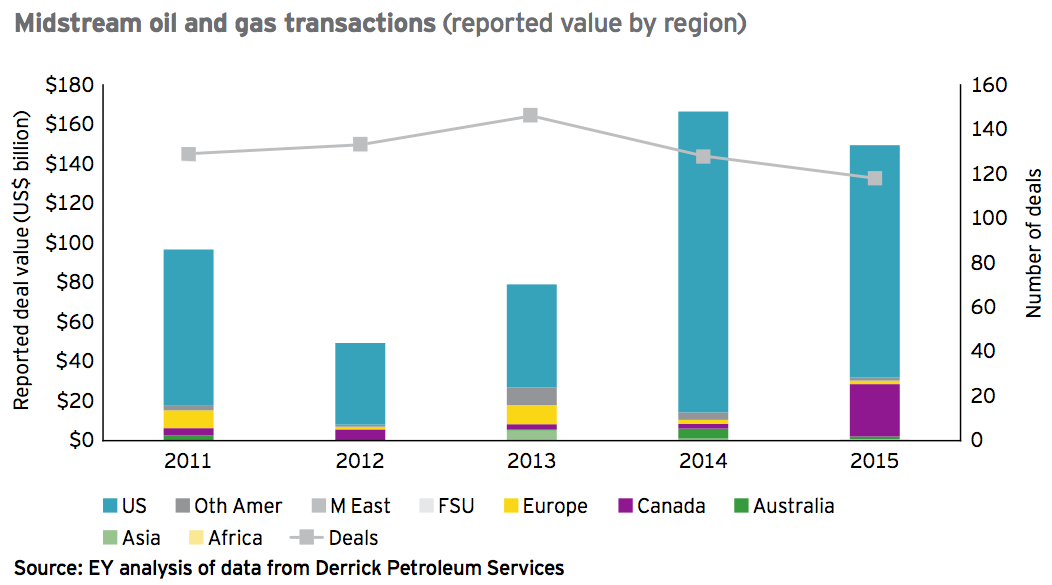
Asset transactions dominated the volume of transactions, accounting for 55% of all deals; however, they represented only 9.8% of the disclosed transaction value in 2015. Corporate transactions accounted for almost 24% of all transactions, but almost 67% of the total reported value. The remaining 23 transactions (almost 22% of the total and representing almost 24% of the disclosed transaction value) resulted from dropdowns of midstream assets from corporates into master limited partnerships (MLPs) underlining the importance of this type of activity.
In 2015, remarkable commodity price volatility had significant impacts throughout the oil and gas industry, including the midstream subsector. Midstream companies continued to focus on capital expenditure rationalization, as well as “just-in-time” investments, with planned capital expenditures likely delayed until a firmer outlook on commodity prices emerges. The lower US and Canadian oil production growth forecasts (due in large part to the current price environment) has likely led to fewer organic growth opportunities.
Despite a strong start to 2015, MLPs had a rocky second half of the year, with price decreases reversing a significant amount of the prior year’s growth. The MLP market continued to be impacted by merger activity (and discussions of future mergers or consolidations), and more focus has been placed on asset quality, counterparty strength, the size and strength of the MLP’s sponsor, and the growth forecasts associated with MLPs. Following in the footsteps of the Kinder Morgan consolidation (that was announced in 2014), Targa Resources Inc. announced the acquisition and consolidation of Targa Resources Partners, LP (a US MLP) in 2015. Similarly, other MLPs have either referenced or effected consolidation and/or roll-up transactions. Although the mergers and consolidations are transformative transactions in the MLP space and have attracted significant attention, the decision to effect such a transaction is very company and fact specific, and we do not expect that such transactions will become common. However, these transactions do suggest potential ultimate exit scenarios for current or potential MLPs, depending on growth and relative economic environment. The MLP as an investment vehicle and company structure continues to have a unique role in today’s marketplace, as well as in the build-out and operation of midstream infrastructure assets.
For 2016, if prices stabilize and public markets reopen to oil and gas-related assets, the midstream sector could see a resurgence. However, with the continued volatility and uncertainty in the pricing environment, transactions may continue to trend downward. Continued monitoring will be necessary to evaluate the investment environment and market timing with an ongoing focus on the US MLP market. Also of interest in 2016 may be the addition of the Mexican FIBRA E, which is a newly designed public structure that will be used to hold primarily Mexican midstream and infrastructure assets. With many key features modeled after the US MLPs, the Mexican FIBRA E is expected to allow the Mexican markets to raise much-needed capital for Mexican infrastructure build-out.
Outside of North America, the emergence of new classes of buyers for infrastructure assets was visible in many mature markets including the UK and Australia where large pipeline assets were acquired by “infrastructure or infrastructure plus” investors. The market for downstream storage assets was also very buoyant with healthy demand for these types of assets. As oil companies look for ways to raise capital, the relatively healthy asset pricing in this segment will likely drive a continuing wave of divestments.
Downstream
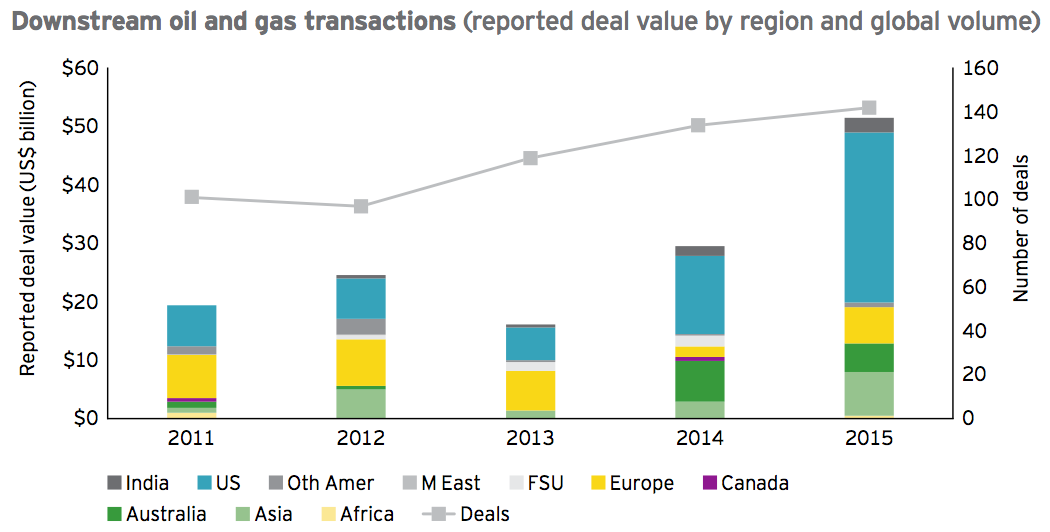
Downstream transaction activity levels in 2015 were similar to levels in 2014. In 2015, there were 142 transactions with disclosed deal value of US$51.5 billion as compared with 134 transactions with a disclosed deal value of US$29.6 billion in 2014.
The US accounted for nearly half of the downstream transactions, while Asia (including Australia) and Europe accounted for about 25% and 12%, respectively.
There were 91 asset transactions and 51 corporate transactions during the year.
Across the downstream subsectors, deal volume was limited in the Middle East, Asia and Africa because of:
► The high levels of state ownership
► Political instability and pricing regulation impacting the attractiveness of assets in Africa
► Growth in oil product demand in the Asia-Pacific region with infrastructure in Singapore, Malaysia and South Korea acting as trading hubs for the region
As we expect these conditions to continue, we do not expect any significant change in the downstream value or volume of transactions in these regions in 2016.
Refining
In the refining subsegment, the two largest transactions involving refineries during 2015 (based on disclosed deal value) were:
► Chevron’s divestment of its 50% stake in Caltex Australia (an integrated refining, distribution and marketing operation) for US$3.7 billion
► Western Refining Inc.’s acquisition of the remaining 61.6% stake in Northern Tier/Energy LP (a refinery in Minnesota and 165 convenience stores located primarily in Minnesota and Wisconsin) for US$1.6 billion
In the US, crude runs were at record highs during 2015 as refiners continued to benefit from strong refining margins due to advantaged feedstock and growth in domestic oil demand (c.+290,000 b/d). There were only four US refining transactions during the year.
We expect similar activity levels during 2016 as crude runs and oil product demand growth (c.+160,000 b/d) are forecast to remain strong. The key unknowns relate to the impact of the lifting of the US crude export ban and the reaction of tight oil to the lower price environment.
In Europe, excluding asset swaps and sale of minority stakes, there were effectively no refining transactions during 2015 despite European refining margins reaching record highs. Overcapacity continues to impact prospects of any sustained recovery in refining margins and more closures may be needed to restore parity with demand (which is forecast to decline by c.100,000 b/d in 2016). Current refining margin levels could provide an opportunity for owners to divest their non-core refining assets in 2016.
Refining transactions in Asia during 2015 have been limited to the sale of minority stakes in various integrated downstream operations. Given the forecast regional oil demand growth (c.815,000 b/d in 2016), we expect refining transactions in 2016 to remain low. However, dynamics are evolving as capacity ramps up in the region as well as in the Middle East.
Storage terminals
In the storage/terminal subsegment, the two largest transactions in 2015 (based on disclosed deal value and excluding related-party asset transfers) involved:
►Vitol’s acquisition of the remaining 50% stake in VTTI from MISC Berhad for US$830 million
► Ardian’s acquisition of an additional 10% stake in CLH from Repsol for US$364 million
Around 40% of storage terminal transactions in 2015 were in the US, primarily driven by the difficulties in developing greenfield sites in the country. We anticipate deal activity to remain at similar levels during 2016. However, should the US start exporting crude oil in volume, there is likely to be additional demand for storage terminals.
There has been a noticeable increase in storage transactions in Europe during 2015 as owners look to divest their non-core assets. A majority of these assets have been acquired by traders (due to the contango opportunities) and infrastructure funds (who are attracted by relatively stable returns). In 2016, although competition for storage assets is likely to remain strong, we expect that there may be less opportunities as storage terminals continue to be strategically important in the downstream value chain. The alternative is to build or acquire refineries and convert them to storage terminals. However, this can often be more expensive than anticipated.
Retail
In the retail/distribution subsegment, the second largest deal after Chevron’s divestment of Caltex (see the “Refining” section) was:
► Acquisition of Susser Holdings (674 retail stores) by Sunoco for US$1.9 billion
In the mature US and European markets, economies of scale (volume) are typically the key driver of profitability as competition naturally restricts fuel margin levels. However, this does not necessarily imply direct ownership of retail sites. As such, the strategy of major oil companies is based around optimizing the balance between “value added” and “capital employed” to minimize cost.
There were 35 transactions in the US and 17 in Europe in 2015. We expect there will be further consolidation in these regions during 2016 and continuing strong interest from various parties for retail marketing networks, particularly those with strategically advantaged throughputs, strategically located sites and strong non-fuel offerings (or an ability to develop one) from:
► Regional and national oil companies looking to expand within their supply envelope
► Independents, traders and branded wholesalers looking to improve their market share and economies of scale
► Financial investors looking to build competitive advantage through specialization and regional scale as opposed to control over the full supply chain
Given the level of competition, retail marketing networks of appropriate quality and scale in the right markets would likely command a premium.
The only transactions of note in Asia were Idemitsu’s acquisition of a 33.2% stake in Showa Shell for US$1.4 billion and Rosneft’s acquisition of a stake in Essar Oil.
Trends and future prospects
Fundamentals driving transaction activity in the downstream sector remain robust. The strategic focus of oil majors continues to be on upstream with capital expenditure weighted towards exploration and production (E&P). As such, oil majors will continue to review their downstream portfolio, which often leads to divestments of non-core downstream operations to improve capital returns, while also continuing to invest in their key growth core regions. However, the return of oil price volatility may delay this process as companies rediscover the benefits of the integrated business model.
Oilfield services
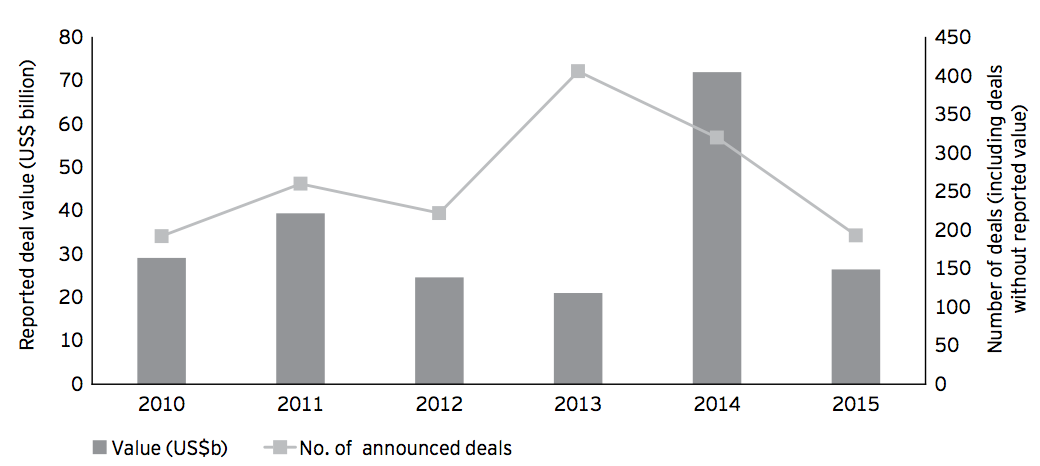
2015 has continued the downward trend of transaction activity in the oilfield services sector from a peak of 406 deals in 2013 to 193 deals in 2015, a decline of 52%. The total disclosed deal value was US$26 billion, over US$10 billion below the average of the preceding five years and a significant US$45 billion decline on 2014. Average disclosed deal values also decreased from US$600 million in 2014 to US$335 million in 2015. However, both 2014 and 2015 were distorted by pending mega mergers — Halliburton and Baker Hughes in 2014 for US$38 billion, and Schlumberger and Cameron in August 2015 for US$15 billion. Excluding both these transactions, total disclosed deal value in 2014 and 2015 would have been US$34 billion and US$11 billion, respectively, a decline of 67% year on year. Average disclosed deal value would have been US$283 million in 2014 and US$150 million in 2015, a decline of 48%.
These statistics are hardly surprising given the challenges confronting the sector. Since June 2014, in the face of weakening demand and a surge in oil production, the industry has been subjected to an oil price decline of over 60%, capex cuts of US$147 billion for 2015, and a continually declining rig count, with North America experiencing the worst impact with declines in excess of 60%.
During 2015, companies streamlined operations and cut costs to generate the efficiency savings required to operate in the new oil price environment. Oil price uncertainties and focus on operational performance are key reasons for limited M&A activity in OFS in 2015 and could continue to impact the transaction environment in 2016.
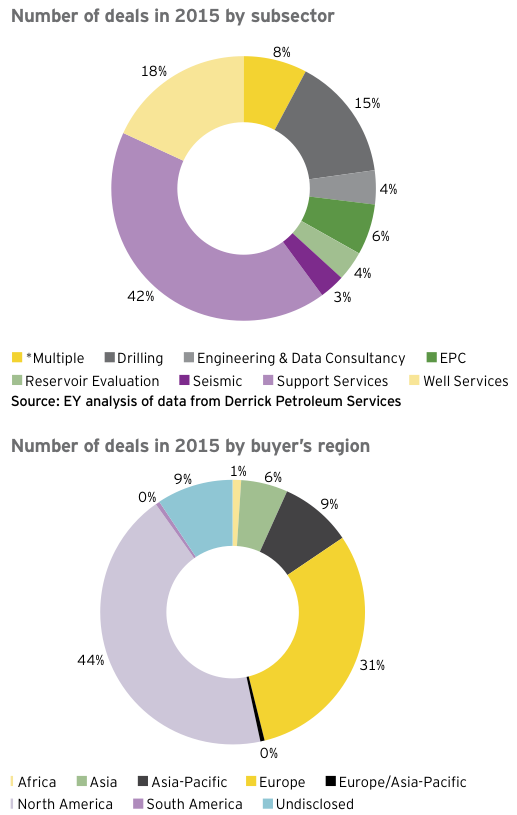
There were 129 corporate transactions in 2015, representing 67% of total deal count and 94% of total announced deal value. 44% of all transactions (including asset deals) had an offshore focus, 35% were mainly land based with 21% involving a mixture of both on and offshore operations. Once again, North America transacted the most with a total of 84 deals involving a North American buyer (representing 44% of total deal count and 74% of total deal value). Europe was second with a total of 59 transactions involving a European buyer, representing 31% of total deal count and 17% of total deal value.
The most acquisitive subsector by far was support services, which announced 81 transactions globally (42% of total deal count), the largest deal being the acquisition of Netherlands headquartered, maintenance, modification and asset integrity services provider Stork Holding BV by Fluor Corporation in December 2015 for US$755 million. Second in terms of deal size was the acquisition of UK-based Survitec Group, a provider of marine, offshore, defense and aerospace survival technologies, by private equity firm Onex Corporation for US$680 million in January 2015 and a close third was the acquisition of Esvagt, the UK/Norwegian-based offshore emergency and rescue services provider, by 3i Infrastructure PLC and AMP Capital for US$610 million.
Well services contributed to 35 transactions, the top by value being the minority acquisition by Dutch investment company 7 Industries of a 26% stake in Welltec from Summit Partners for US$222 million.
The drilling sector announced 29 deals. The largest deal was the take-private of Eurasia Drilling Company in October 2015, which valued the Group at US$2.2 billion following the failed acquisition by Schlumberger earlier in the year. Also making the top 10 list was the US$386 million acquisition of Canadian-based driller CanElson Drilling by Trinidad Drilling.
The remaining transactions in the top 10 list include those companies that span multiple OFS sectors, the largest being the acquisition of Cameron by Schlumberger for US$14.8 billion. In May, TBG Holdings acquired Italian-based valve manufacturer, Petrolvalves for US$1.1 billion; in August, Ezra Holdings, the Singapore-based provider of integrated offshore solutions, was acquired by Japanese engineering and construction company Chiyoda Group for US$625 million; and in October, Eni disposed of a 12.5% stake in Saipem for US$511 million. The final deal to make it into the top 10 list is Dayang Enterprises’ acquisition of vessel owner and operator Perdana Petroleum for US$334 million.
Outlook for 2016 Increased stress in the sector
Over the second half of 2015, stress and distress were evident but more companies are expected to enter this arena in 2016. Typically, those facing the most severe pressures have over-leveraged capital structures and are likely to be exposed to the capex/exploration phase of the cycle with casualties already seen in the seismic, offshore drilling and construction space.
This will create opportunities for larger companies with strong balance sheets and private equity institutions with surplus funds to snap up struggling companies before they are forced into administration. Specialist debt investors such as hedge funds and distressed funds have also amassed war chests to target struggling companies. With some bonds trading as low as 30 or even below, various funds have also looked to buy in debt at low prices for trading purposes and for loan-to-own situations. As the stress in the sector continues, more of these investors will be attracted to the sector.
As well as typical M&A activities, companies are also looking for financial solutions such as sale and leasebacks or farm-down agreements to reduce balance sheet pressure. For example, in June, PGS entered into a sale and leaseback for the PGS Apollo, while Paragon Offshore entered into a combined US$300 million sale and leaseback agreement for two of its jack-up rigs. If oil prices continue to languish, it is likely more asset-heavy owners will look to alternative financing arrangements in order to meet their obligations and to restructure their balance sheets throughout 2016.
Valuation gap to reduce as oil prices stabilize
A common theme in 2015 has been deals failing to complete at the 11th hour as valuation gaps emerge between buyers and sellers. These gaps are due to providers of finance focusing more heavily on detailed diligence and struggling to get comfortable with issues that in a different oil price regime may have been tolerable.
This gap is expected to narrow in 2016 as the oil price is forecasted to stay lower for longer, which could potentially signal an uptick in M&A as sellers with lofty price expectations realign and buyers become less opportunistic and more strategic in their view. In addition, an increase in varying deal structures is anticipated in the near term as parties agree to more share deals, which should help reconcile the valuation gap.
Joint ventures and strategic alliances
Large industry players have often used joint venture transactions or strategic partnerships as forerunners to full acquisitions or mergers; for example, the 2012 OneSubsea JV between Schlumberger and Cameron preceded the announced merger of these two parties in 2015. While a joint venture does not have to be permanent, it offers companies the benefits of maintaining their independence and identities while offsetting weaknesses with another company’s strengths, allowing them to experience the benefits a full merger may bring.
For many companies, strategic partnerships and joint ventures may be the preferred way to mutually benefit from corporate combinations rather than full-blown M&A.
Vertical integration to continue
With oil prices now at lower levels, there is increased focus on technology and greater integration of the supply chain to improve efficiency and deliver increased performance to the E&P industry. 2015 has already witnessed significant vertical integration with the announcement of the merger between Schlumberger and Cameron.
Vertical integration is also prevalent in the equipment manufacturing segment. In recent years, Tier 2 and 3 manufacturers have entered the market and competed more heavily with the traditional Tier 1 companies by offering increased service offerings and shorter lead times. These companies are now struggling, and Tier 1 players are expected to further consolidate the bottom end of the market in the coming years.
In addition, as equipment manufacturers increasingly manufacture products in low-cost regions such as China, India and the Middle East, there is also an opportunity for vertical integration through the acquisition of suppliers in order to recover this margin and protect the supply of key products.
As the industry responds to the challenge presented by lower oil prices, further vertical integration in the sector is likely as companies integrate their product and service offering for the benefits of the E&P industry.
Increased interest in the sector from financial and industrial players
The sector is attracting renewed interest from a wide range of financial players, not only distressed funds as discussed earlier but also private equity firms, family offices and infrastructure funds that have been increasingly active in the sector. The market should also present many bolt-on opportunities for funds owning existing investments in the sector and with capital to invest. We expect this to continue in 2016 as the sector downturn leaves opportunities for investors to expand their product offering and to diversify their activities in the oil and gas industry.
Mega mergers and follow-on M&A activity
Consolidation has always been a theme of the sector with a fragmented tail of smaller service companies being regularly merged and acquired by competitors, customers and consolidators. As large oil and gas companies reinvent themselves, become more completive and consolidate, OFS players will need to transact in order to adapt to the continuing transformation in their customer base.
At the top end of the industry, consolidation started in 2014 with several megadeals, including Halliburton acquiring Baker Hughes and Schlumberger acquiring Cameron, reducing the “Big Four” group to the “Big Three.” Mega mergers will continue with significant follow-on activity as merged companies are forced to sell businesses for regulatory reasons (as highlighted with the divestment program as a result of the Halliburton and Baker Hughes merger).


Stay up to date with M&A news!
Subscribe to our newsletter