

By Jens Kengelbach, Alexander Roos, Georg Keienburg – BCG (The Boston Consulting Group)
EXECUTIVE SUMMARY
If one had to choose a single word to describe the M&A market in 2013, it would be disappointing, and indeed many market participants have used this very term. But the exasperated dealmakers have had little time to cry in their beer—they’ve been too busy. The M&A market took off like a rocket in 2014, fueled by the return of the megadeal (transactions with a value of more than $10 billion), which has been in hibernation for the last several years. The momentum of the first quarter carried into the second, setting up 2014 as a potential bellwether for the market’s longer-term evolution.
Megadeals capture the headlines, adding confidence to the market. At the same time, there is another, less publicized but no less significant, trend developing—one that should attract even greater interest in the boardroom. As we first noted two years ago, our research shows a continuing rise in divestitures as a powerful strategy for both unlocking value in today’s markets and improving performance by focusing on core operations. (See Plant and Prune: How M&A Can Grow Portfolio Value, BCG report, September 2012.) In 2013, divestitures represented almost half the total M&A market. Not all divestitures are created equal or produce equivalent results, however. This year’s M&A report—the tenth in our series highlighting major trends and their implications for companies—examines in depth the role of an active divestiture strategy in companies’ ongoing search for value.
After a disappointing 2013, the M&A market entered 2014 with a strong tailwind, including the announcement of roughly as many megadeals in the first six months as in the two previous years combined.
• Factors fueling the resurgence include continued low interest rates, ample capital (both debt and equity), a less uncertain economic outlook, and high levels of M&A interest and financial capability on the part of both corporations and private-equity firms.
• Megadeals accounted for more than 35 percent of total first-half 2014 deal value, including five deals worth more than $43 billion each. These types of transactions not only boost the statistics, they also transform the confidence level of the entire market.
• Continuing a trend begun a few years ago, corporate divestitures are taking a growing share of the overall M&A market.
Numerous factors point to a continued resurgence in deal activity.
• Corporate cash reserves have been increasing since the financial crisis, and countless companies are in strong financial shape.
• Investors favor a more aggressive approach to M&A by companies.
• Private-equity players have large cash reserves and the imminent need to put their money to work.
• Debt financing is more readily available now than at any time in recent years.
• Current transaction valuations remain well within long-term historical parameters.
Companies have a potent value-creating weapon in their strategic arsenals, and more and more CEOs are using it. Divestitures have been growing in significance as a means of creating value for companies on both sides of M&A transactions.
• In the wake of the financial crisis, the priority was survival. As the global economy regains its equilibrium, CEOs can now assess their portfolios through the lens of opportunity. The question they need to ask is whether one company’s assets could have a higher value for another company. Nowadays, the answer is often yes.
• Empirical evidence demonstrates that capital markets reward companies that divest, especially if they are highly leveraged. These companies are also able to improve the performance of their remaining operations and significantly increase value.
• As a result, today’s investors are highly receptive to the idea of divesting. Almost 80 percent believe that companies should pursue divestitures more aggressively.
Three motives lie at the heart of most divestiture decisions: focusing on the core business, generating cash, and improving operating performance. Regardless of motive, divesting companies of-ten achieve higher valuations from an improved focus on core activities.
• Capital and management time are scarce resources, and managing a portfolio of different businesses is difficult. Moreover, the market rewards simplicity of focus.
• Cash proceeds from asset sales or IPOs are often used to fund acquisitions or reduce debt. Cash can also be returned directly to shareholders.
• Our research shows that EBITDA margins increase by more than 1 percentage point between the announcement of a divestiture and the end of the company’s fiscal year.
• Capital markets reward divesting companies with increased valuation multiples on top of their already improved operating performance.
Getting the most value for an asset or a business depends on choosing the right exit strategy. This is more complicated than might first appear as multiple factors come into play.
• Companies have three basic ways to shed unwanted businesses or assets: a trade sale to another buyer; a spin-off to the company’s shareholders; and a carve-out, in which the parent company sells a partial interest to the public while retaining ownership.
• Investors reward spin-offs most highly of the three divestiture options, but spin-offs are not an automatic answer.
• Three major parameters play critical roles in the divestiture decision-making process and combine to determine the optimal divestiture path: the situation of the parent company (including financial strength, profitability, and strategy); the asset’s own attributes (its core industry, quality, and innovativeness); and the market environment at the time (volatility, valuation levels, and point in the cycle).
• Because market conditions can change quickly, it often makes sense for companies to keep their options open by pursuing multiple tracks simultaneously.
2013: HOPES UNREALIZED
2014: HOPES HEIGHTENED
Is the long post-2008 M&A hangover finally coming to an end? Positive signs abound, for a change, starting with strong market activity. The Boston Consulting Group’s tenth annual assessment of crucial M&A trends, based on BCG’s global M&A database of almost 40,000 transactions since 1990, shows that following an anemic 2011 and a slow 2012, the M&A market stabilized in 2013, albeit at disappointing levels. It entered 2014 with a strong tailwind, including the announcement of roughly as many megadeals in the first six months as in the two previous years combined.
Multiple factors are fueling the resurgence. Continued low interest rates, the ample availability of capital, a less uncertain economic outlook, and high levels of M&A interest and financial capability on the part of both corporations and private-equity firms all bode well for the future. In addition, continuing a trend begun a few years ago, corporate divestitures are taking a growing share of the overall M&A market.
After furrowing a deep trough in the years following 2008, the M&A market has at last recovered to the levels of 2005 and 2006. That said, most market participants saw 2013 as a disappointment. Overall deal volume declined by 6 percent and total deal value fell by 10 percent from 2012—despite credit remaining cheap, corporate profits continuing to rise, and generally strong performance by global equity markets. (See Exhibit 1.)
Multiple culprits can be identified. Most significantly, the much-awaited economic recovery failed to materialize, and neither employment levels nor consumer confidence improved as expected. GDP growth disappointed just about everywhere, especially in Europe, and many companies also held back from pursuing big or aggressive transactions owing to the continuing economic uncertainty. Deal volume and value fell in the financial-services and metals-and-mining sectors after heightened activity in the preceding years. Activity in Japan and a number of emerging markets, especially Brazil, Russia, and India, also declined. As is the case every year, several hundred transactions were announced but failed to reach consummation. The number of uncompleted deals was roughly equal in 2013 and 2012, but the total value of the withdrawn deals in 2013 was bigger as several large transactions were canceled, including the acquisition of 70 percent of Koninklijke KPN by América Móvil for $10 billion and the sale of BlackBerry to Fair-fax Financial Holdings for $5 billion.
How quickly sentiments—and outlook—can change, however. The total value of first-half 2014 transactions jumped 62 percent over the value of transactions in the first six months of 2013. Megadeals accounted for more than 35 percent of total first-half 2014 deal value, including five deals worth more than $43 billion each—a level of activity not witnessed since before the financial crisis. These types of transactions not only boost the statistics, they also transform the confidence level of the market. Dealmakers who have been sitting on the sidelines, uncertain about financing, investor reaction, regulatory approvals, or other factors, see industry-altering transactions in the works and start to believe their deals can get done. Indeed, the hot pace continued into the second quarter, with AT&T’s acquisition of Directv, Apple’s acquisition of Beats Electronics, the $50 billion merger of cement makers Lafarge and Holcim, and the heated competition to acquire Alstom’s energy-equipment assets, which General Electric appears poised to win.
The overall economic outlook is the most positive in years, with U.S. GDP growth projected to approach 3 percent as we move into 2015, and growth expected to return to Europe, albeit slowly. Equity markets are holding up thus far, through the end of the second quarter. As always, there are risks that political or international events—in the Middle East and Ukraine, for example—could have a negative impact on the economy and thus on deal activity.

North America Leads the Comeback—Fueled by High Tech
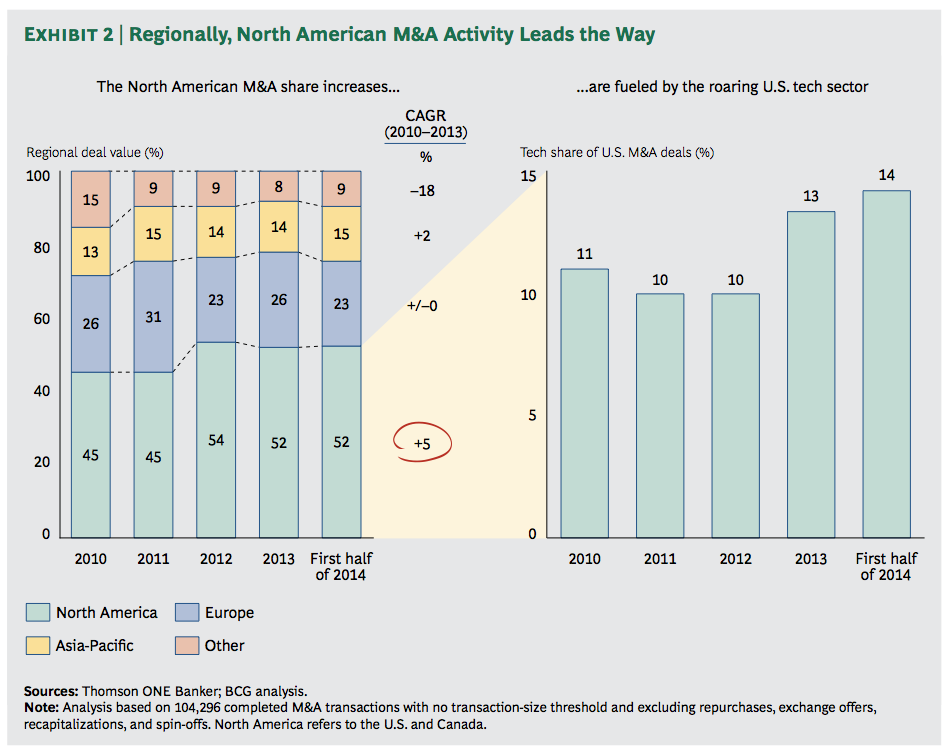
The global M&A market is led by North America, whose share has been on the rise and reached 52 percent in the first half of 2014—up from 45 percent in 2010. While M&A activity stagnated or even decreased in most regions of the world, total deal value in the U.S. and Canada rose more than 5 percent per year over this period. The roaring tech sector has been a driving force, since the most prominent players in high-tech M&A are based in the U.S. (See Exhibit 2.)
Rather than following an overarching industry trend, many tech deals are rooted in individual company needs—Apple’s acquisition of Beats to rejuvenate its music business, for example. With the acquisitions of Oculus VR and Nest Labs, respectively, Facebook and Google are looking to stay at the cutting edge of technological advances with strong consumer applications, as innovations such as augmented reality and machine-to-machine communications begin to gain market traction. Priceline.com’s purchase of online restaurant-reservation service OpenTable (for $2.7 billion) promises the potential of cross-marketing to different digital consumer segments.
The rapid rise of mobile as the world’s dominant communications technology is spurring M&A activity in several spheres. Facebook’s acquisition of WhatsApp and Verizon’s $130 billion acquisition of Vodafone’s interest in Verizon Wireless show companies expanding, or consolidating control of, their share of mobile users. Microsoft is gaining control over mobile technology with its acquisition of Nokia’s device-and-service business.
Not all the tech activity is in North America. Dozens of deals have been announced involving European countries in late 2013 and the first half of 2014. However, since many of them represent smaller transactions, their overall impact on M&A markets has been less visible.
Outside the tech sector, so-called inversion deals are becoming an increasingly significant factor, particularly in the health care industry. U.S. companies are seeking acquisitions in Europe that make strategic sense and enable the acquirer to move its corporate domicile to Europe, where the company will benefit from more favorable tax treatment. In July, the Wall Street Journal estimated that almost a dozen such deals were pending, with a total value exceeding $100 billion.
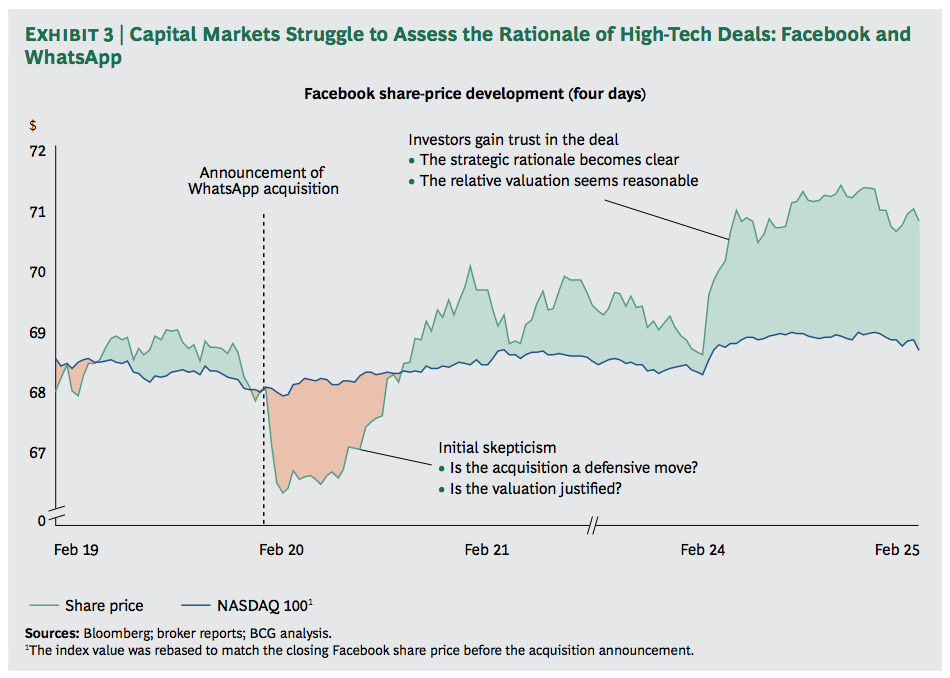
Despite a rising number of transactions, capital markets continue to have difficulty deciphering the new business models of innovative tech companies and coming to grips with the seemingly outsize valuations that acquirers place on their targets, which often have limited track records and little or no earnings history. Memories of the bursting dot-com bubble in 2000 are still fairly fresh.
The February 2014 announcement of Facebook’s plan to acquire WhatsApp, a five-year-old cross-platform instant-messaging service with 55 employees, for $19 billion in cash and stock is a case in point—especially since WhatsApp had only recently completed a round of venture-capital funding that valued the company at $1.5 billion. Immediately after Facebook announced the acquisition, its share price dropped 5 percent because of skepticism over the deal and the company’s rationale. It took several days—and a concerted investor-outreach effort—for investors to understand the basis for the deal, both strategic and financial. The market ultimately awarded Facebook a cumulative abnormal return (CAR) of 1.1 percent. (CAR assesses a deal’s impact by measuring the total abnormal change in market value over a seven-day window centered on the transaction announcement date.) The market came to recognize that with WhatsApp’s more than 450 million mobile users and rapid user growth, Facebook was acquiring a potentially formidable competitor and strengthening its own mobile position at the same time. Perhaps most significantly, the price it was paying for WhatsApp was equal to $42 per mobile user—several times less than the value the market was placing on each mobile user of Facebook itself ($141) or its fellow social network, Twitter ($124). (See Exhibit 3.)
Will the Pace Pick Up?
Multiple factors—principal among them large cash reserves, bullish investors, and buoyant debt markets—point to a continued resurgence in deal activity.
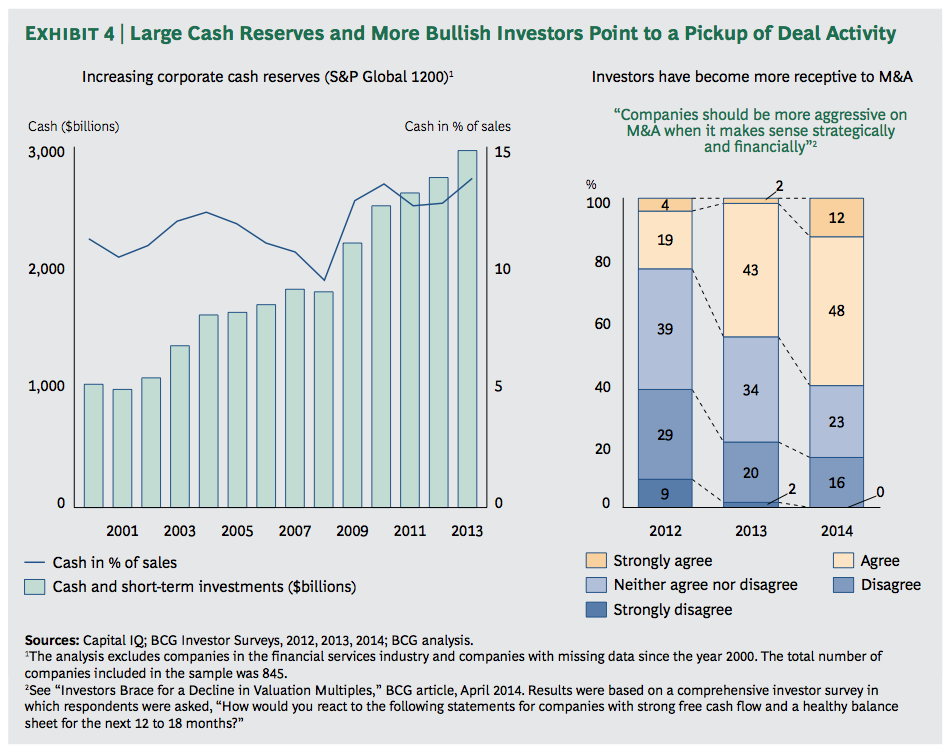
Corporate cash reserves have been increasing since the financial crisis. Countless companies have used the downturn to strengthen their balance sheets and improve their performance, giving them a much-enhanced means of financing acquisitions. Corporate cash levels are at an all-time high—three times their level in 2000. Shareholders become restless with so much money sitting idly on the sidelines, and they will eventually demand that companies either put the money to work or distribute it to their owners through share buybacks or dividends, especially as the uncertainty in capital markets recedes. As economic conditions improve, investors are becoming far more receptive to companies making acquisitions so long as the deals are consistent with their strategy and, of course, the price is seen as reasonable. In BCG’s 2014 investor survey, the percentage of respondents favoring a more aggressive approach to M&A by companies almost tripled, from 23 percent to 60 percent, between 2012 and 2014. (See Exhibit 4.)
While activity among private-equity players has increased only slightly so far—the number of transactions rose 22 percent between 2012 and 2013, but the total value actually declined 3 percent—we do not see these firms remaining quiet for long. At a total of $431 billion, private-equity cash reserves are approaching their levels in 2008 and 2009, and these firms have their own investors to answer to. More- over, debt financing is more readily available now than at any time in recent years. Leverage levels have returned to those of 2007 and 2008. (See Exhibit 5.) The average deal in 2013 included only 35 percent equity. “Covenant lite” loan activity in 2013 also smashed all records. The incidence of these loans, which generally do not involve any maintenance covenants, indicates growing investor appetite in the leveraged-loan market, making borrowing even more attractive for private-equity deals. We expect private-equity firms to become much more active in all kinds of transactions, with the exception of the largest megadeals, which are simply beyond their reach, if not their comfort zone.
Last but hardly far from least, current transaction valuations are still within long-term historical parameters. Valuation levels (as measured by the ratio of median acquisition enterprise value to EBITDA—EV/EBITDA) have been generally (if unevenly) rising since 2008, and they surpassed the historical average of 11.9 in the first half of 2014. Deal premiums (the amount by which the offer price exceeds the target company’s closing stock price one week before the original announcement date) approximated their historical average of 35.4 percent in 2013. One could thus argue that targets are not yet overvalued from a historical perspective—one more reason why deal activity among both corporate and private-equity players should continue to increase.
That said, it should also be noted that some industries are distinctly more active than others. Our analysis of deal volume (measured by transaction value) shows clear sector differences when long-term historical activity (from 1990 through 2010) is compared with deals done since 2011.
Energy, for example, saw a 4-percentage-point uptick in the current period, owing primarily to portfolio restructurings and consolidation, as well as to an increased focus on renewable energies following the Fukushima accident. Higher levels of activity in the health care sector (up 3 percentage points) are substantially the result of pharmaceutical companies acquiring new research pipelines as their own R&D programs produce fewer blockbusters and the patents covering older top-selling drugs expire. Changes in health care regulations in the U.S. and a difficult environment in Europe are also fueling consolidation in the sector. Companies in the industrial sector have been optimizing their portfolios as economies stabilize and return to growth. And, of course, high tech is highly active.
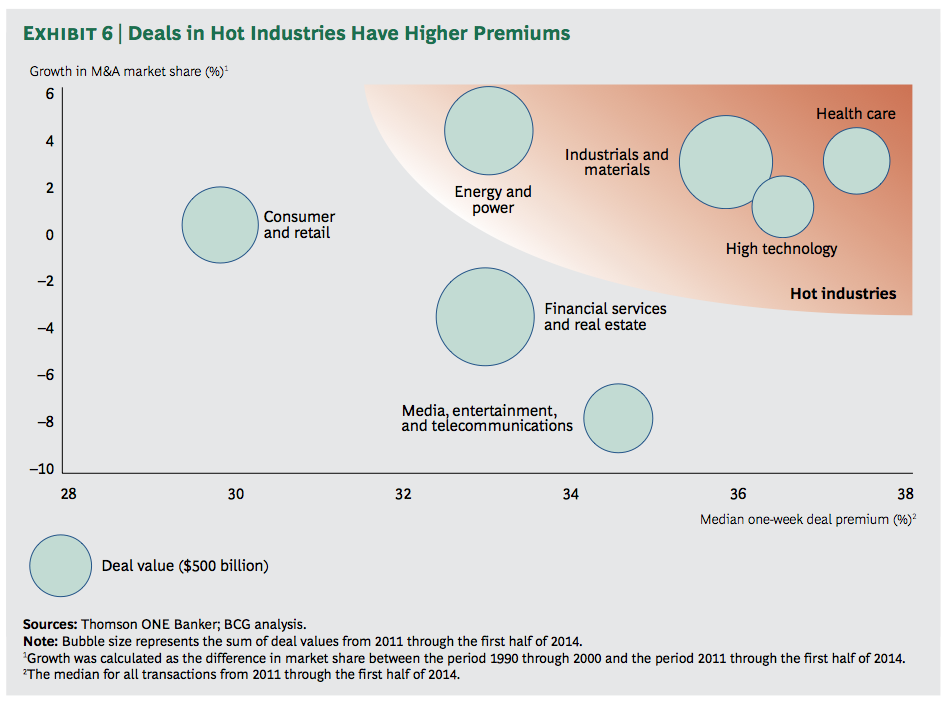
There is a clear impact of M&A intensity in “hot” industries: target companies are able to demand higher premiums from potential buyers. (See Exhibit 6.) Companies acquired in high tech and health care, for example, received average premiums of 36.5 percent and 37.3 percent, respectively, compared with premiums of only 29.9 percent in consumer and retail and 33.0 percent in financial services and real estate.
Timing is not everything in M&A, but it almost always is a critical factor and certainly an important consideration for both buyers and sellers during upswings in their industries.

DIVESTITURES DRIVE A RESURGENCE IN DEALS
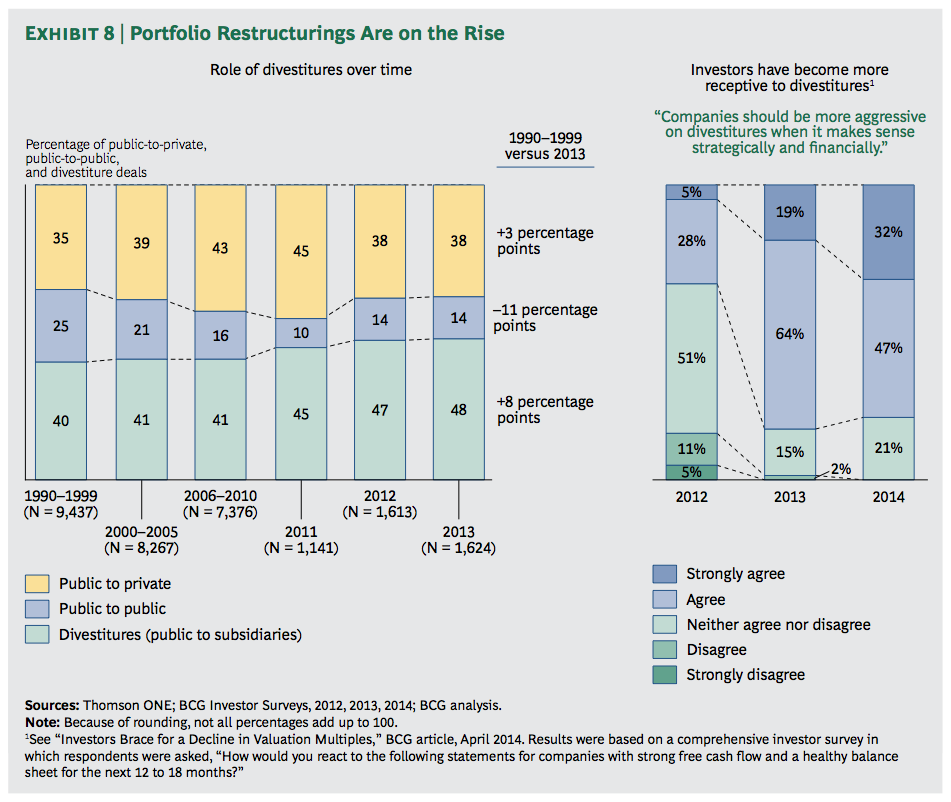
Big acquisitions and mergers grab the headlines, but companies often have an equally potent value-creating weapon in their strategic arsenals, and, as we observed two years ago, more and more CEOs are starting to use it. Divestitures have been growing in significance as a means of creating value for companies on both sides of M&A transactions. As a result, they have also been increasing in importance within the overall M&A market. (See Plant and Prune: How M&A Can Grow Portfolio Value, BCG report, September 2012.) In 2013, divestitures represented 48 percent of all transactions, compared with 45 percent in 2011 and only 40 percent from 1990 through 1999.
Most executives are not naturally inclined toward breaking things up; they would rather grow and create value through building than through dividing. But we live in a time when most business units can conceivably be assets in play. The truly strategic question any company or CEO needs to ask is whether one company’s assets could have a higher value for another company. (See Looking Anew at the Value of Divesting, BCG article, August 2012.)
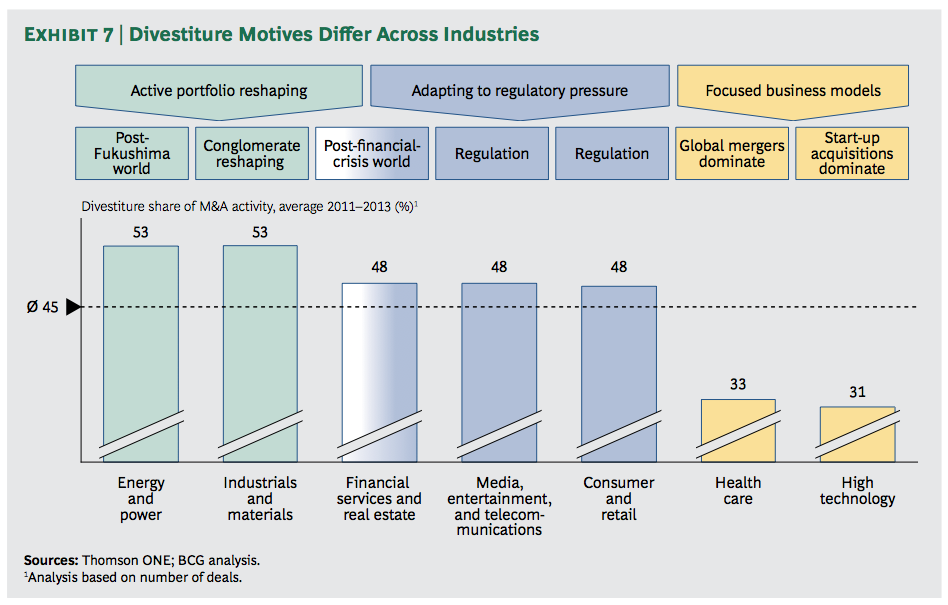
For all kinds of companies, the answer increasingly is yes. Companies in energy, industrials and materials, financial services and real estate, media and telecommunications, and consumer and retail have been particularly active divestors since 2011, especially when compared with industries such as health care and high tech, where business dynamics cause mergers and acquisitions to dominate activity. Sixteen of the 50 biggest divestitures in 2013 were made by energy and financial services companies.
The factors driving divestitures vary by industry. Conglomerates have actively reshaped their portfolios in a time of economic uncertainty and volatility. Energy companies have shed assets as they adjust to a post-Fukushima world, react to regulatory shifts (especially in Europe), and position themselves to pursue new opportunities in shale gas and renewable energies. Regulatory and financial pressures have pushed financial and real estate companies to unload assets and adjust their mix of businesses for a more highly regulated and less risk-tolerant world. (See Exhibit 7.) Competition authorities often demand divestitures—especially in customer-focused industries, such as high technology, media, telecommunications, and retail—as a prerequisite for approval of large mergers.
We observed in 2012 that divestitures were likely to remain a popular strategic tool for some time to come. We continue to believe that this is the case. As the global economy regains its equilibrium, companies can move from fighting off the nearest crocodile to the
boat and plan for the longer term. Portfolios that were reshaped out of necessity in the wake of the financial crisis can now be assessed through the lens of opportunity. The timing for shedding one line of business in favor of another, or for generating cash to pay down debt or invest in core operations, is propitious. Empirical evidence demonstrates that capital markets reward companies that divest, especially if they are highly leveraged, and that divesting companies tend to improve the performance of their remaining operations. As a result, investors are highly receptive to the idea of divesting. While more than half of the investors surveyed in 2012 were ambivalent as to whether companies should pursue divestitures more aggressively (assuming solid strategic and financial rationales), today almost 80 percent believe that they should. (See Exhibit 8.)
But—and this is an important but—to reap the full benefits, companies need to choose and execute the right divestiture path on the basis of their individual situation, the attributes of the assets being shed, and the market environment at the time of the transaction. In the balance of this report, we explore both the rationales for divestitures and the various means of executing them successfully.
Lots of Reasons to Let Go
Companies divest assets and operations to adapt to an evolving business environment. Specific reasons change over time with shifts in the economy, individual industry dynamics, regulatory policy, and other factors, but three of the most consistent are the following:
• Focusing on the core business
• Generating cash
• Improving operating performance
Focusing on the Core Business. Capital and management time are scarce resources; CEOs have to decide where to put their attention and their money. Even companies operating in a single sector or category can find themselves managing multiple brands or lines of business. The question needs to be asked periodically, especially when economic, business, or regulatory conditions shift: is an asset generating sufficient value or could it do better with somebody else (including as a stand-alone company), and could the current parent deploy time and cash better in its other operations?
The capital markets’ answer to that question is often a clear yes, which can easily be seen in prevailing “conglomerate discounts” that markets assign to diversified companies. BCG research shows that the long-term average discount is 13.9 percent. (See Invest Wisely, Divest Strategically: Tapping the Power of Diversity to Raise Valuations, BCG Focus, April 2014.)
It’s hardly surprising that diversified companies are also active divestors. In the U.S., General Electric has shed 57 businesses since 1990, Invensys of the UK has unloaded 30, and Germany’s Siemens, 24.1 The list of top divesting companies since 1990 includes three banks (Deutsche Bank, JPMorgan Chase, and Citigroup) that needed to navigate the financial crisis and reorient themselves for a post-crisis environment, and two consumer-goods companies, Philips and Unilever, for which continual portfolio reshaping is not unusual.
Divesting does not necessarily mean shrinking, however. While divesting companies reduce complexity and improve capital allocation, they also accumulate war chests for investing in existing operations and funding acquisitions.
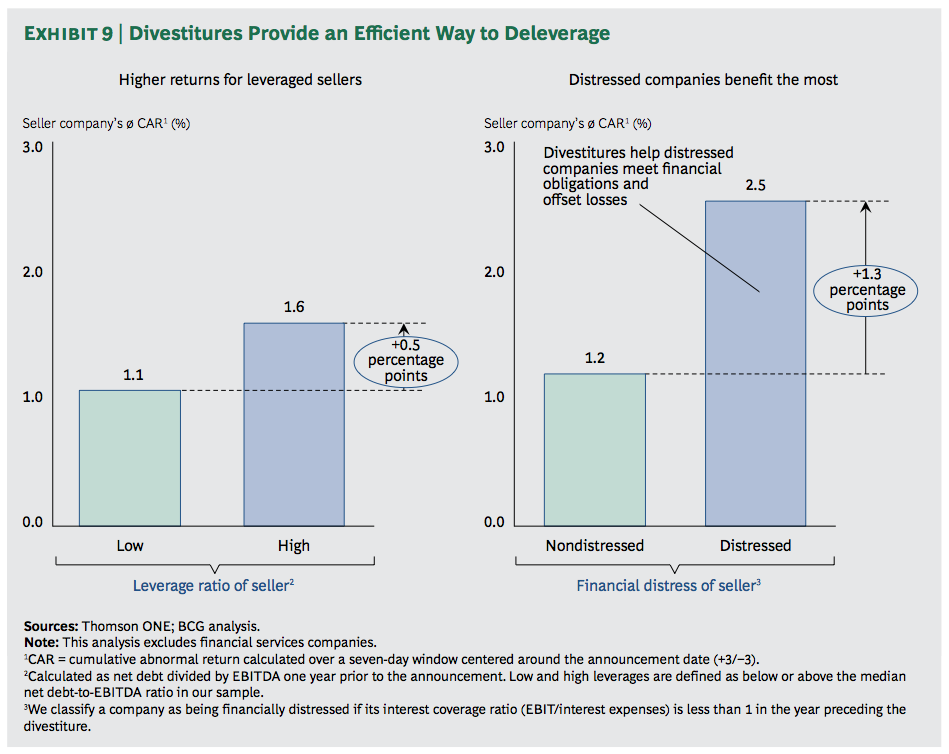
Generating Cash. Cash proceeds from asset sales are often used to fund acquisitions or reduce debt, especially when companies are overextended or economies slow. Capital markets are sensitive to how leveraged companies manage their balance sheets. According to our measure of CAR, capital markets reward asset sales by leveraged companies, giving them a CAR that is 0.5 percentage points higher than for sellers with low leverage. The higher a company’s debt levels, the greater the reward: CARs for distressed companies are 1.3 percentage points higher than for nondistressed companies. (See Exhibit 9.)
Rather than increasing operating cash resources, companies can opt to enhance shareholder value by selling an asset and returning the proceeds directly to shareholders through a share buyback program, a one-time special dividend, or a regular dividend increase. Such approaches are often used in mature low-growth industries where opportunities for reinvestment are few unless management embarks on a diversification program.
Improving Operating Performance. Divesting companies often achieve higher profitability from an improved focus on core activities. Many companies get an added boost because the business being sold or spun off was a corporate orphan, receiving inadequate investment and attention, and consequently producing poor performance. Its sale lifts overall profitability. Increased management focus on the remaining assets, better capital allocation, and the availability of more funds to invest in the remaining business result in improved growth and profitability for the portfolio.
Our analysis of 6,642 divesting companies since 1990 shows that EBITDA margins increase by more than 1 percentage point between the announcement of a divestiture and the end of the company’s fiscal year. For our average seller, which has approximately $14 billion in annual sales, this translates into an increase of $170 million in EBITDA. The large size of our average seller reflects the fact that big international companies tend to be the most active divestors. (See Exhibit 10.)
While the effect is significant for the average company in our sample, it is even more pronounced for distressed sellers. These companies improve their EBITDA margins by 14 percentage points on average after a divestiture, moving from negative EBITDA to better than breakeven.

Reaping the Rewards
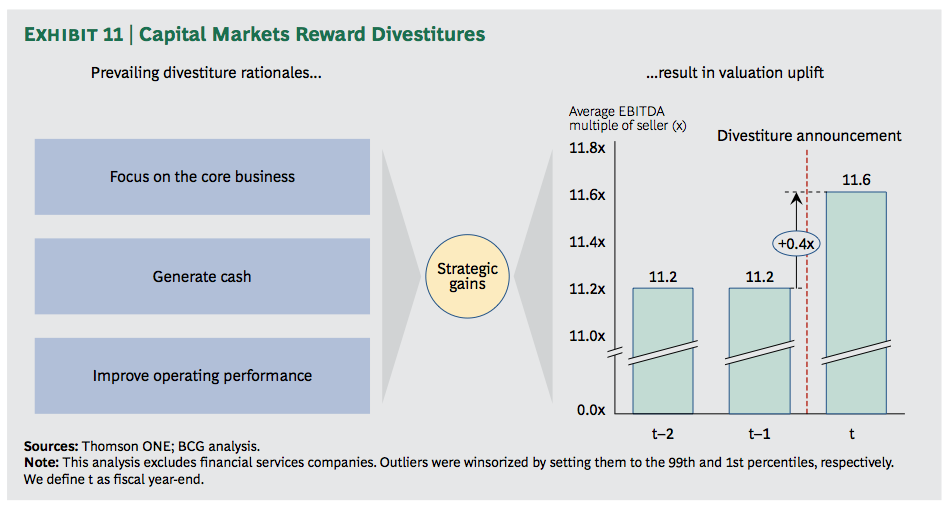
The rewards that capital markets give divesting companies are clearly visible in their increased valuation multiples. Every circumstance is different, of course, but our research shows that investors perceive newly streamlined and more focused organizations to be of higher value. They reward divesting companies by expanding their EBITDA multiple by an average of 0.4 times—which, as we have seen, comes on top of an already improved operating margin. (See Exhibit 11.)
Investors anticipate these increases by bidding up divesting companies’ share prices immediately following an announcement. The stock price of the average seller in our sample increased by 1.4 percent in the days following the divestiture announcement. But this average belies a substantial spread. Investors reward those companies whose strategies they appreciate and that execute effectively; they punish those whose strategies and execution they disapprove of. More than half of all divestitures create value: our research shows that 55 percent resulted in an average CAR increase of 6.6 percent for the parent company. The other 45 percent, however, led to an average drop in CAR of 4.8 percent.
Divestitures not only bring internal improvements for companies; they also reward investors. The biggest benefits accrue to those who get both the strategy and the execution right. Those who choose the wrong exit route leave money on the table—or, worse, actually destroy value as shareholders punish their mistakes.
(Note 1. The number of divestitures cited refers to major divestitures only, which we have defined as those involving a 75 percent ownership change, a deal with a value of more than $25 million, and a publicly listed acquiring company.)
MAXIMIZING VALUE WITH THE RIGHT EXIT ROUTE
Deciding to divest is one decision. Determining how to unlock the full value of the asset being shed is another, often more complicated, step. Maximizing value depends substantially on choosing the right exit route. This is more involved than it might first appear. Multiple factors come into play, and the straightforward option—such as the instinct to grab the cash—is not always the best approach.
Consider Your Options Carefully
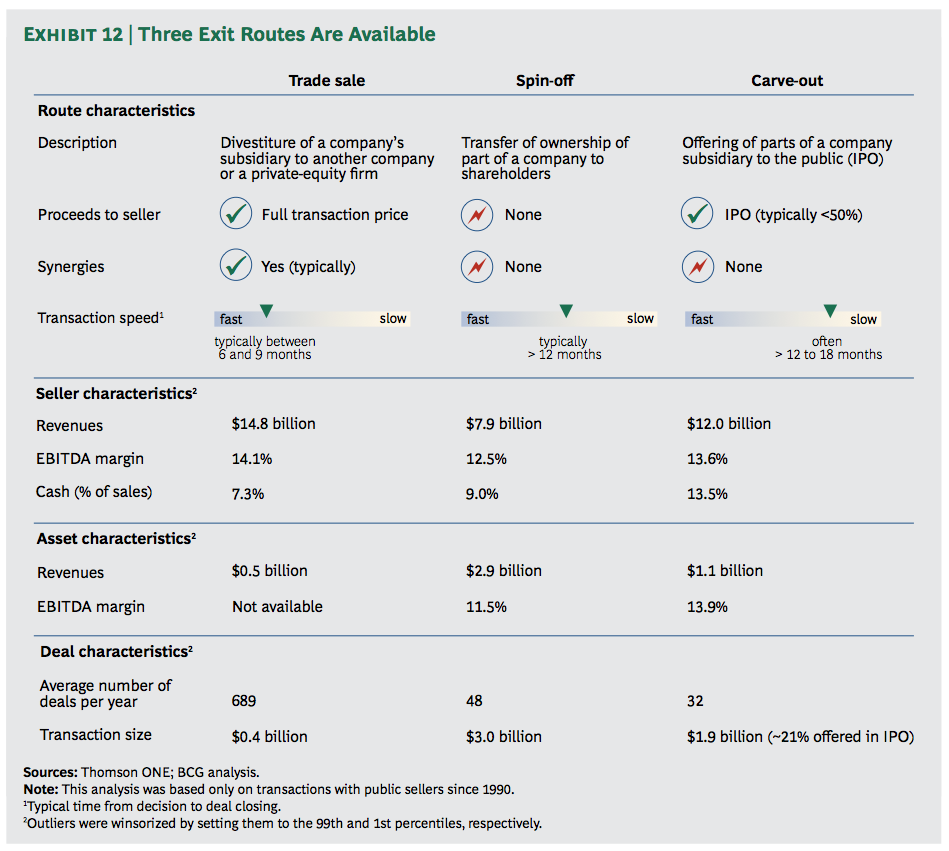
Companies have three basic ways to divest unwanted businesses or assets: a straight trade sale to another buyer; a spin-off to the company’s shareholders; and a carve-out, in which the parent company sells a partial interest to the public while retaining ownership—often a controlling interest. (See Exhibit 12.) Each option offers its advantages, and choosing the right route depends, as we shall see, on a combination of factors particular to the parent, the business being sold, and the market at the time of the transaction. (See “Three Routes to Value.”)
Trade Sales: Quick, Easy, and Low Risk. In its simplest form, a trade sale is a straightforward cash sale to another company or a private-equity buyer. Trade sales generate cash, which the seller can use to invest in its remaining businesses, make acquisitions, pay down debt, or return to shareholders. The market’s reaction to a trade sale often depends, at least in part, on the seller’s intentions for the proceeds. Trade sales are the only exit vehicle in which the seller has the potential to indirectly participate in the new owner’s synergies with the acquired business. Our research indicates that sellers collect approximately 30 percent of the average capitalized value of expected synergies, although the actual share in any single transaction can vary widely. (See Divide and Conquer: How Successful M&A Deals Split the Synergies, BCG Focus, March 2013.)
Since they generate the most cash for the asset being sold, trade sales are the preferred exit strategy for companies looking to deleverage—a fact that the markets appreciate. They are the preferred choice in times of high volatility, when IPOs are tricky to execute. Many sellers also choose trade sales in times of high capital-market valuations, seizing the opportunity to monetize the value that others see in the asset, especially when it is higher than the current owner’s view. Because they are the simplest and quickest form of transaction to complete (and often less risky as well), trade sales are, not surprisingly, also the most common type of deal, far outnumbering the other options.
Spin-offs: Direct Distribution to Shareholders. Spin-offs generally result from a purely strategic decision to refocus the portfolio and exit a line of businesses. They do not generate cash, but they do produce value—often considerable value—for shareholders, who become the direct owners of the divested business through a distribution of shares. Spin-offs are also usually tax advantaged, and they have high completion security because they do not depend on market conditions.
Investors reward spin-offs because they receive value in the form of new shares and they expect the value of their shares in the parent company to increase as management heightens its focus on its remaining operations. There are exceptions, however. In the case of a highly leveraged parent, for instance, the wisdom of a spin-off that generates no cash proceeds will almost certainly raise concerns.
Spin-offs and carve-outs result in newly public companies with their own administrative overhead requirements—one reason they are pursued more often for bigger businesses. As shown in Exhibit 12, average revenues for businesses in our study that were spun off were roughly $2.9 billion—six times higher than the average size of the trade sale sample.
Carve-outs: Playing It Both Ways. Under the right circumstances, companies may be able to have their cake and eat it too by using a carve-out strategy to divest, at least partially, a noncore business or an asset that management believes is undervalued. Carve-outs generally involve an IPO of some portion of the business, often about 20 percent. The company retains the balance, which it can keep for the long term or dispose of in a secondary offering at a future date.
Carve-outs generate cash for deleveraging or reinvestment. They shine the spotlight of public-company independence and market valuation on the divested asset. They also allow the parent to participate in the future growth of the divested asset—an ability the market appreciates in cases of innovative assets or assets in sectors bound for a cyclical upswing.
Carve-outs are the most complex of the three exit strategies and they require a certain capital-market window of opportunity. They can take the most time to complete and they are the most rarely used. They are nonetheless often highly worthy of consideration and can be approached as part of a two- or even three-option strategy along the other exit routes.
THREE ROUTES TO VALUE
Trade sale, spin-off, or carve-out? The decision to divest is only the first step in a complex process. Deciding how (and when) to shed a noncore asset is a multifaceted challenge with billions of dollars of value often hanging in the balance. The route a company chooses to take depends on its own situation and strategic and financial goals, the attributes of the asset to be divested, and prevailing market conditions—which of course are subject to change at a moment’s notice.
In 2012, for example, Procter & Gamble abandoned the transfer of its Pringles snack-food business to Diamond Foods, in a complex stock-swap transaction that combined elements of a trade sale and a carve-out, in favor of a straight $2.7 billion cash sale to Kellogg. The divestiture of Pringles completed P&G’s exit from the food business so that the company could focus on its core cosmetics and health care operations. At the same time, the acquisition of Pringles transformed Kellogg into the second-largest savory-snacks producer. The market appreciated the strategies of both companies, and they exhibited returns well above that of the S&P 500 around the announcement date of the deal.
Another deal involving a major snack producer—the spin-off of Mondelēz International from Kraft Foods—took a very different path. In 2011, Kraft announced plans to split itself into two businesses, each with very different characteristics, strategies, and outlooks: its North American grocery business, which retained the Kraft name; and Mondelēz, the larger global snack company. When combined under one roof, both businesses were difficult to decipher, their performance was challenging to predict, and they were hard to value. As a standalone entity, each company became much more tightly focused and easier to assess on its individual merits and performance. The deal was complex – it took more than a year to execute; but the spin-off was praised by analysts and rewarded by capital markets. The deal yielded a 2 percent CAR for Kraft following its announcement, and shares of both companies have outperformed the S&P 500.
In 2012, Pfizer announced its intention to offer about 17 percent of Zoetis, the company’s animal-health-product unit, to the public and thus create a new standalone company that would be the world’s largest animal-medicine and vaccine company, with some 300 products and about $4.3 billion in annual sales. As part of its strategy to focus on its core pharmaceutical business, Pfizer had already sold its infant-nutrition unit to Nestlé for $11.9 billion.
Owing to high demand and attractive conditions (a total of 12 IPOs had already raised more than $5 billion in January 2013), Zoetis shares were offered at a price of $26—above the initially planned range of $22 to $25—and rose by 20 percent to close at $31 on their first day of trading on the New York Stock Exchange. The new company’s market value was $15.5 billion—the largest U.S. IPO since Facebook went public in May 2012. The IPO brought Pfizer about $2.2 billion in cash.
In June 2013, Pfizer successfully offered its remaining stake to its own shareholders, in an exchange offer of 0.9898 Zoetis shares for each Pfizer share, thus completing its exit from the animal-health-product business and enhancing value for its shareholders by both giving them the opportunity to own the new company and reducing the number of its own shares outstanding, which increased earnings, EBITDA, and enterprise value per share.
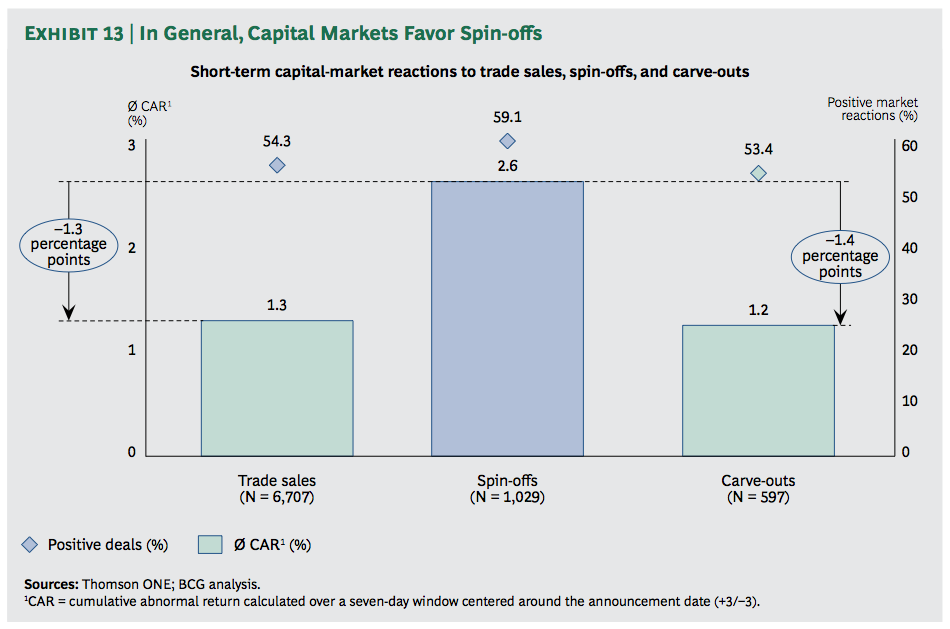
Investors Prefer Spin-offs…
Investors react positively toward all three types of divestitures—they reward companies that actively reshape their business portfolios. More than half of the divestitures in our study resulted in positive CARs for the parent company.
In a somewhat surprising finding, investors reward spin-offs most highly of the three divestiture options, even though they generate no cash for the seller and usually take more time than trade sales to execute. Almost 60 percent of spin-offs since 1990 generated positive CARs for the parent company, compared with approximately 54 percent of trade sales and carve-outs. Moreover, the average CAR for spin-offs was 2.6 percent—double the 1.3 percent and 1.2 percent generated by trade sales and carve-outs, respectively. (See Exhibit 13.)
Our analysis indicates that there are four primary reasons for this spread. First, spin-offs are a purely strategic decision: they have no financing requirements or other capital constraints. They tend to reduce any conglomerate discount assigned to the parent, since shareholders can decide for themselves what to do with the spun-off asset.
Second, there is a tax advantage to spin-offs. While the proceeds from trade sales and carve-outs are subject to corporate taxes, spin-offs usually generate no tax liability for the company, and shareholders are not taxed until they sell the new shares they receive.
Third, spin-offs tend to be larger transactions in terms of both value and share of the parent’s revenue; this type of transaction often has a larger impact on the company’s remaining portfolio of businesses.
Last, the spun-off subsidiary enjoys a higher degree of freedom and thus avoids potential conflicts of interest with the parent company. This allows more independence when the new company is deciding future strategy, and it opens new options, such as merging with other companies.
…But They Ultimately Reward the Right Choice for the Circumstances
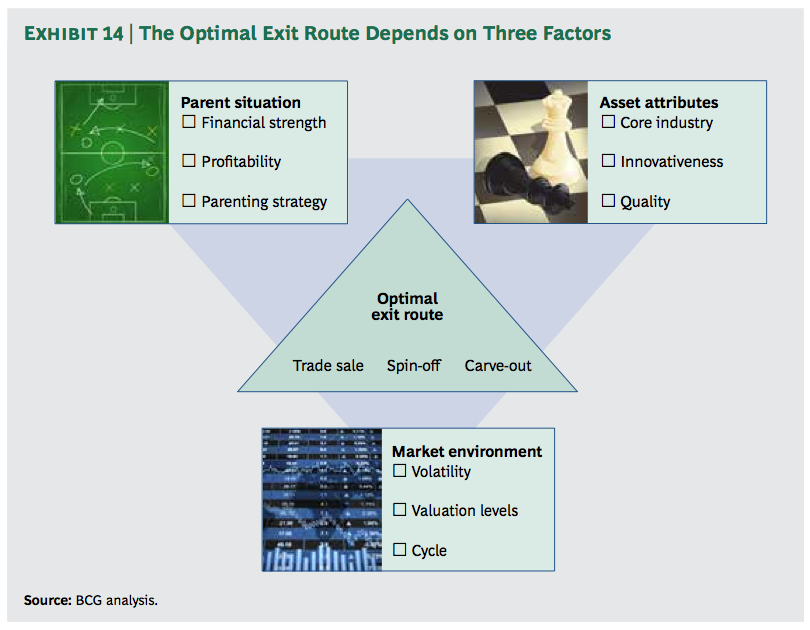
Spin-offs are not an automatic answer, however—far from it. Three factors play critical roles in the divestiture decision-making process and combine to determine the optimal divestiture path. Capital markets may not be omniscient, but they are comprehensive in their ability to take multiple factors into consideration when they assess a major corporate action such as a divestiture. They will aggressively examine the situation of the parent company (including financial strength, profitability, and strategy); the asset’s attributes (its core industry, quality, and innovativeness); and the market environment at the time (volatility, valuation levels, and point in the cycle), which means the parent company should engage in a similar exercise before deciding the optimal exit route. (See Exhibit 14.)
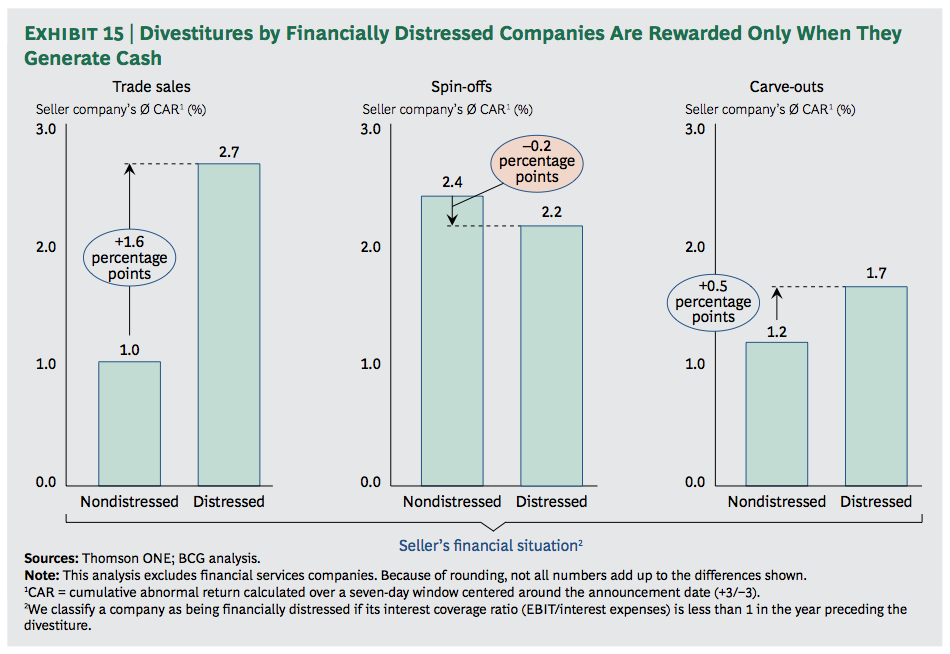
Parent Situation. The most significant consideration for companies thinking about divesting a business is their own financial condition. Companies that are highly leveraged will likely be attracted to a trade sale or a carve-out because they both provide cash for the seller. Our research shows that the market bestows big rewards on trade sales and carve-outs when the seller is financially stretched. Spin-offs by companies in financial distress result in lower CARs as investors punish the parent for choosing the “wrong” course. (See Exhibit 15.)
All three exit routes lead to improved operating performance for the parent—an indication that tighter management focus has a constructive impact once noncore assets are put on the market. The improvement is highest for trade sales. One reason for this could be the availability of new funds to invest in core operations. Another possibility is companies selling lower-quality assets that dragged down earnings.
There are times when a company faces the conundrum of needing to divest a business that under other circumstances it would elect to keep. One example is a high-growth subsidiary that needs more capital than the parent can provide. Or a business that is undervalued by the market because it is overshadowed by the parent’s other, larger operations. Carve-outs provide an attractive exit alternative. The parent puts the subsidiary on its own independent footing, where the market can assess it on its own merits, but the parent also participates in the future growth and earnings of the business.
Carve-outs have a few downsides, however. They are the most complex divestiture option as well as the most difficult for the market to value, precisely because the parent company retains an ownership interest in, and usually control of, the business.
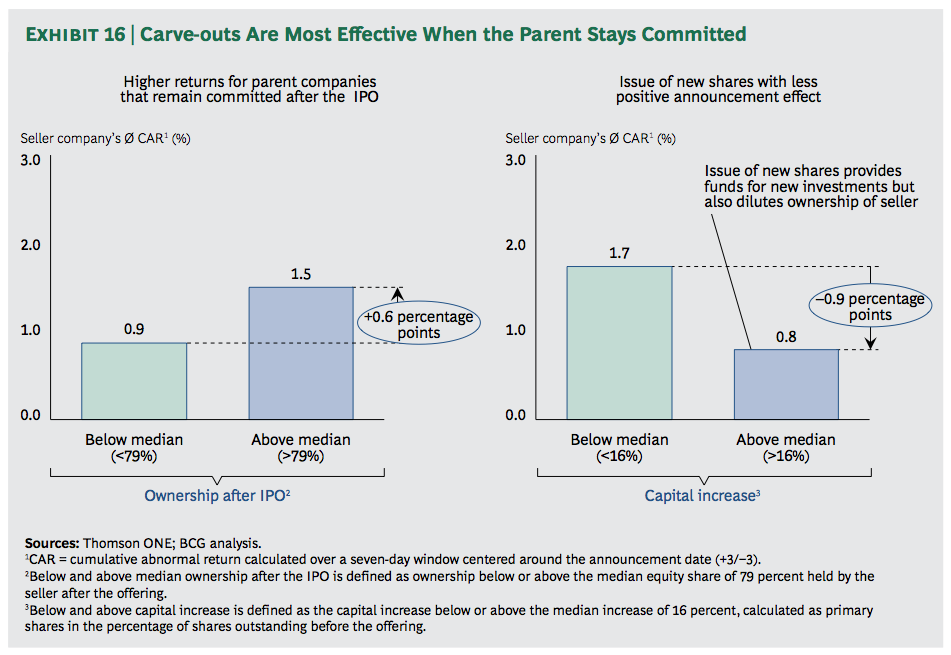
Carve-outs are most effective when the parent is committed long-term to the future of the subsidiary. Markets take a signal from the size of the stake the parent company retains in the carved-out company. Parents retaining a larger ownership (above the median of 79 percent) are seen as demonstrating a strong commitment to the future of the carved-out business, which investors appreciate. These companies received an average CAR of 1.5 percent, compared with a CAR of only 0.9 percent for those parents retaining a stake below the median. (See Exhibit 16.) Some companies use the IPO to raise fresh capital for the carved-out business, but this strategy can backfire. Investors are quick to realize that since the parent now has only a partial interest in the new company, its shareholders receive only a portion of the IPO proceeds. Our research shows that the parent’s CAR is lower for carve-outs in which significant amounts of capital are raised for the new company, compared with parents that pursue partial IPOs purely to generate cash for themselves.
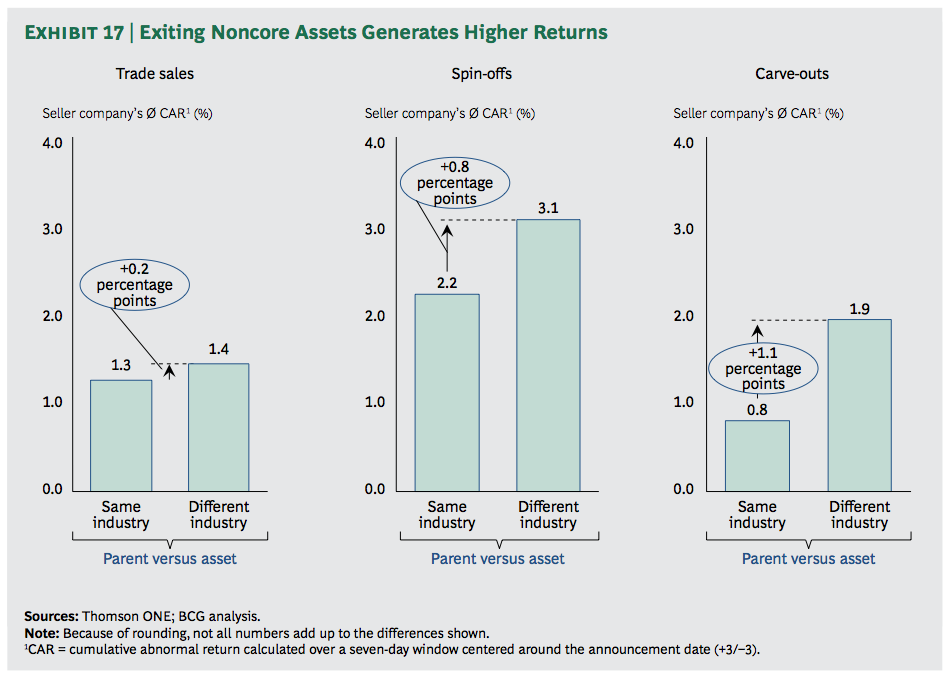
Asset Attributes. Since capital markets value simplicity of focus, they give the biggest rewards to companies that reduce the complexity of their portfolios by, for example, shedding a business that is in an industry different from the parent’s core business. The more diversified a company is to start with, the bigger the conglomerate discount the market is likely to have applied. Such companies can generally anticipate a bigger market reward. As we have seen, investors place a higher value on companies that unload unwanted businesses through spin-offs and carve-outs than through straight trade sales. (See Exhibit 17.)
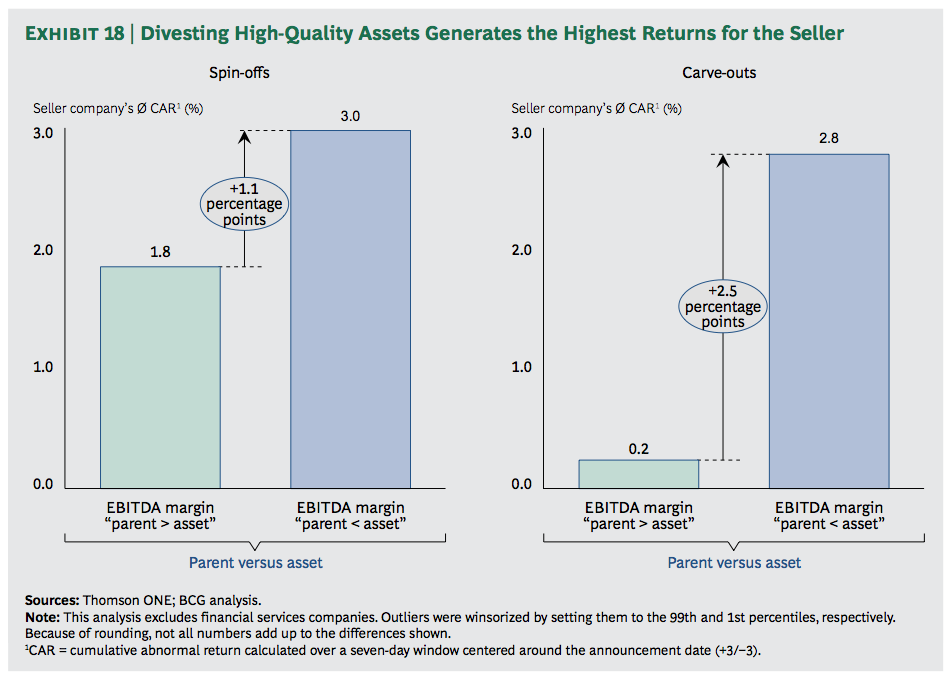
Quite often, high-quality assets get lost in a diversified mix of businesses, especially when they are overshadowed by size. A spin-off or carve-out of a high-profit subsidiary puts the focus on the business as a standalone operation and causes the market to value it on its own merits. CARs are considerably higher for divested businesses that have higher EBITDA margins than their sellers. (See Exhibit 18.) This is especially true for carve-outs, most likely because the carved-out business needs to attract buyers for its shares in a public offering, and healthy margins help to create a convincing equity story.
Investors also distinguish between innovative businesses that require high levels of investment in R&D and those that do not. They value innovation and punish companies that divest innovative businesses through trade sales or spin-offs while rewarding companies that maintain an interest in innovative subsidiaries through carve-outs.
If a parent is unable to provide sufficient funding to a business requiring a high level of investment in R&D, it stands to reason that the business would be better off as a standalone company or under a different owner. To test this hypothesis, we divided the divested companies in our sample into two groups—those with high and low R&D intensity as measured by their percentage of R&D to sales. As expected, we found that capital markets reward only carve-outs of high-R&D subsidiaries. Carve-outs are the only exit vehicles that provide new capital to finance further innovation. The average CAR is actually lower for companies divesting high-R&D assets through trade sales or spin-offs than it is for companies divesting assets with lower R&D expenditures. The message is clear: capital markets do not appreciate the sale of assets with innovation potential; they recognize that the parent is divesting a growing earnings stream.
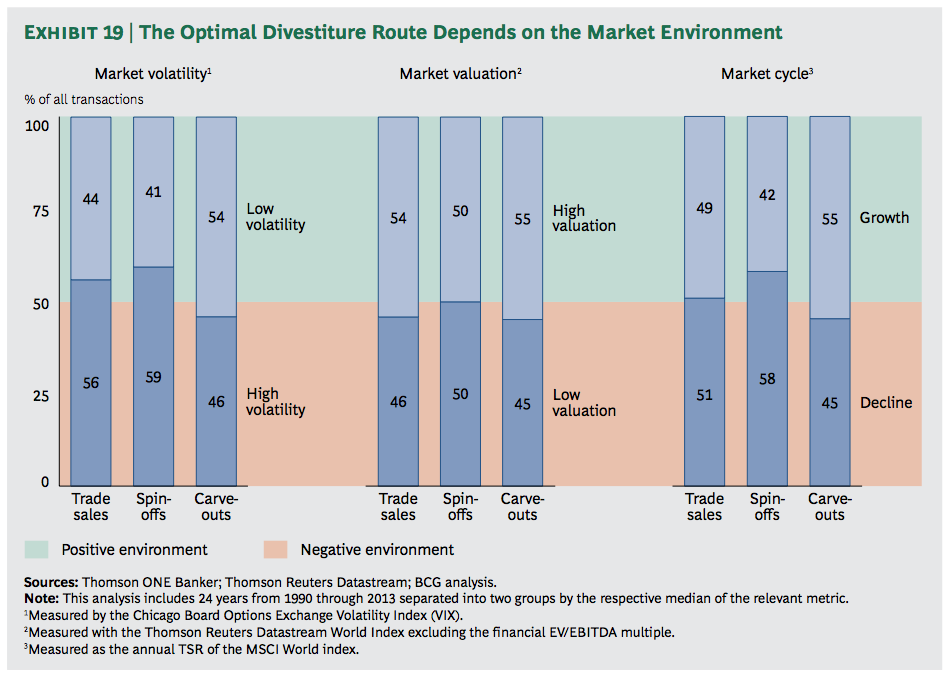
Market Environment. Timing is critical, of course. Divesting companies need to factor market volatility, valuation, and point in the cycle into their strategic considerations. Different exit routes perform very differently depending on the market environment.
To analyze the impact that market conditions can have, we divided our 24 years of data into two groups of 12 years each, assessing market volatility, valuation, and point in the cycle for each. We measured volatility by the level of the Chicago Board Options Exchange volatility index (VIX) and overall market-valuation levels by the EV/EBITDA multiple of the Thomson Reuters Datastream World Index (excluding financials). We assessed the point in the market cycle by the total shareholder return (TSR) achieved by the MSCI World Index within a year. (See Exhibit 19.)
Sellers control the process during trade sales and spin-offs, so these are the preferred routes during turbulent times, when investors shy away from IPOs. Carve-outs require a window of low volatility. Companies can keep their options open by pursuing carve-outs and also by preparing spin-off or trade-sale fallback options in the event that market sentiment shifts.
Opportunistic companies might seek to maximize cash proceeds during periods of high valuations for a subsidiary that is not part of the company’s long-term future, and indeed our results show that both carve-outs and trade sales are more often done while overall market-valuation levels are high. Spin-offs, on the other hand, can be executed in any market environment, because these transactions are cash neutral for the sellers.
Companies also need to factor in market cycles. Carve-outs are an attractive option in upswings or periods of high valuation because positive market sentiment is helpful for the parent company placing the IPO. On the other hand, spin-offs can be easily executed during downswings. Our research shows that in fact companies try to create value by this type of divestiture when market performance is poor. As for trade sales, because they are cash transactions, they can be pursued under any market conditions.
Preparing for Multiple Scenarios
Because market conditions can change quickly, it often makes sense for companies to keep their options open by pursuing multiple tracks simultaneously. In our experience, more and more companies are doing just that and delaying the final decision on which option to pursue until late in the divestiture process.
There are several benefits to a multitrack approach, including heightening the chances of competition, driving up the sales price or deal value, and allowing for maximum flexibility until a very late stage. Competition can also revitalize stalled trade sales. Moreover, the preparation processes and requirements for a trade sale, a spin-off, or an IPO, in terms of data, presentations, due diligence, and materials, are actually quite similar; a multitrack approach does not require significant additional effort.
Divestitures are a high-impact strategy with both near- and long-term benefits. Divestitures demand careful planning, however: deciding the best course for the asset, the parent company, and shareholders requires balancing multiple factors.
Companies that choose a course wisely and execute effectively can create substantial value and position themselves to perform at a higher level. When reviewing their strategic options and business portfolios, senior executives have no reason not to ask themselves, could others do better?
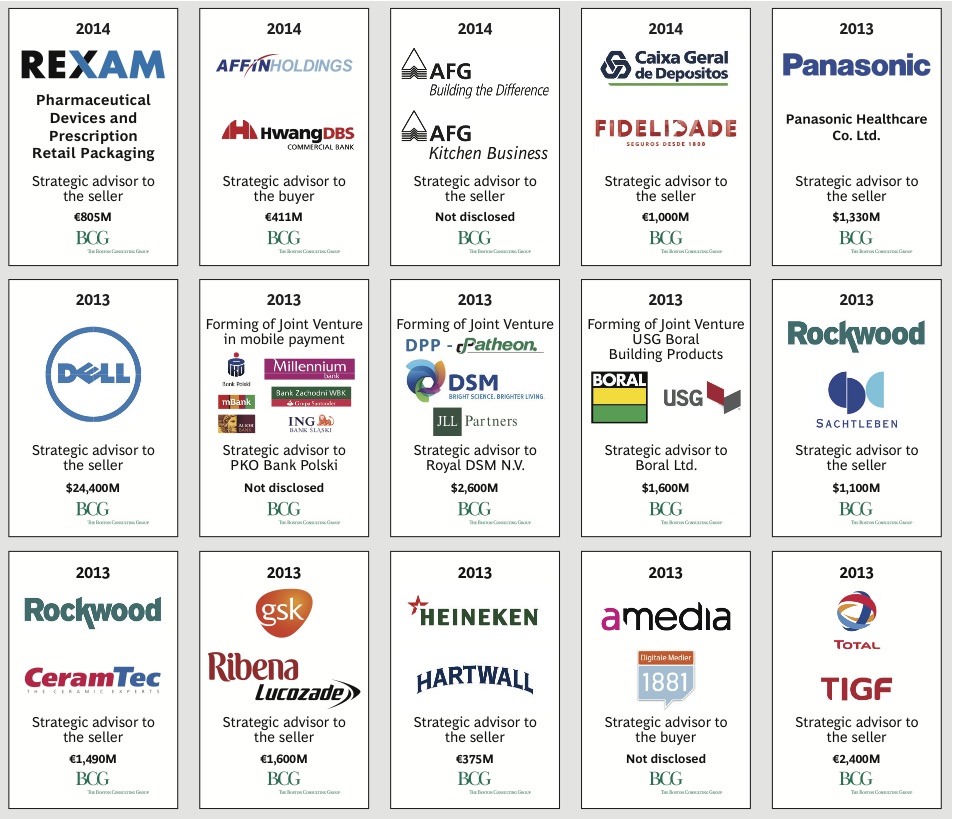
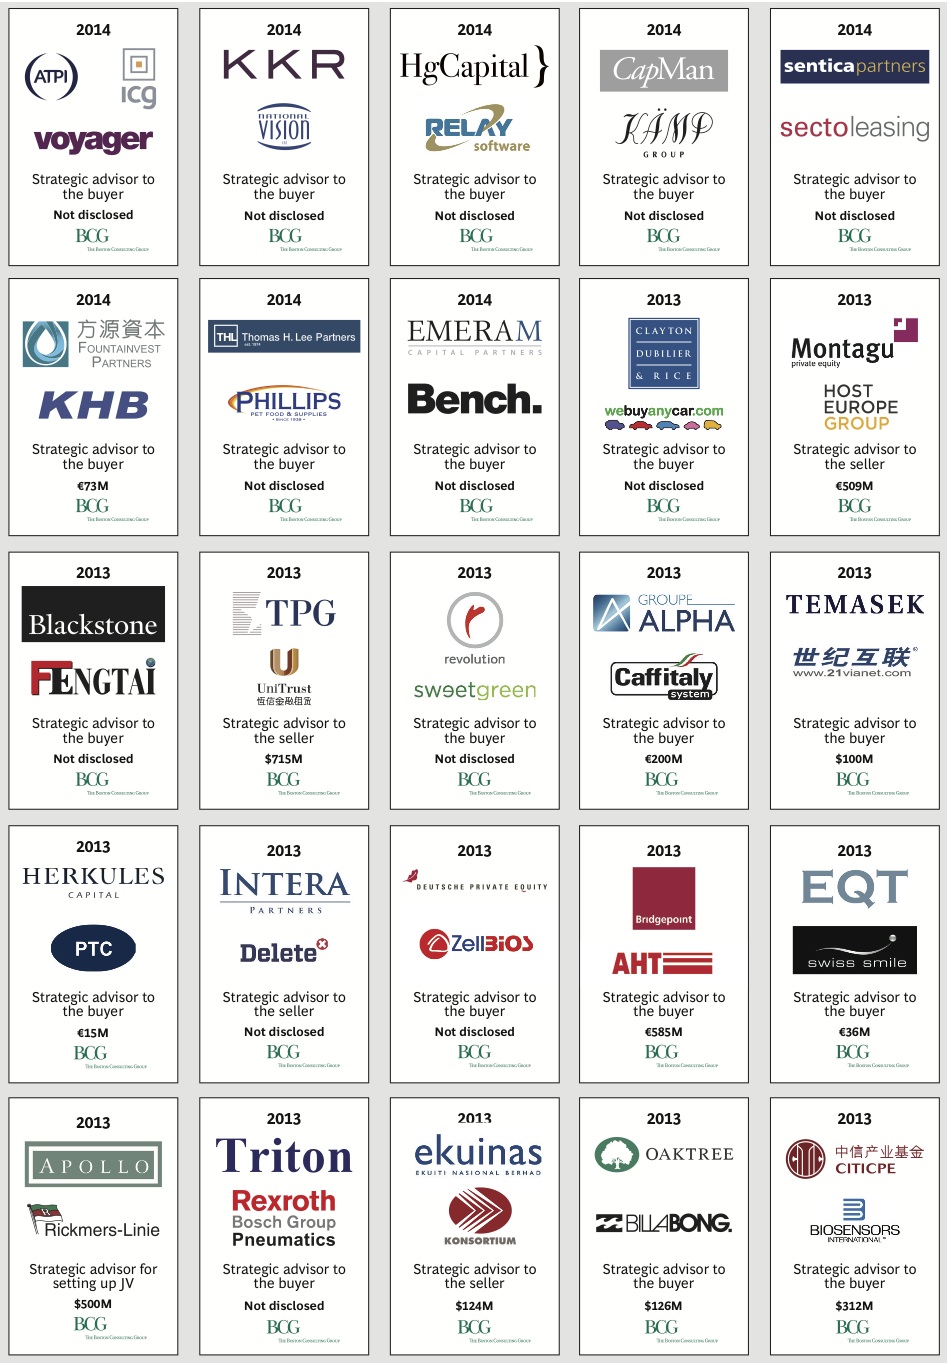
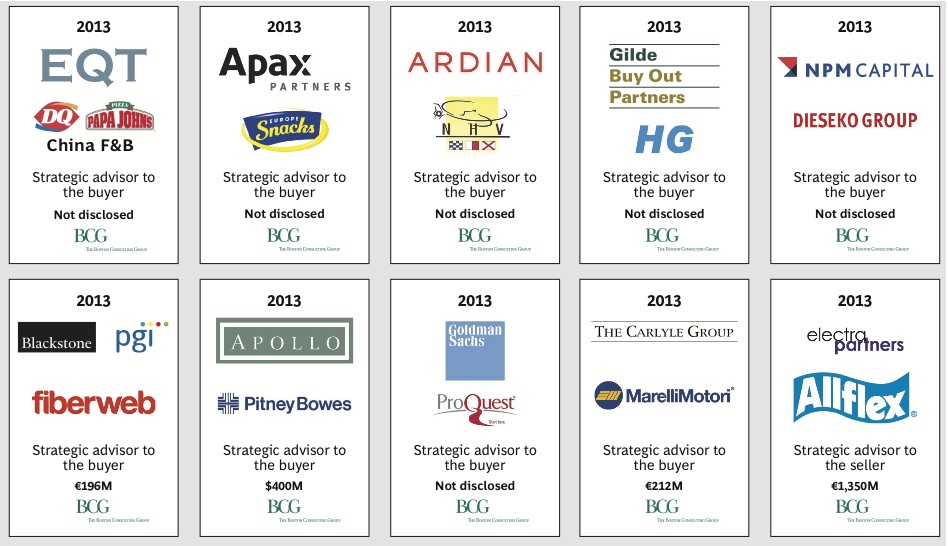
APPENDIX: SELECTED TRANSACTIONS, 2013 AND 2014
Corporate Transactions
Private-Equity Transactions


Stay up to date with M&A news!
Subscribe to our newsletter