
By Iain Macmillian, Sriram Prakash, Russell Shoult – Deloitte
IDEA IN BRIEF
- The top 1000 non-financial companies globally are holding $2.8 trillion in cash. Commentators frequently cite these record high cash figures as a key indicator that will boost capital expenditure (capex) and M&A activities that will rekindle growth.
- However, a closer look at the cash reserves suggests an uneven A handful of companies are holding significantly more cash than others and have markedly different spending patterns.
- FTSE 100 companies are typical of this global cash Deloitte UK found that just 25 per cent of non-financial FTSE 100 companies have accumulated 80 per cent of total cash reserves. These companies tend to be more conservative in their spending habits in contrast to their ‘small cash-holding’ counterparts who have been spending more aggressively in pursuit of growth and, in our view, are reaping the benefits.
- Companies have been well served during the financial crisis by being fiscally prudent though this could hamper their progress in times of recovery. Companies now need to rethink their cash strategy to create growth opportunities.
Corporate leverage, aided by financial institutions, fuelled the pre-crisis boom. The subsequent shift of debt from corporates and financial institutions to sovereigns has been one of the most significant outcomes of this ‘new’ normal world. Even as sovereigns took on increasing debt through rescue packages, the corporate sector managed to deleverage substantially through rigorous cost optimisation drives. This, coupled with astute fiscal management, allowed the corporate sector to build record levels of cash reserves. It is therefore not surprising that this period coincided with a drastic decline in M&A volumes.
Market commentators frequently cite the record levels of cash as the driver that will bring back M&A volumes. Deloitte UK analysed the cash reserves of FTSE 100 non-financial companies and explored the spending patterns exhibited by large cap (capitalisation) companies. Deloitte UK found that when the cash reserves and historical spending patterns of companies are compared a far more complex picture emerges.
Remarkably, just 25 per cent of the companies have accumulated 80 per cent of the cash reserves.
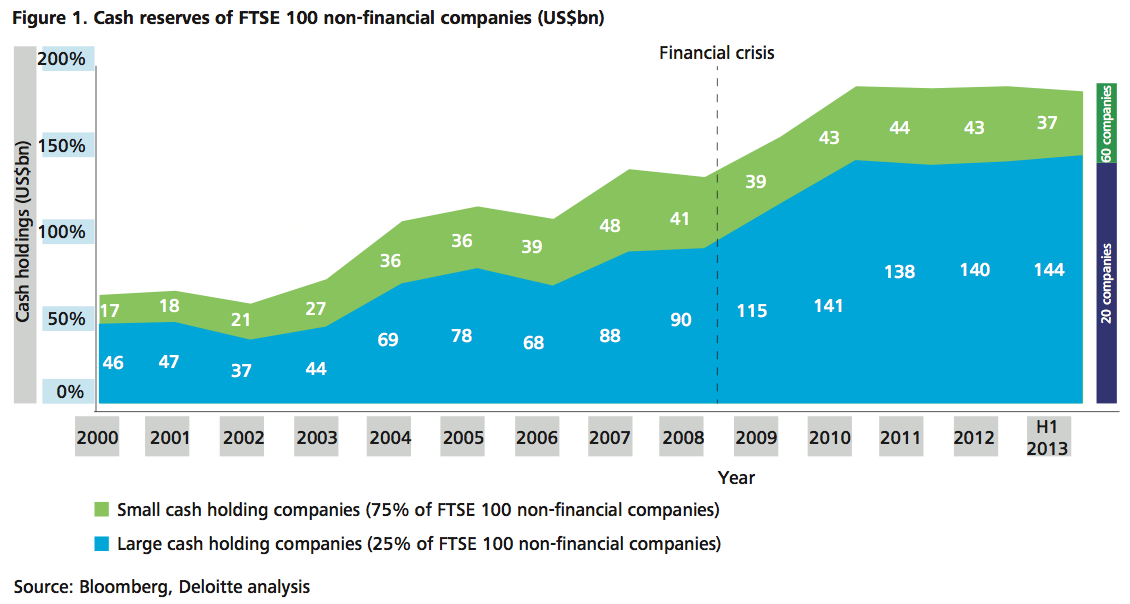
The haves and have nots
The FTSE 100 non-financial companies collectively held $180 billion in cash reserves at the end of H1 2013. Remarkably, just 25 per cent of the companies have accumulated 80 per cent of the cash reserves, a grouping we have termed ‘large cash holding’. The remaining 75 per cent of companies, which we term ‘small cash holding’, account for just 20 per cent of the total cash reserves. The ratio of cash reserves between the large cash holding and small cash holding companies remained broadly at 3:2 for a good part of the previous decade. However, the financial crisis has had a profound effect. From 2009 onwards, the large cash holding companies accelerated their cash accumulation and widened the gap between themselves and the rest. The cash balances of these companies stood at $90 billion in 2008, then jumped to $115 billion in 2009 and at the end of H1 2013, the figure was $144 billion.
In contrast, the small cash holding companies had a balance of $41 billion in 2008 that remained fairly constant throughout the crisis years and currently stands at $37 billion.
How companies spend their cash
Capex spend
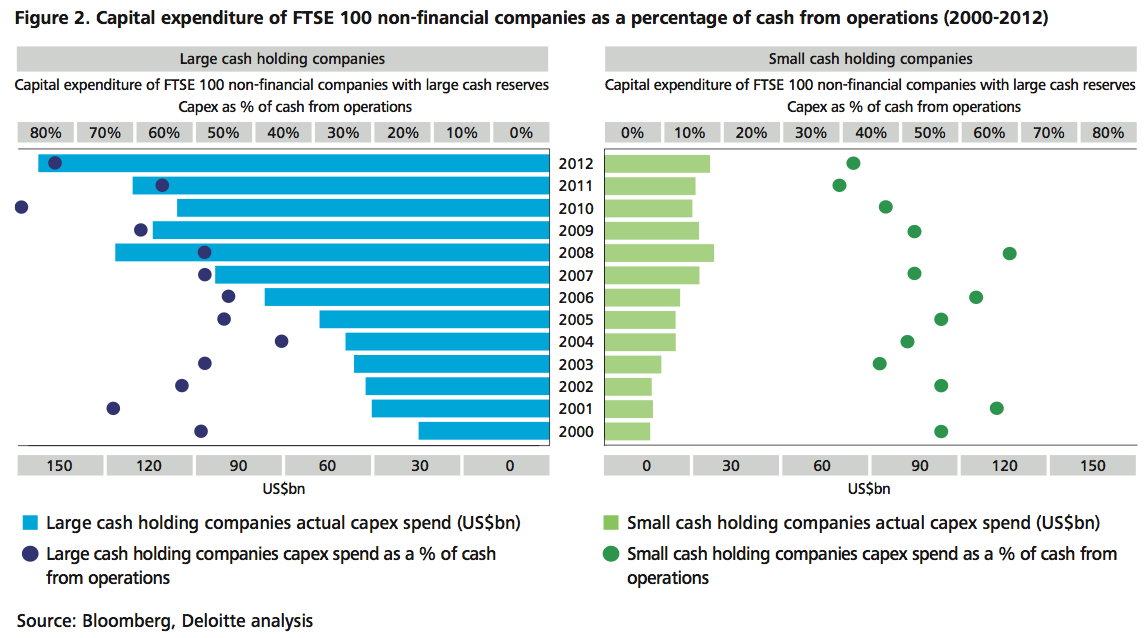
Deloitte considered the spending patterns of these two sets of companies by analysing their capital expenditure and the proportion of cash from operations allocated to this spending category.
Both have increased their capital expenditure in recent years though at markedly different rates. The large cash holding companies increased their capex almost 60 per cent, from $89 billion in 2007 to $140 billion in 2012. More telling, these companies channelled over 80 per cent of their cash from operations towards capex in 2012. Their capital expenditure from cash reserves and as a proportion of cash from operations are at their highest levels in a decade. This suggests these companies are comfortable with their balance sheets and feel confident in utilising a large portion their cash generated from operations towards capital expenditure.
On the other hand, the small cash holding companies channelled just 42 per cent of their cash from operations towards their capex in 2012, lower than their long-term average.
Unlike their large cash holding counterparts, they have not increased their capital expenditure exponentially. It rose by just 11 per cent from $27 billion in 2007 to $29 billion in 2012.
Both sets of companies have increased their capital expenditure in recent years, though at markedly different rates.
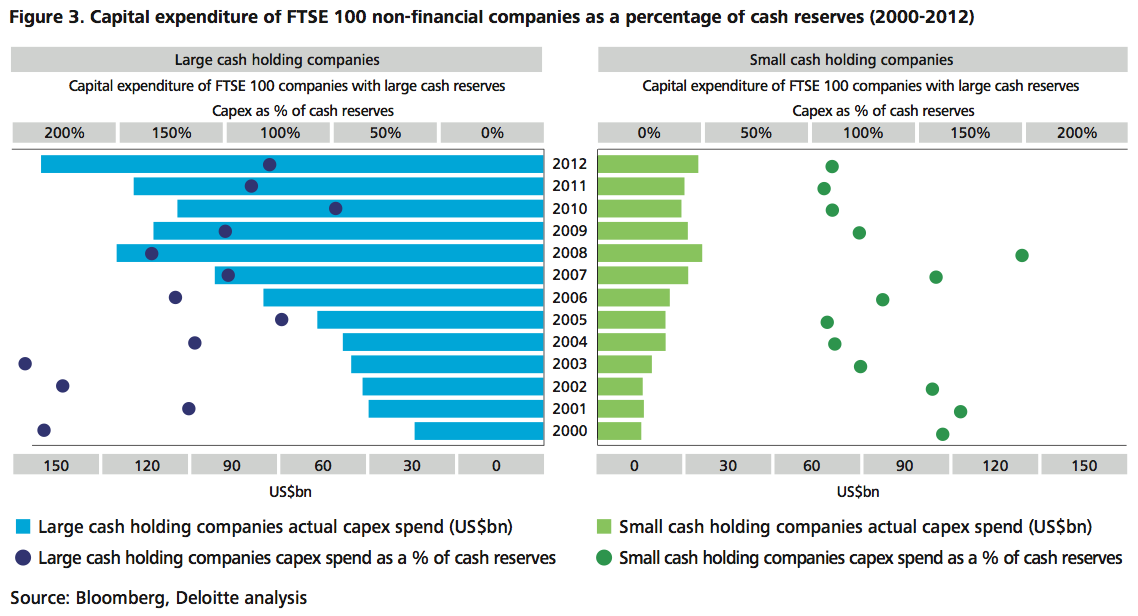
However, when Deloitte compared capital expenditure as a percentage of cash reserves we found that the large cash holding companies capital expenditure decreased in the last three years as a result of their increased cash reserves. The small cash holding companies have consistently maintained their capital expenditure at an average of 125 per cent of cash reserves over the last decade. This suggests an unwavering attitude towards capital expenditure as a proportion of their cash reserves regardless of economic conditions.
Large cash holding companies remain fiscally conservative and keen to maintain their fiscal buffer if macroeconomic conditions worsen.
How companies spend their cash
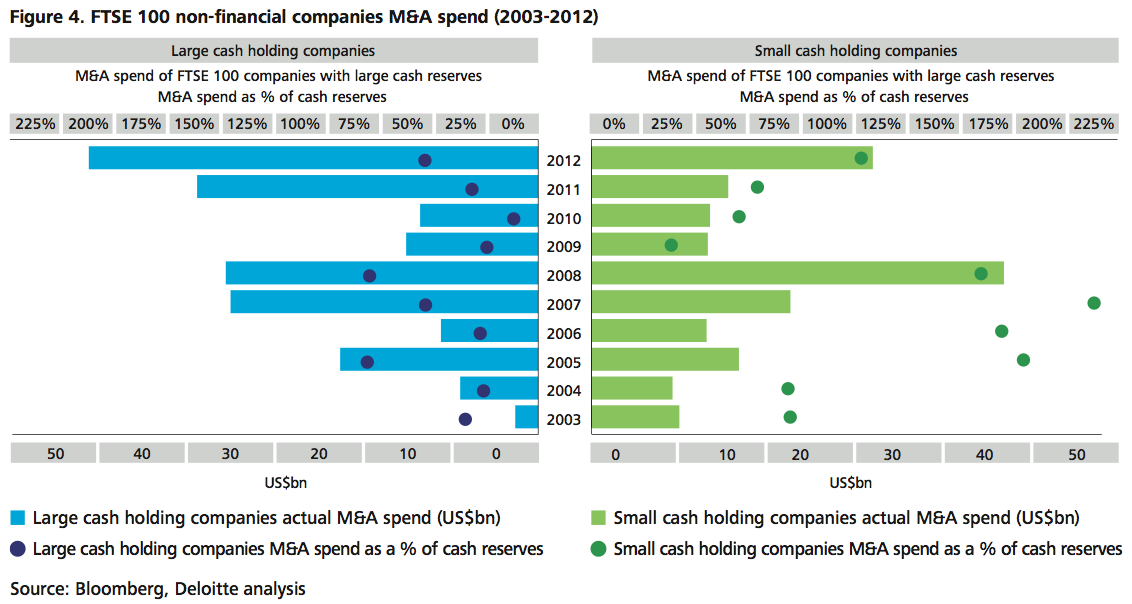
M&A spend
In 2012, there was a comeback in M&A activity with the large cash holding companies spending $44 billion on M&A activities, surpassing their pre-crisis level of $30 billion in 2008. However, this represented just 43 per cent of their cash reserves. In contrast, small cash holding companies spent $28 billion on deal activities in 2012 representing a massive 124 per cent of their cash reserves. Both large and small cash holding companies have reined back M&A spending in 2013, as of H1 they spent just 4 per cent and 31 per cent of their total cash reserves on M&A activities respectively.
Considering the above, it seems that large cash holding companies reduced both their capex and M&A spending immediately after the financial crisis, choosing to preserve cash instead.
Though spending resumed in 2011 and 2012, this still represented just a small outlay when total cash reserves are considered suggesting that they remain fiscally conservative and keen to maintain their fiscal buffer. Small cash holding companies, however, are more bullish in pursuit of growth and have been consistently more aggressive toward M&A.
Much of the spending on capex and M&A has come through the raising of new, readily available debt suggesting that companies are comfortable with the shape of their balance sheets. Total debt of the large cash holding companies rose 15 per cent from $415 billion to $477 billion from 2012 to 2013. Small cash holding companies total debt rose 11 per cent from $179 billion to $199 billion in the same period. This suggests that both sets of companies are again looking to leverage their balance sheets in the search for growth. However, the means to achieve that growth is being sought in differing ways.
Deloitte analysis suggests that the markets are more rewarding of companies who are willing to take a bullish attitude towards growth and engage in M&A activities.
Divergence in performance
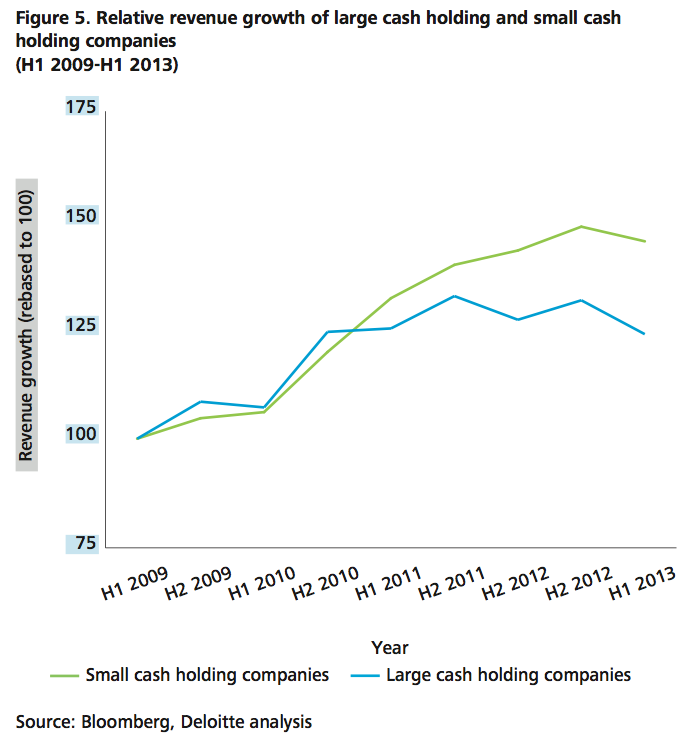
The diverging attitudes towards cash accumulation and spending are put into context when the relative performances of both sets of companies are considered. The small cash holding companies have experienced higher revenue growth since 2006 and this can be partly explained by their M&A activities.
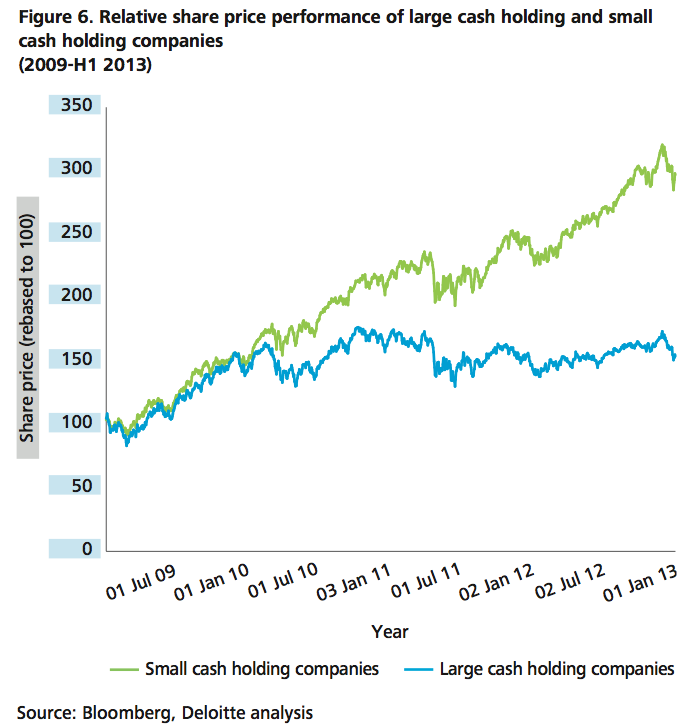
More striking is the relative share price performance of the two sets of companies. After a sustained period of similar performance, there has been a decoupling since 2010 with the small cash holding companies producing better returns. It seems the markets are rewarding their relentless pursuit of growth through both organic and inorganic means.
Corporate memory
One explanation for the diverging financial attitudes may be traced back to their relative corporate leadership. The average tenure of the current CEOs at the large cash holding companies is 45 months, whereas the tenure of those at small cash holding companies is 77 months. The CEOs of the small cash holding companies have seen the vintage years and have steered their companies through the crisis. This corporate memory seems to have served them well and gives them the confidence to take more aggressive investment decisions.
Bottom line
The large cash holding companies have been financially conservative and this has allowed them to stage a soft landing. However, this could well prove to be a double-edged sword, dragging them into a vicious circle of cash accumulation.
The current conditions of low valuations, inexpensive debt and record cash reserves all provide an environment conducive to dealmaking. Deloitte analysis suggests that the markets are more rewarding of companies who are willing to take a bullish attitude towards growth and engage in M&A activities.


Stay up to date with M&A news!
Subscribe to our newsletter