

Tech sector’s challenge: how to perform in a low-growth world
What is driving tech M&A at such high, sustained levels? Technology executives in this 15th Capital Confidence Barometer say it is the need to innovate and grow — and acquire the talent to do both. That’s simple enough, except for the increasingly complicated economic, business and technology trends around us.
Growth has been a challenge in today’s persistently slow economy — a problem that survey respondents now see exacerbated by a decline in trade due to economic nationalism and protectionism. Speaking of which, national politics has risen on executives’ watch lists as a distinct risk factor. Another mounting concern is access to credit, which has been far from problematic in previous Barometers. What’s more, earlier troubles, such as volatility in currencies, commodities and capital markets, have not gone away.
Let’s pause this litany of ills to say that the tech sector’s confidence in corporate earnings has bounced back over 20 points from our last Barometer. Rather than rolling over in the face of slow growth, geopolitical uncertainty, and concerns over both equity and credit, technology executives appear to be “rolling with the punches.”
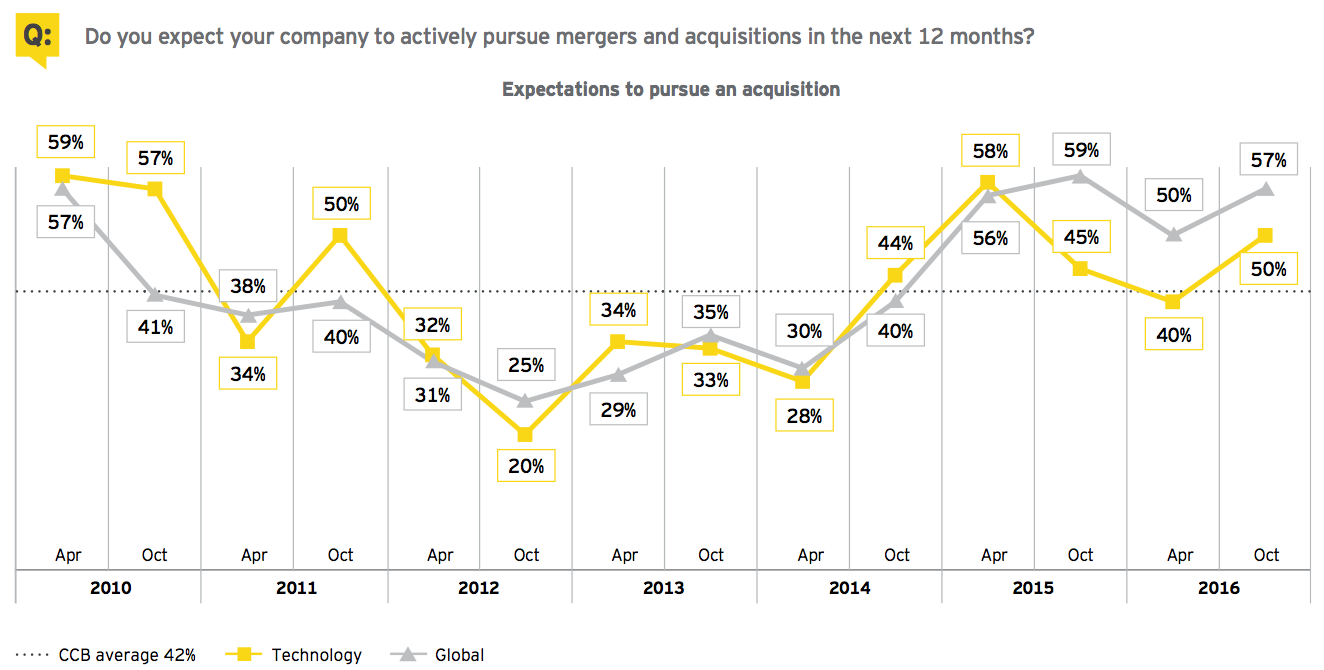
This tenacity shows both in deals recently done and in dealmaking intentions going forward. EY’s Global technology M&A report shows that in the third quarter of this year, the aggregate value of disclosed deals was US$155.5 billion — the third-highest quarter on record. Deal volume at the end of the quarter was only 4% behind 2015’s post-dotcom-record pace. And in this Barometer, tech respondents’ appetite for deals has sharply increased in the past six months, with half expecting to actively pursue deals in coming months.
Yes, it’s a complicated world for dealmakers — even today’s deal fundamentals are mixed in this report. At the same time, executives in this survey see competition coming from within and outside their own sector — including competition for talent. And, innovation is both a goal and a disruption of core business strategies — and it is unabating.
As tech and non-tech companies alike are being disrupted by innovative digital technologies — as they face the same unforgiving economic and business environment — they are turning to M&A in search of solutions. (Jeff Liu, EY Global Technology Industry Leader Transaction Advisory Services)
Key findings
Macroeconomic environment
Survey reflects slow economy, slumping trade
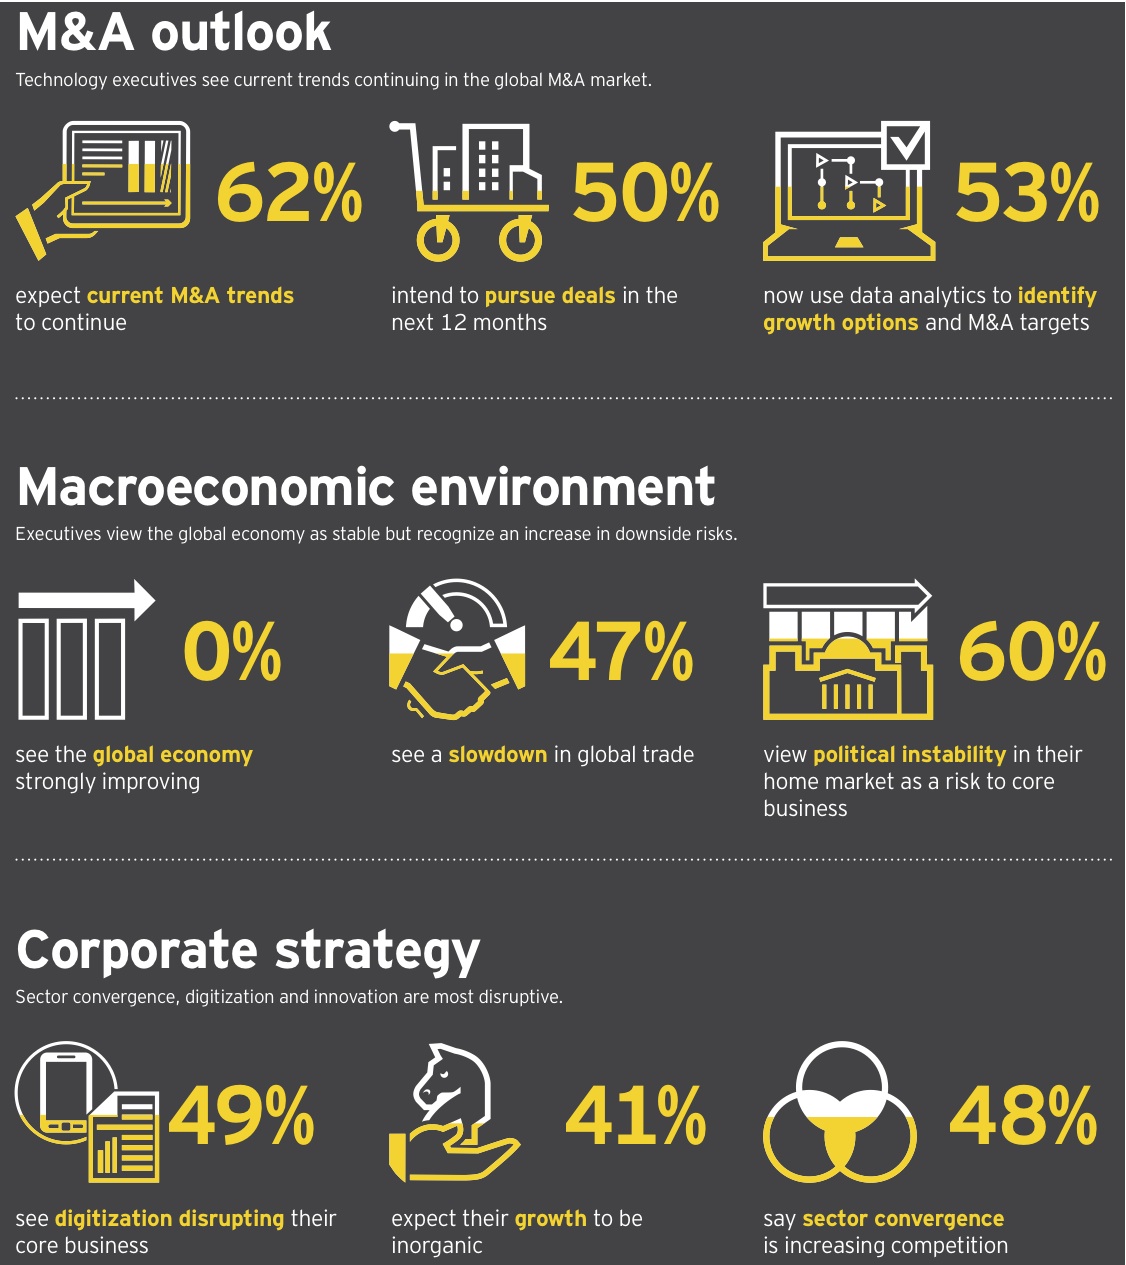
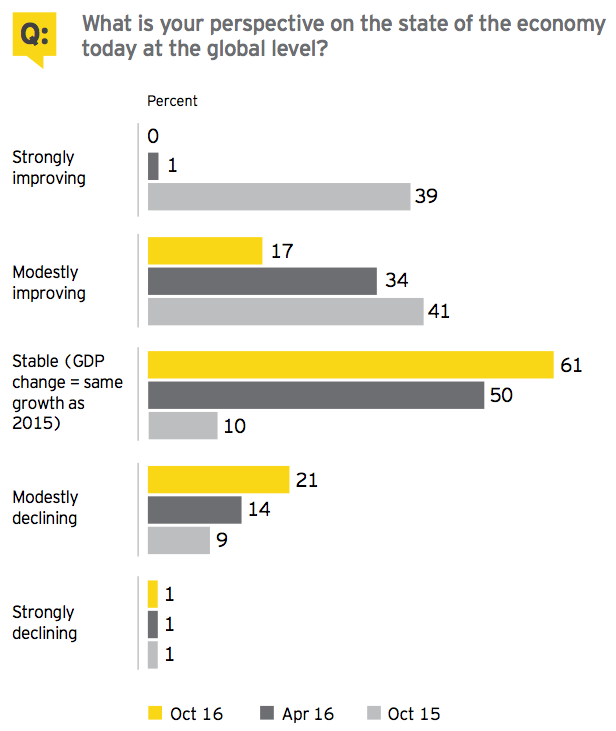
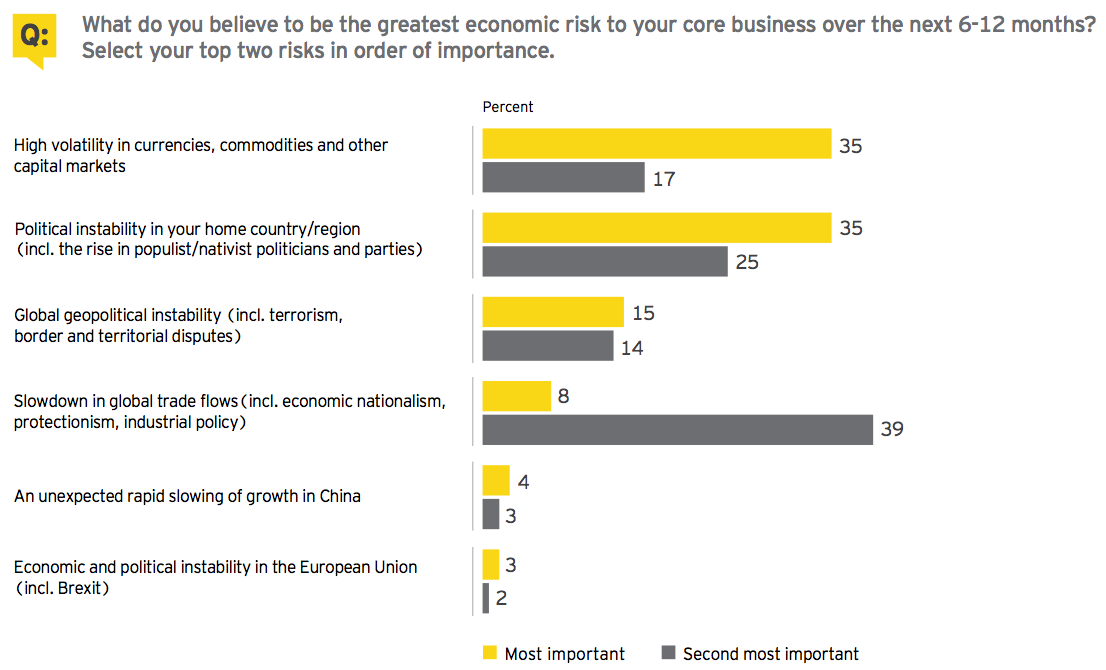
Few technology executives (17%) see global economic improvement on the horizon, and their concerns are compounded by a slowdown in international trade flows due to economic nationalism and protectionism. Nearly half of survey respondents (47%) cite slumping trade as first or second on the list of economic risks to their core business.
Political instability raises risk
Executives see significant political instability both at home (60%) and abroad (29%). Also cited as one of the greatest risks to core business is the ongoing volatility in currencies, commodities and capital markets (52%).
Access to credit becomes a concern
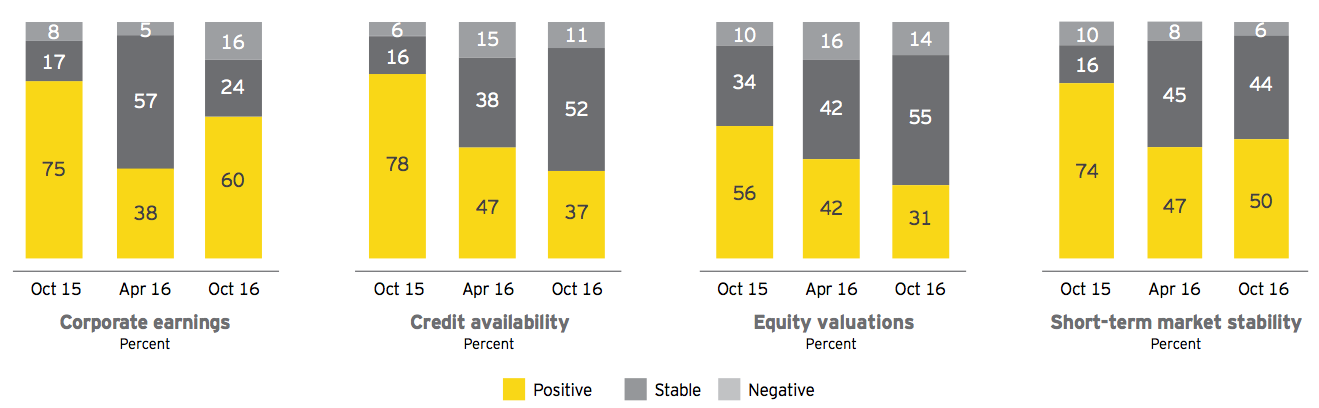
Credit and equity are both the subject of uncertainty that should be factored into any M&A market analysis. This Barometer has seen a steep drop in confidence regarding credit availability — of 41 points over the past year. Roiling credit markets are such key developments as an expected increase in US interest rates later this year, a possible tapering of quantitative easing policies in Europe and Japan, and the entry of European central banks into the corporate bond market. Equity valuations are also seen as increasingly problematic. Where over half of technology respondents (56%) were upbeat about capital markets a year ago, under a third (31%) are today.
Confidence bounces back in corporate earnings
For all the macroeconomic challenges, confidence has rebounded in corporate earnings in the past six months, although still below year-ago levels. Sixty percent of technology executives describe themselves as confident in this Barometer; this indicator is 22 points higher than in the last survey.
Responses signal renewed confidence in corporate earnings, but credit markets may tighten.
Corporate strategy
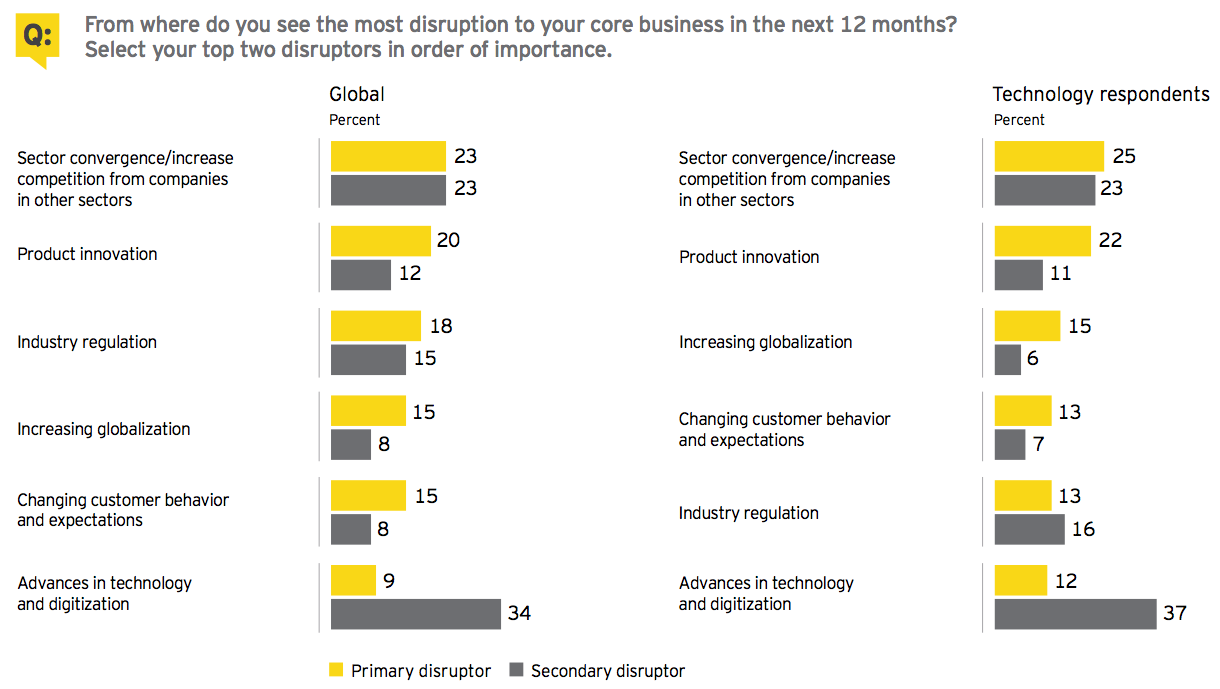
Cross-cutting digital transformation at work
Digitization and cross-sector competition/convergence are cited as most disruptive to core business. The former is driving the latter in the technology sector — and across all industry sectors. Nearly half of technology executives (49%) cite digitization among their top two disruptors, as do 43% of executives from across all sectors. Nearly half of technology executives (48%) also cite the resulting industry blur among their top two disruptors, as do 46% of executives from across all sectors.
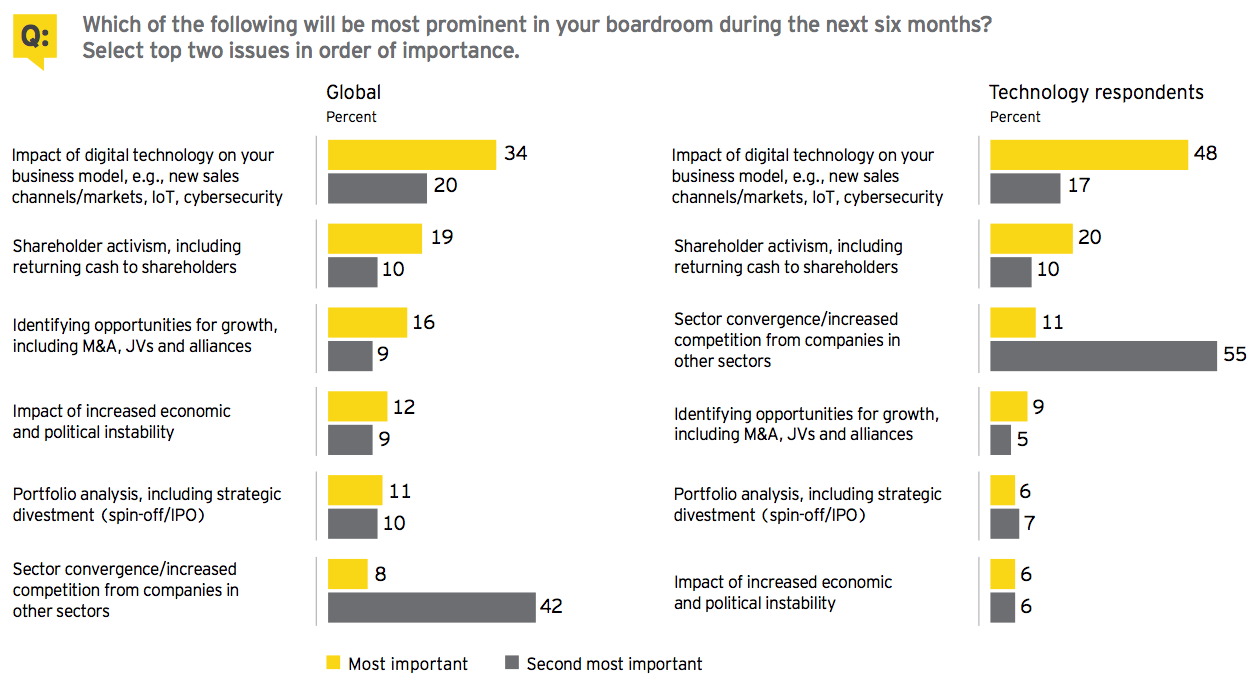
Boards also prioritize digital agenda, with eye on activist shareholders
In technology sector boardrooms, digitization (65%) and cross-sector competition/convergence (66%) also rank as the top two agenda items. Shareholder activism remains top of mind (30%). Similar discussions are taking place in boardrooms across all industries, as seen in the chart below.
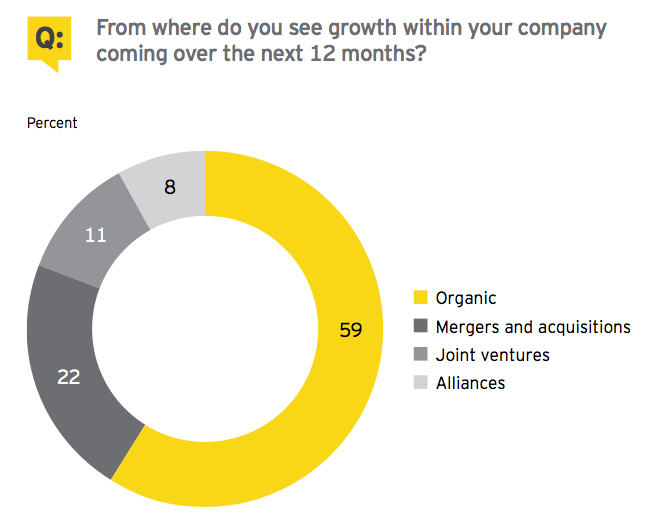
Many take the inorganic route to growth
In today’s low-growth economy, some 41% of technology executives are looking beyond organic development to find growth in acquisitions, joint ventures and alliances such as “industrial mash-ups.” This new form of dynamic and increasingly automated partnering in the business-to-business (B2B) market delivers the potential for growth with greater agility and lower cost.
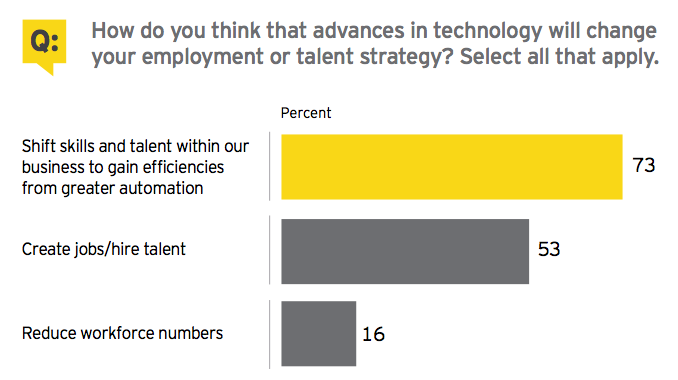
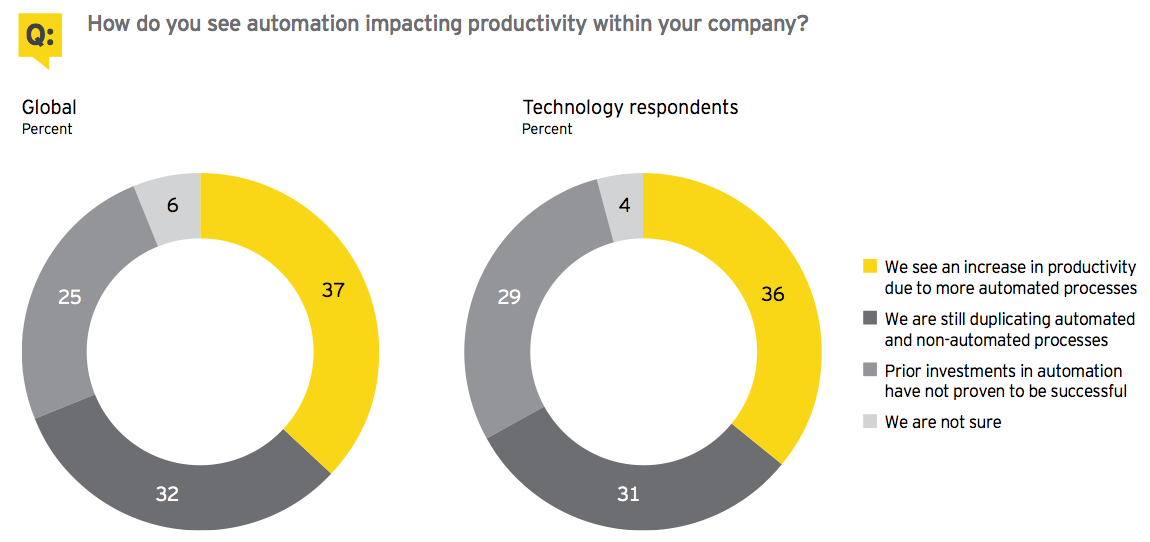
Automation + jobs = productivity?
Technology executives say they are creating jobs (53%) even while seeking to gain efficiencies from greater automation (73%), such as robots, algorithms, the “gig economy,” flexible working, and big data and analytics. Almost a third of tech respondents (31%) are duplicating automated and non-automated processes until they see the benefits of automation. The majority (60%) are still seeking the right balance between automation and workforce management. In all of these survey responses, technology and non-technology executives are generally aligned.
M&A outlook
Technology executives see current M&A trends continuing
The vast majority of tech respondents to our survey (91%) see the technology M&A market remaining in record territory. That’s where EY’s Global technology M&A report again found it in 3Q16. Aggregate disclosed deal value for the quarter was US$155.5 billion — the third-highest quarter on record. Aggregate disclosed deal volume of 911 represented a 12% decline from the previous quarter and a 15% drop from the year-earlier quarter. That said, tech respondents’ appetite for deals has rebounded in the past 6 months, with half expecting to actively pursue M&A in the next 12 months.
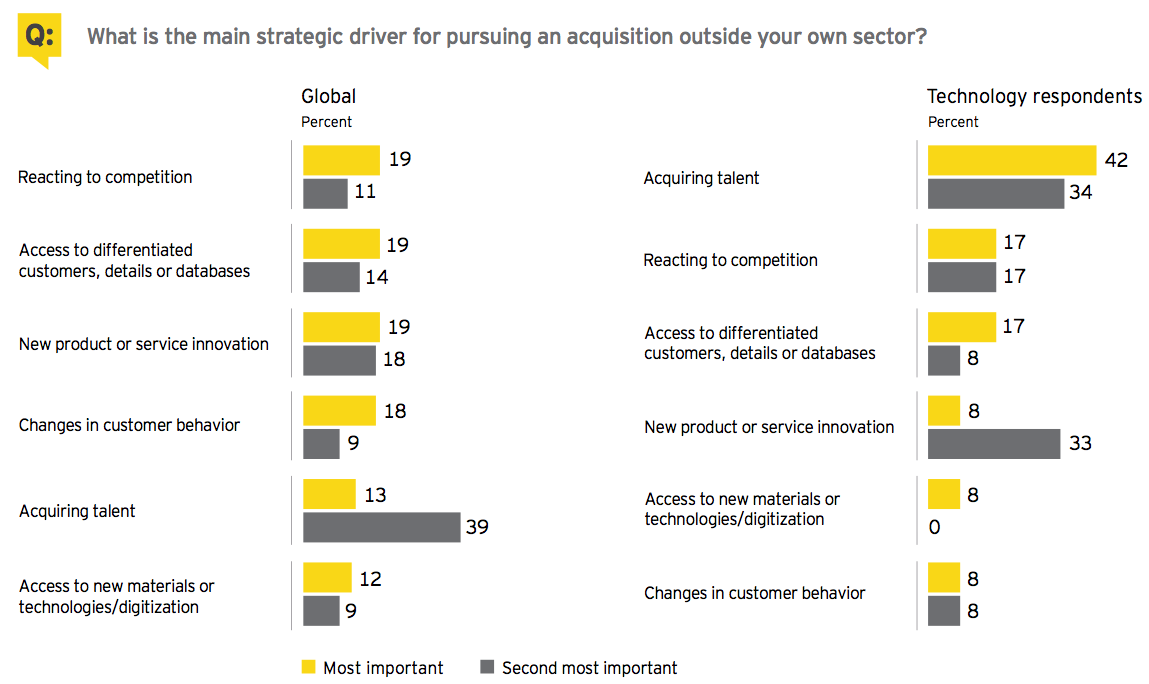
Driving deals: Search for growth, innovation — and the talent to deliver them
Technology companies are doing deals for different reasons inside and outside their own sector. Within the technology sector, deals aim primarily at growing market share (46%) and addressing customers’ changing digital behaviors (43%), executives say. They are making acquisitions in other sectors primarily to acquire talent (76%) and new product or service innovation (41%). In the hunt for talent, the competition can cut both ways — companies in all industries are doing deals to acquire talent outside their own sectors (52%).
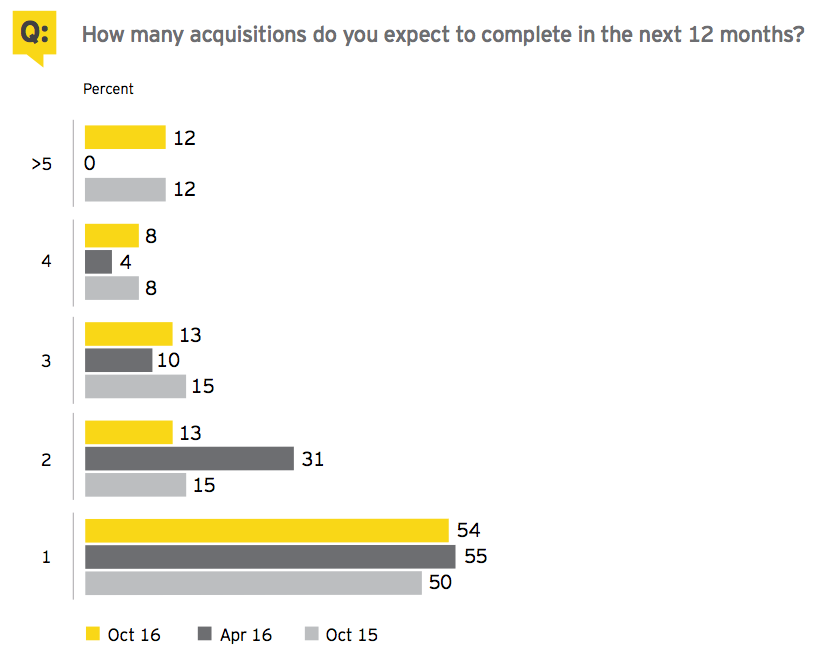
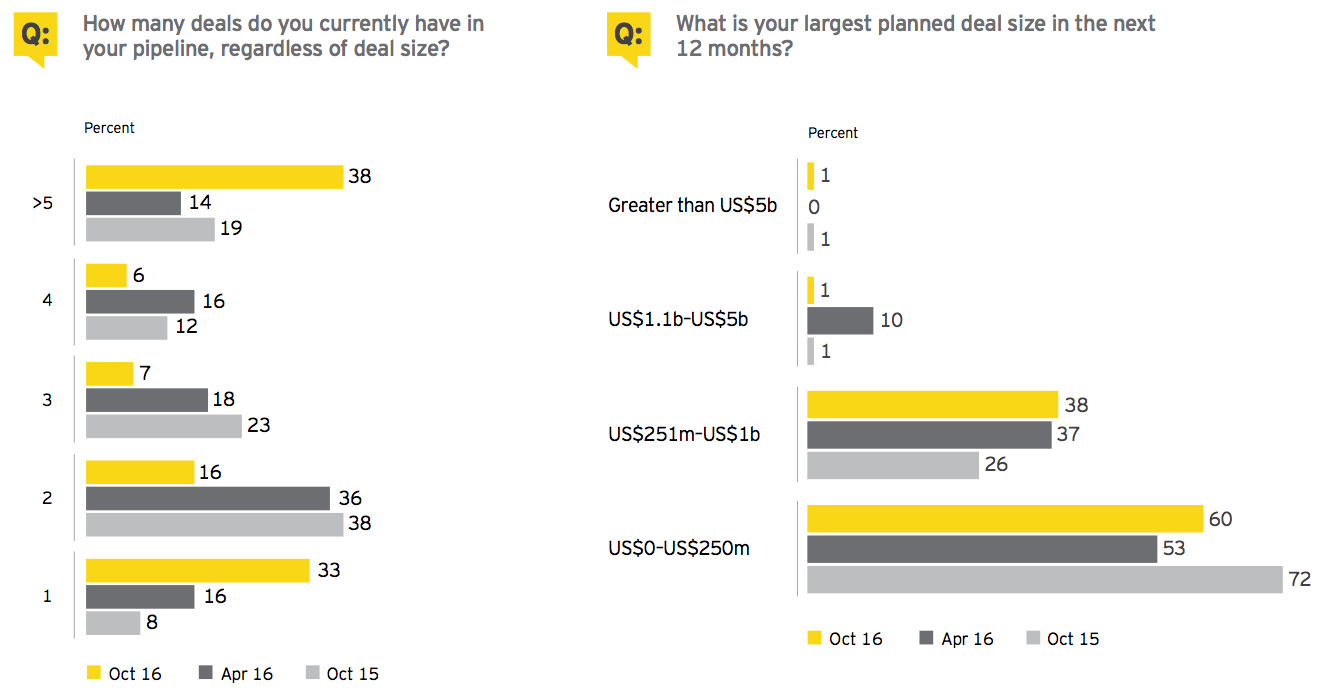
Deal pipelines continue to flow
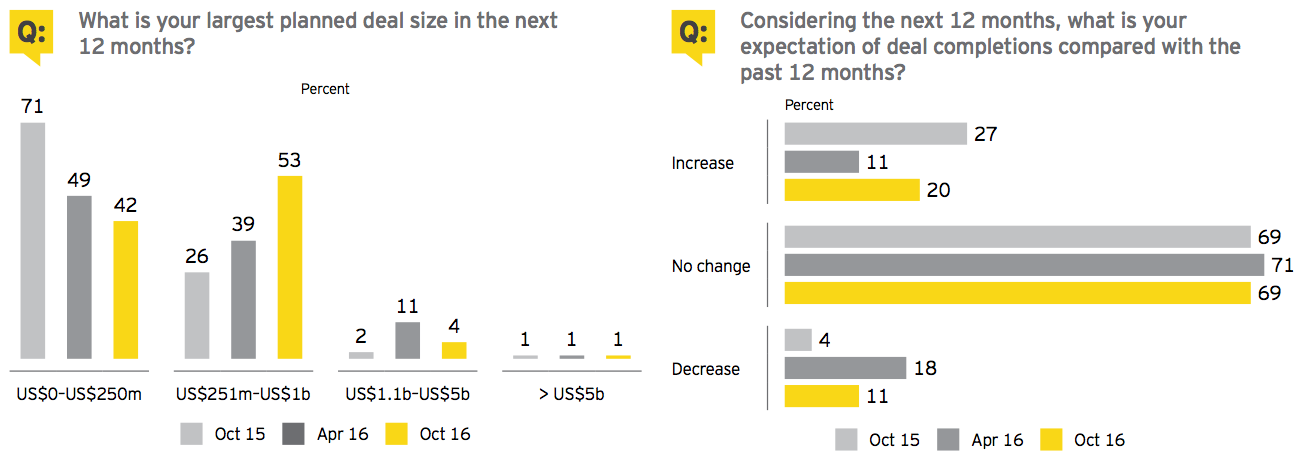
Over half of technology executives pursuing deals (54%) expect to complete a single acquisition within a year, and the rest plan more. Over a third of them (38%) say they have more than five deals in their pipeline. The vast majority (98%) of these deals are in the range of US$1 billion or under. Eighty percent of tech respondents would characterize their dealmaking volume as unchanged over the past 12 months, and most (79%) expect no real change in the next 12 months.
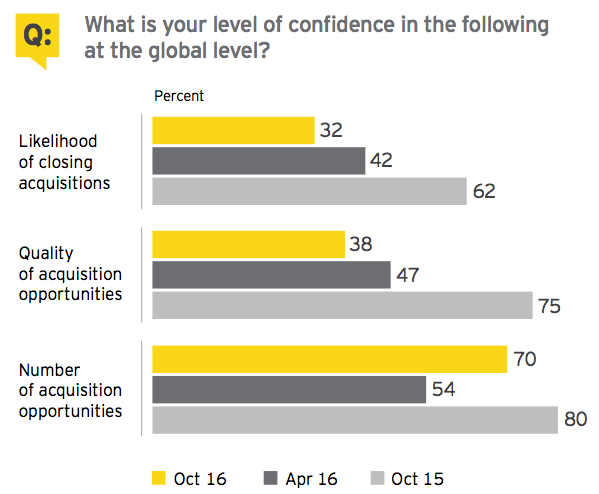
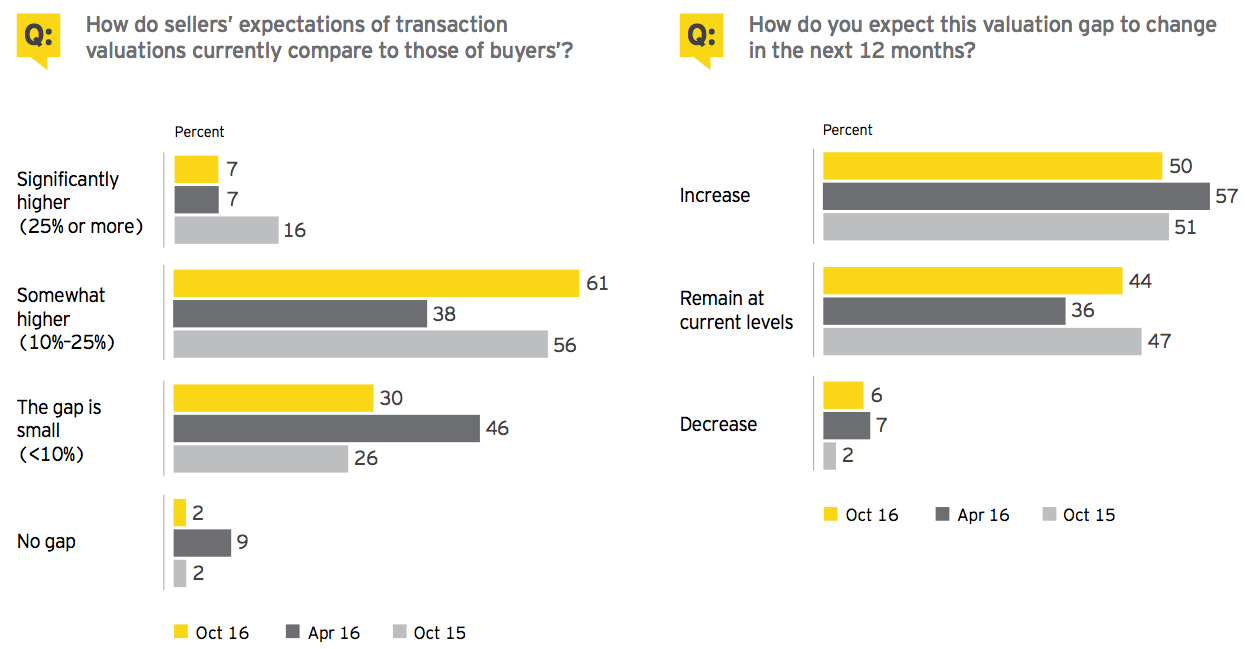
Deal fundamentals are mixed
Technology executives are positive about the number of acquisition opportunities on the market (70%) but less impressed with their quality (38%) and the likelihood of closing (32%). Sellers’ expectations of transaction value are higher than buyers’ (68%), and this valuation gap is seen by half of respondents to be increasing.
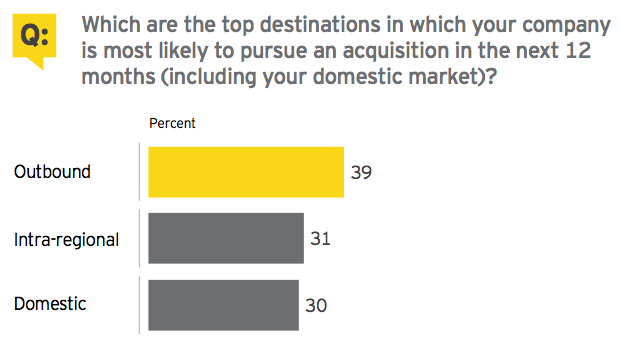
Cross-border deals in the crosshairs
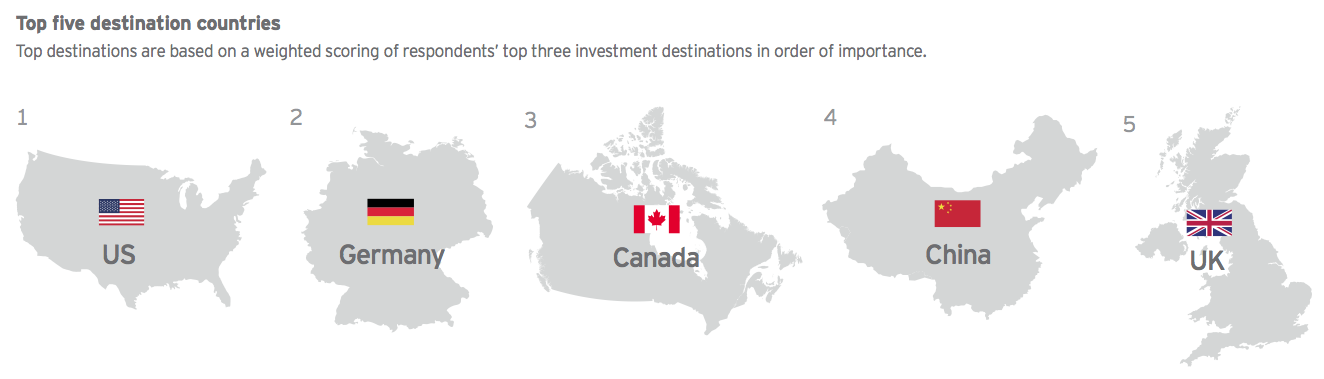
Despite concerns expressed by survey respondents about the rise of nationalism and the potential for protectionist measures, cross-border deals are in the crosshairs. Over a third of technology executives (39%) say they are most likely to pursue an overseas acquisition in the next 12 months. In 3Q16, EY’s Global technology M&A report recorded a new quarterly record for cross-border disclosed value deals — US$80.8 billion, or 85% higher than the previous record set in 2Q15. Tech respondents’ top five acquisition destinations are the US, Germany, Canada, China and the UK (in that order).
Despite Brexit concerns, the UK remains a top investment destination for the technology sector.
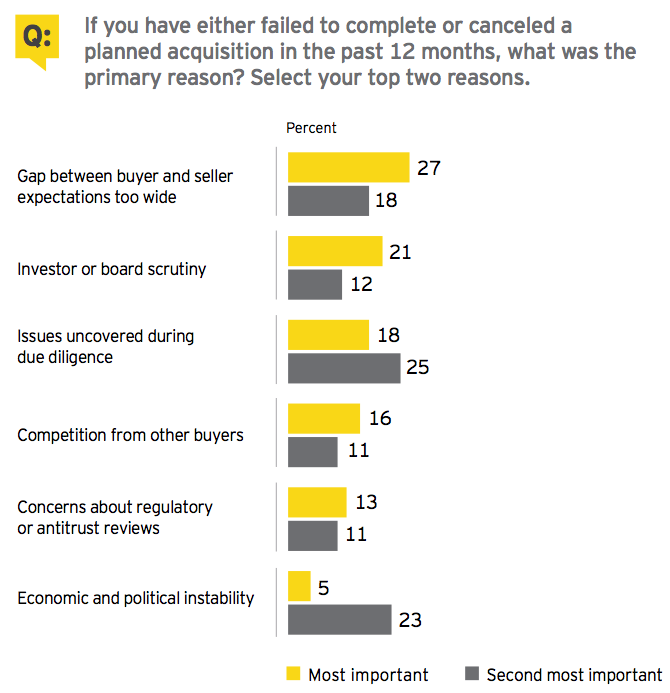
Dealmakers prepared to walk away from the table
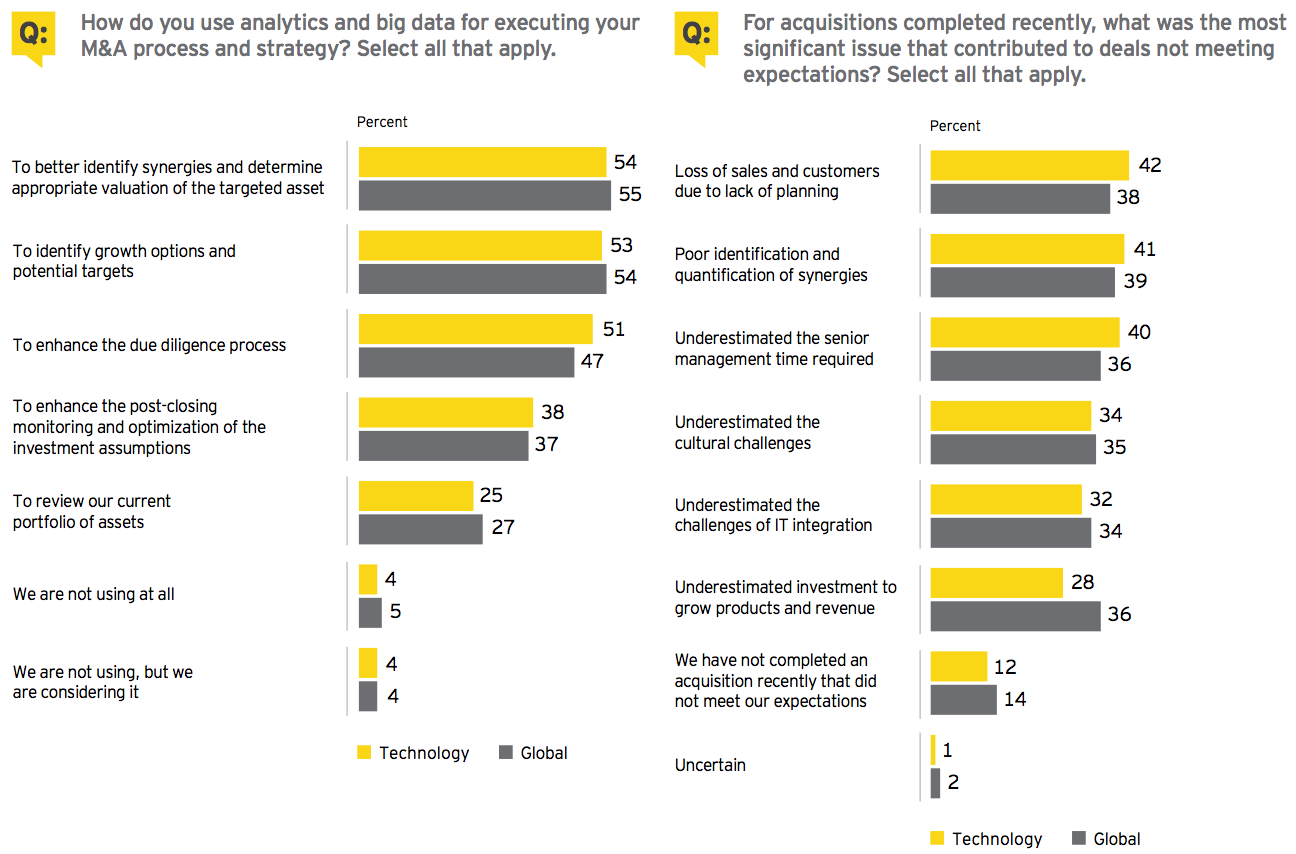
Fully 94% of tech respondents say they have canceled or failed to complete a planned acquisition in the past 12 months — primarily due to price (45%). Over half of tech respondents (54%) are using analytics and big data to measure appropriate valuations of targeted assets, among other important aspects of their deals. After closing, deals can fail to meet expectations for many reasons — mainly poor planning, tech respondents say.
With the deal table permanently reset, these are the better questions executives needs to ask themselves to maximize their growth strategy in today’s market.
1. Are you capitalizing on the breadth of deal structures to realize your strategic objectives?
Amid unprecedented change, many companies have to reinvent themselves fast — organically and through inorganic investments. Beyond traditional M&A, joint ventures, alliances, partnerships and industrial mash-ups are emerging as alternatives to effectively secure deal value.
2. Will geopolitical challenges derail your growth strategies?
Political uncertainty is increasingly affecting global trade and credit markets. Executives who do not proactively consider it or effectively respond in their approach to dealmaking run the risk of poorly executed growth strategies.
3. Are you using analytics and big data to bring greater clarity to increasingly complex deals?
Complexity around the deal table can be simplified through the use of transaction analytics. Companies are looking at an increasing number of targets, often in unfamiliar industries. With multiple stakeholder considerations, ensuring access to the skills to find better answers to complex capital strategy questions is an imperative.
4. Is an off-the-shelf approach to integration the best recipe for success?
Realizing full transaction value has historically been difficult to achieve. With the pace of dealmaking intensifying and the realization of back office and customer value enhancement nonnegotiable, a disciplined, C-suite-sponsored integration strategy unique to the deal scenario is crucial.
5. Are you enhancing or destroying the value of acquired innovation?
The rapid rise of new ways of doing business, predominantly through digital channels and unique ways of utilizing labor, is fueling dealmaking aimed at securing innovation. Companies that adapt their strategies and operating models not only protect but take advantage of technology and innovative thinking and will be best placed to seize competitive advantage.
About this survey
The Global Capital Confidence Barometer gauges corporate confidence in the economic outlook and identifies boardroom trends and practices in the way companies manage their Capital Agendas — EY’s framework for strategically managing capital.
It is a regular survey of senior executives from large companies around the world, conducted by the Economist Intelligence Unit (EIU). Our panel comprises selected global EY clients and contacts and regular EIU contributors.
• In August and September, we surveyed a panel of more than 1,700 executives in 45 countries; nearly 50% were CEOs, CFOs and other C-level executives. There were 419 executives surveyed from the US.
• Respondents represented 18 sectors, including financial services, consumer products and retail, technology, life sciences, automotive and transportation, oil and gas, power and utilities, mining and metals, diversified industrial products, and construction and real estate.
• In this survey, we had 255 respondents from technology companies, of which 51% were CEOs, CFOs and other C-level executives.
• Technology companies’ annual global revenues were as follows: less than US$500m (41%); US$500m–US$999.9m (27%); US$1b–US$2.9b (7%); US$3b–US$4.9b (13%); and US$5b or greater (12%).
• Global company ownership was as follows: publicly listed (66%), privately owned (33%), family-owned (2%) and government-/state-owned (1%).


Stay up to date with M&A news!
Subscribe to our newsletter