

EXECUTIVE SUMMARY
The fundamental drivers of global transactions are pointing to a continued strong upturn in M&A and IPOs over the next three years. Global economic growth is expected to accelerate, and low interest rates and easy credit conditions in key countries are likely to maintain upward momentum in equity markets.
Many US and European companies have accumulated large cash balances available for acquiring new businesses. Financial sponsors also have the potential to boost global transactions, with private equity firms sitting on a record US$1.1 trillion in uninvested capital, according to Preqin.
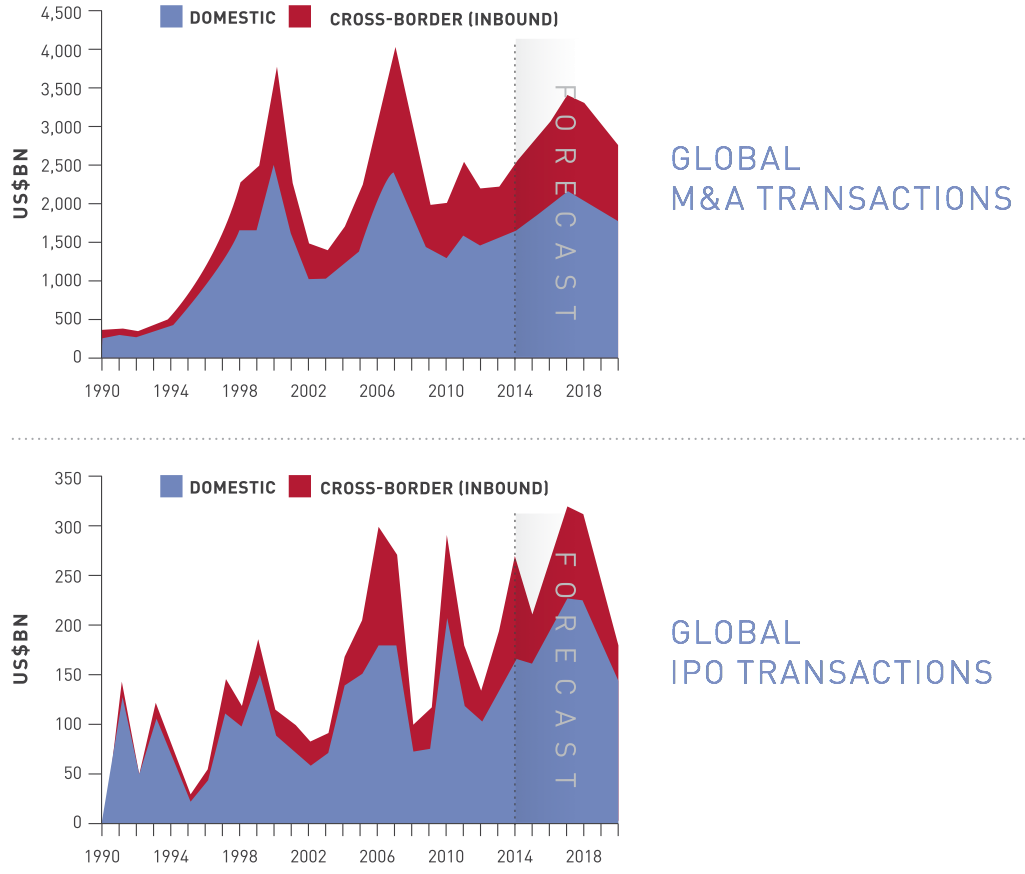
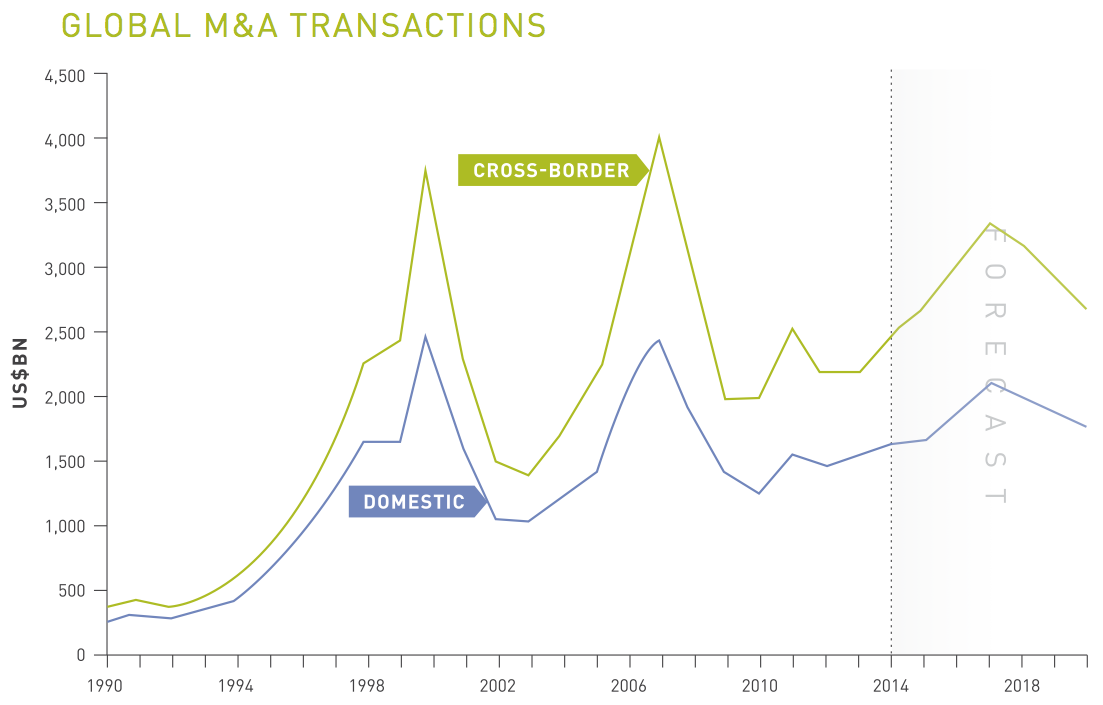
Against this backdrop, we project that global M&A and IPO activity will continue to rise, peaking in 2017 in developed markets and 2018 in emerging markets. Our forecasts, based on calculations from Oxford Economics, show completed global M&A transactions growing to US$2.7 trillion in 2015 and rising further to US$3 trillion in 2016 and US$3.4 trillion in 2017.
In our forecast, we do not expect the transaction peaks in 2017 and 2018 to be as high as those before the global financial crisis, as we are not experiencing the same bubble-like conditions prior to 2007. As the global economic recovery continues, we expect central banks to begin raising interest rates in developed markets and equity markets to moderately decline. We anticipate that these forces will soften the attractiveness of deal-making, leading to a slowing of global activity beginning in 2018.
Our M&A forecasts by region include:
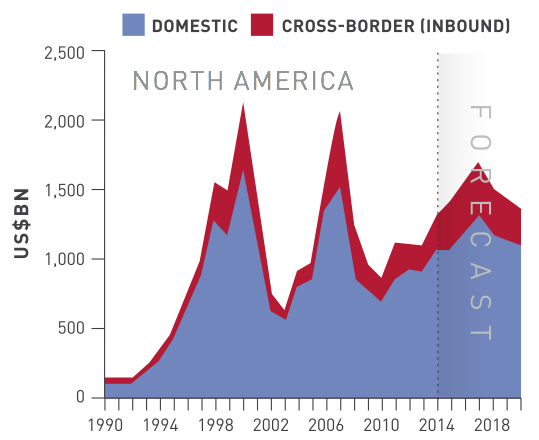
■ Strong levels of activity in North America for the next three years, particularly in the United States. Our projections show M&A transactions rising from US$1.2 trillion in 2014 to a peak of US$1.5 trillion in 2017. As interest rates normalize and the Federal Reserve starts reducing the size of its balance sheet, we expect credit conditions to tighten and equity valuations to weaken, precipitating a slowing of deal-making beginning in 2018.
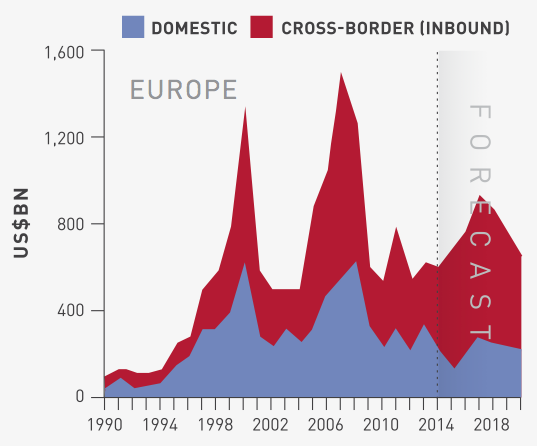
■ A rise in M&A deals in Europe, driven by inbound transactions by US companies taking advantage of a strong US dollar. We predict the total value of deals will rise from US$621 billion in 2014 to US$936 billion in 2017 as the region’s growth prospects brighten. The UK, Germany and Spain are attractive investment destinations, with France and Italy less so, and Russia off limits for European and US firms because of imposed sanctions.
■ Re-emergence of Asia as one of the world’s most dynamic growth stories, beginning next year. Despite a slowing in China’s GDP growth, we expect the region’s strong economic fundamentals to spur a renewed upturn in transactions from 2016 to 2018. A resurgence in cross-border transactions, including outbound activity by the Chinese into neighboring Asian countries, will drive this projected increase.
■ Improved growth prospects in Latin America, despite subdued transaction forecasts for Brazil and Mexico that are dampening the region’s M&A outlook. Mexico President Peña Nieto’s policy reforms should encourage a moderate pick up of M&A activity and enable Latin America to join the global upswing in the next three years. Those reforms include empowering regulators to tackle monopoly positions in the communications sector and opening the energy sector to private investment for the first time in 75 years.
■ More deal-making activity in Africa and the Middle East as oil prices rebound over the next few years. The decline in oil prices has restricted available funding for M&A, but a recovery in oil prices should increase deal-making activity in the region. Key to improving M&A activity in Africa is pushing forward economic reforms and consolidating progress already made in countries like Egypt, where the government has introduced business-friendly investment policies.
Other key M&A forecasts include:
■ Cross-border M&A activity will outpace domestic activity this year as the share of cross-border deals rises to 38% in 2015, up from 36% in 2014. The pace of cross-border activity will slow in 2016 but rise back to a 38% share by the end of 2017.
■ Emerging market M&A activity will capture a larger share of total deals, rising to 21% of total transactions in 2018 through 2020, up from 18% in 2014.
■ Pharmaceuticals is the sector driving global M&A, and transactions in the more broadly defined healthcare sector should continue rising in the next three years. consumer and technology & telecoms have good long-term prospects, while consolidation in the energy and financial sectors is also likely to drive deals.
Our IPO activity forecasts by region include:
■ A potential recovery in domestic IPOs in North America, despite a dip last year. According to our projections, domestic IPOs will push toward a new record of US$82 billion by 2017 as stock markets rise, market volatility remains low and corporate confidence grows.
■ A slowing of IPOs in Europe this year amid uncertainty linked to parliamentary elections in the UK, Greece, Spain, Poland, Denmark, Finland and Portugal, as well as the recent pullback in stock prices across the major exchanges. However, we expect the upswing in IPO activity to return next year, pushing the amount raised on stock markets to US$67 billion by 2017.
■ Acceleration of IPO activity in Asia Pacific over the next three years. Domestic IPO activity jumped by 36% from 2013 to 2014, led by strong gains in Australia, Hong Kong and Japan. It’s a trend we expect to continue through 2018, peaking at US$87.4 billion as the regional economy accelerates and companies seek to raise capital on domestic markets to appeal to the growing middle class.
■ Continued rise of emerging markets-based companies pursuing cross-border listings as they seek to raise capital in deeper, better capitalized markets in the US and UK. As emerging capital markets mature and deepen over the medium term, however, we expect to see more domestic IPO activity, particularly in Asia.
INTRODUCTION
The early months of 2015 suggest a continued rise in global transactions, led by M&A, with completed deals on track to increase to US$2.7 trillion this year. IPO activity also remains steady, poised to total nearly US$215 billion in 2015.
This renewed momentum in deal-making activity leads to the following questions:
■ Which regions and sectors are driving the rise in transactional activity?
■ Is it sustainable?
■ What risks could derail the recovery?
This report introduces Baker & McKenzie’s Global Transactions Forecast, which seeks to answer these questions by examining the latest trends in M&A and IPO activity and providing transaction forecasts by region, country and sector based on calculations from Oxford Economics.
Like any prediction, known risks and unforeseen circumstances could disrupt the nascent global recovery and cause a drop in transactional activity, such as Greece exiting the Eurozone, the UK leaving the European Union, Chinese investment falling sharply, and the US Federal Reserve raising rates faster than expected.
Absent events like these, however, our report outlines the six macroeconomic trends that will drive global economic growth over the next few years. Based on those cyclical trends, along with structural factors and business sentiment, we provide predictions for how much M&A and IPO activity will rise or fall in 37 countries from 2015 through 2020.
By providing this outlook, we aim to provide corporate leaders and investors with a forward-looking overview of the economic and investment environment they are likely to face around the world. Armed with this knowledge, we hope they will be better prepared for the future.
Our report outlines the six macroeconomic trends that will drive global economic growth over the next few years.
KEY MACRO TRENDS
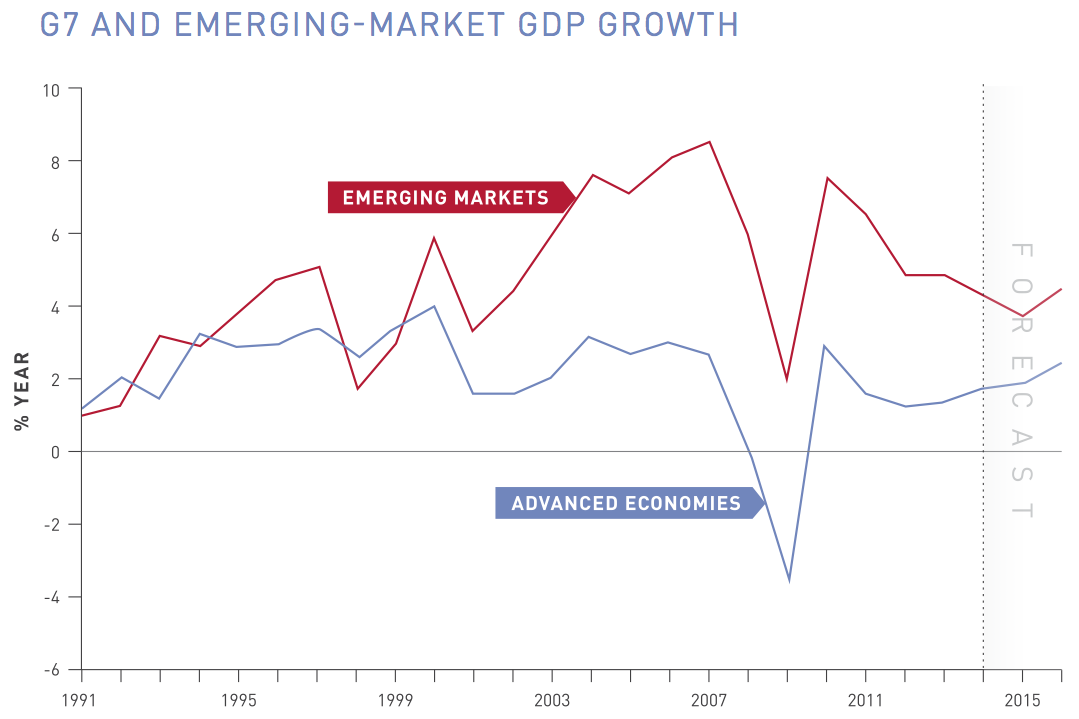
After a long and stuttering recovery from the global financial crisis, global economic activity should accelerate to an average of 2.9% per year over the next three years, from an annualized 2.5% since 2012. Developed economies will lead the growth, bolstered by easy monetary policy and lower oil prices.
Although lower oil prices will give many emerging markets a boost, commodity exporters such as Russia, Saudi Arabia and the United Arab Emirates will suffer. Growth in many emerging economies is also constrained by regulatory barriers and trade restrictions, as well as the middle-income trap.
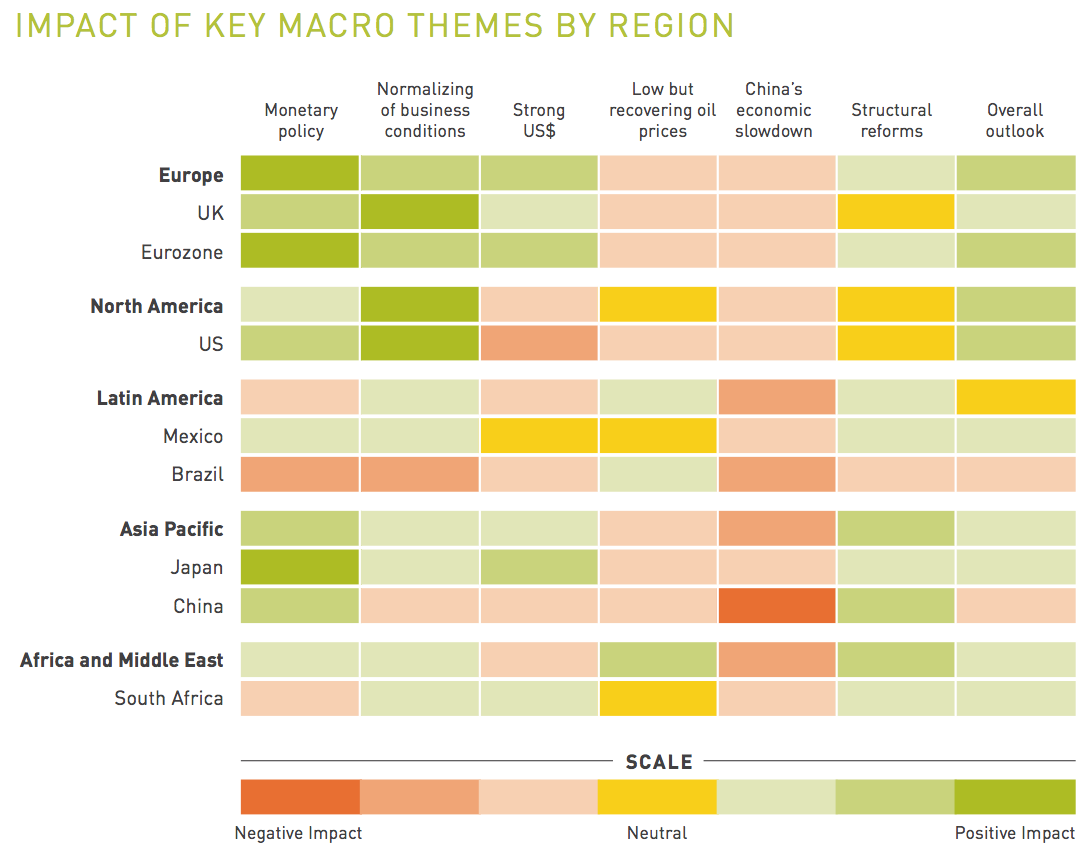
As part of our forecast, we identified six global macroeconomic trends that are critical to determining the economic and financial outlook for different countries. That outlook, along with perceived risks, plays a major role in whether M&A and IPO activity in these regions will rise or fall in the near future.
Even with the Fed raising rates, monetary policy will remain accommodative through 2017.
TREND 1: EXTREMELY ACCOMMODATIVE MONETARY POLICY
Although the US Federal Reserve is poised to raise interest rates later this year, it is expected to do so gradually, ensuring monetary conditions remain accommodative through 2017. Even as the Fed starts to engineer higher short-term interest rates, long-term US interest rates will be capped by the spillover effect of the European Central Bank’s quantitative easing.
The ECB is in the early stages of its aggressive quantitative easing, slated to continue through September 2016. The ECB’s monthly €60 billion purchase of European sovereign bonds unleashes a large amount of liquidity into the European and global financial markets, placing downward pressure on European and global bond yields. The Bank of Japan’s monetary policies are also likely to continue supporting low interest rates and easy financial conditions.
By 2018, however, we expect the Fed to raise interest rates toward their normal levels and begin significantly reducing the size of its balance sheet. With the ECB also poised to end its aggressive quantitative easing by the end of 2016, we expect to see higher interest rates in Europe, the US, Canada and Australia. As interest rates in developed countries move closer to traditional levels, we expect to see moderate corrections in equity valuations in the developed economies in 2018.
THREE DRIVERS OF M&A AND IPO ACTIVITY
CYCLICAL TRENDS: Macroeconomic and financial variables such as GDP growth, equity prices, and interest rates that determine whether transactional activity is going to rise or decline in a given year.
STRUCTURAL FACTORS: Issues such as the legal and regulatory environment within a country, property rights protection, connectedness with the global economy, political stability, and financial depth that help explain why transactional activity is higher in one country than another. If a country implements significant economic reforms, it can lead to a sustained increase in transactions.
BUSINESS SENTIMENT: Strategies and attitudes of CEOs that are hard to observe in economic and financial aggregates, but can have a significant impact on transactional activity. We use information on announced deals and our own judgment to reflect these in our short-term forecasts, but medium-term projections are based more heavily on economic, political, and regulatory indicators.
Using a weighted average of 10 of these cyclical and structural drivers, we created a ranking of 37 countries based on the attractiveness of their current environment for M&A and IPO activity. See page 35 for our transaction Attractiveness Indicator.
TREND 2: NORMALIZING OF BUSINESS CONDITIONS
Bolstered by supportive monetary policy and advances in repairing household, corporate, and government balance sheets, business conditions will start to normalize over the next two years. The uptick in economic growth will translate into increased consumer demand for the goods and services of companies, which should boost equity prices and business confidence.
Concurrently, we expect a moderate rise in inflation in Europe, Japan, and the US. This rise in inflation should provide companies with pricing power that, along with increased demand, will boost revenue growth. Corporate operating costs should remain contained as productivity gains offset a moderate rise in labor costs. Non-labor costs are poised to rise only moderately as commodity prices increase gradually over the next several years. Profit margins will widen as revenue increases outstrip cost increases, boosting corporate earnings.
Increased demand and pricing power will boost corporate profit margins.
TREND 3: STRONG US DOLLAR
The strong US dollar is helping to balance global growth, particularly between the US and Europe and Japan. By 2017, however, the dollar’s ascent should end as the ECB curtails its quantitative easing operations by the end of 2016 and monetary support eases in Japan.
In emerging markets, the impact of a strong US dollar is more mixed. Countries that align their currencies with the US dollar, such as China and oil exporters, are losing competitiveness. Even in emerging markets with flexible exchange rate regimes, governments may need to tighten monetary conditions to manage exchange rate fluctuations, particularly in fragile economies like Turkey and Brazil.
TREND 4: CHINA’S ECONOMIC SLOWDOWN
The slowing of China’s economic growth has significant implications for overall global growth and equity markets, but it looms even larger for its neighbors in Asia Pacific. With domestic demand slowing in China and heavy capital outflows continuing, the People’s Bank of China is loosening monetary policy more decisively. However, it seems inevitable that GDP growth will continue to slow in China, falling below 7%, although we expect this to be a controlled slowdown rather than a hard landing.
Slower growth in China will affect Hong Kong via its re-export trade, trade-related services, and tourism. Hong Kong is likely to struggle as it reconfigures its service economy in response to rebalanced economic growth in China that is more dependent on domestic consumption and less dependent on exports.
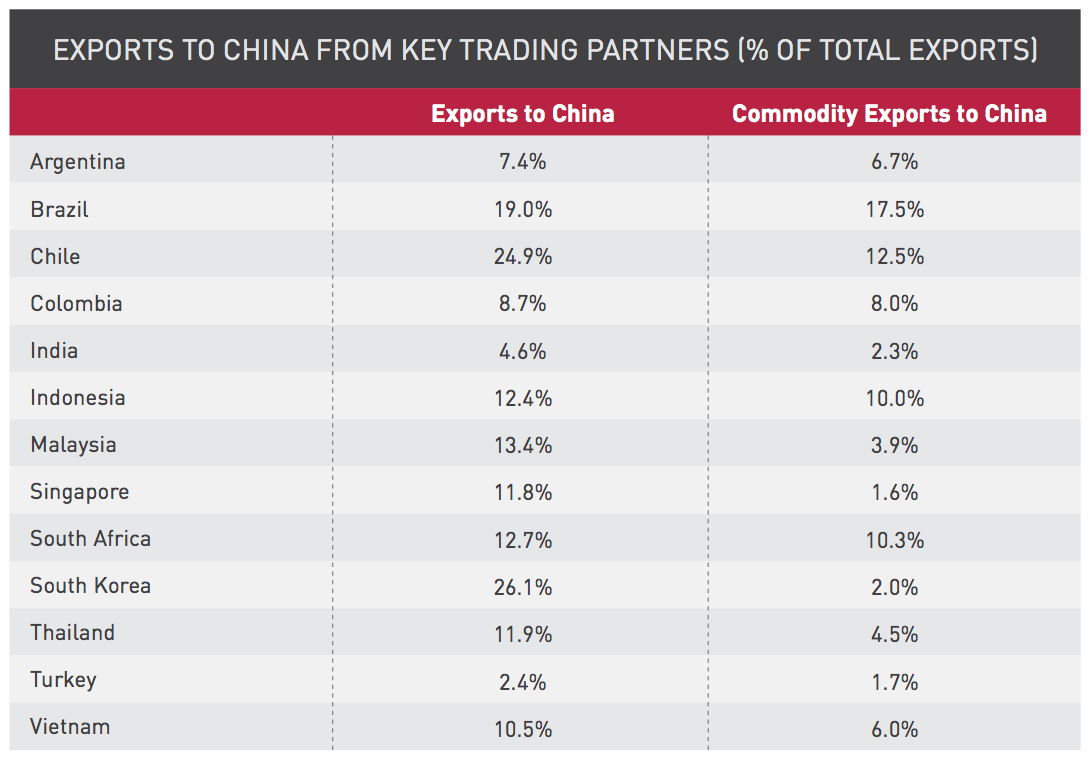
Trade linkages also mean a Chinese slowdown will continue to reverberate throughout the Asia-Pacific region. Commodity exporters like Brazil and Chile that have become dependent on demand from China will also feel ongoing repercussions.
TREND 5: LOW BUT RISING OIL PRICES
At the beginning of 2015, oil prices plummeted to US$45 per barrel from US$115 per barrel in June 2014. Despite the modest rebound since then, lower oil prices are an important economic stimulus for oil importers such as the US, Japan, Europe, China, and India.
However, the drop in oil and other commodity prices is a negative development for commodity exporters. The current oil price is below the budget breakeven price — the price needed to ensure that governments do not need to borrow — in most oil-exporting countries, including Saudi Arabia, the UAE, Nigeria, Russia and Venezuela. Although Saudi Arabia and the UAE have large foreign currency reserves and sovereign wealth funds that help mitigate the short-term impact on their economies, Nigeria, Russia and Venezuela are suffering serious repercussions.
TREND 6: STRUCTURAL REFORMS
Government policy that promotes economic growth is crucial for creating an M&A-friendly environment, and some major economies have taken positive steps in that direction. The most immediate impact of structural reform is that it can improve investor and business confidence, providing a boost to a country’s equity prices and M&A or IPO activity.
In India, for example, Prime Minister Narendra Modi’s promise to implement comprehensive reforms after his election in May 2014 sparked investor optimism, encouraging foreign portfolio inflows that underpinned the equity market. In contrast, the second term for Brazil President Dilma Rousseff and political and economic developments in Russia have contributed to poor performance in those countries’ equity markets and low transactional activity levels this year.
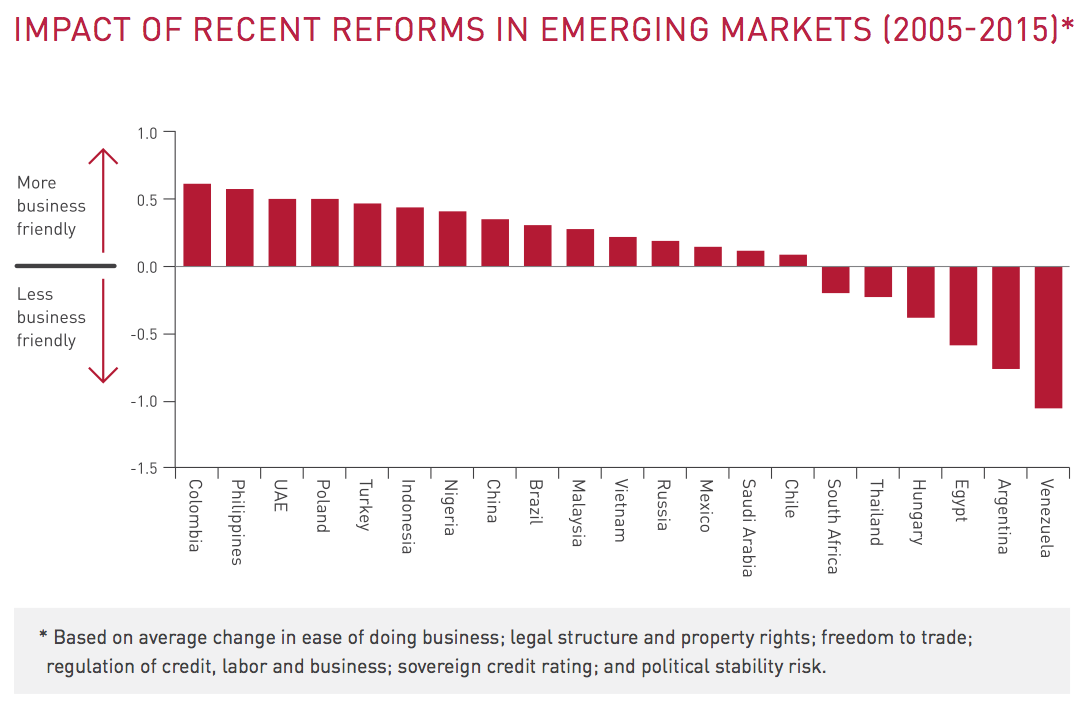
However, the larger and more lasting lift to transactional activity is registered over the long-run since it takes time to implement the reforms and realize their effects. The chart below illustrates the impact of recent reforms in emerging markets.
While economic difficulties in Venezuela and Argentina are hampering growth, other emerging countries are setting important reform agendas that could boost economic activity and increase M&A and IPO activity. Those reforms include:
The Modi government in India has reduced fuel subsidies and lifted caps on foreign investment in key sectors such as insurance, defense, and railways. It has also lowered corporate taxes and encouraged private participation in the coal sector. Mr. Modi’s “Make in India” campaign is aimed at attracting foreign investors to manufacture goods in India.
President Peña Nieto in Mexico has implemented changes to the education system that introduce standardized evaluation of public school teachers, reformed labor laws to increase hiring of young people and women, and empowered regulators to tackle monopolies in the communications sector. He has also achieved a significant reform in the energy sector by opening the state-run industry to private investors.
In Nigeria, peaceful elections have smoothed a transition to growing political maturity, although the economic policy implications remain unclear. The new government has announced plans to remove fuel subsidies and reform state-owned firms, although privatization remains slow and investment in infrastructure is sorely needed to attract more interest from the private sector. What is clearer is that president-elect Muhammadu Buhari will likely take a tougher line on Boko Haram than his predecessor, which should lead to a rebound in business confidence and foreign direct investment as concerns about terrorist attacks diminish.
In South Africa, the implementation of some of the National Development Plan reforms following elections in May 2014, even if they are watered down, should provide a moderate boost to the country’s growth and attract investment. These include improving the efficiency of the public sector by decentralizing government, recognizing public-private partnership as a viable way to fund infrastructure development, enhancing tax compliance and improving access to capital.
In Egypt, the military-backed government led by former army chief Al-Sisihas reduced political instability and made progress in turning around the economy. The government seems committed to a reform program that has already helped increase economic growth by slashing fuel subsidies, raising the tax on tobacco and alcohol, and pledging to control the public wage bill. Another key component of the government’s reforms is to attract investment by improving the business environment. This is also paying dividends, albeit with a focus on megaprojects such as doubling the capacity of the Suez Canal and building a new capital city outside of Cairo. At Egypt’s Economic Development Conference in March 2015, foreign investors pledged US$130 billion.
The table below summarizes the degree of positive or negative impact the six macroeconomic trends have across different countries. The last column represents the overall positive/negative impact across all trends.
TRANSACTIONS FORECAST
GLOBAL M&A OUTLOOK
At a global level, the value of completed M&A transactions involving both acquisitions of majority shares and partial interests rose to US$2.5 trillion in 2014, up from US$2.2 trillion in 2013. This increase reflected robust activity in both domestic and cross-border deal-making. The first half of 2015 suggests that M&A deals will continue rising, with companies announcing a flurry of large cross-border buyouts.
Our forecasts show completed global M&A transactions rising to US$2.7 trillion in 2015 before accelerating to US$3 trillion in 2016 and US$3.4 trillion in 2017. In 2015, cross-border transactions will rise to 38% of total deal activity (or US$1.03 trillion), up from 36% in 2014, before dropping slightly to 37% in 2016. In emerging markets, M&A activity will also grow, rising to 21% of total transactions in 2018 (or US$678 billion), up from 18% in 2014 (US$435 billion).
As interest rates in developed countries normalize and equity valuations moderately ease, we expect global M&A activity to slow from 2018 through 2020. But we do not expect the downturn to be as sharp as those in 2001-2002 or 2008-2009 as transactional activity is expected to remain above the strong levels established in 2014. In the current upturn, investors remain cautious about committing capital in the wake of the financial crisis, and companies find it more difficult to conduct highly leveraged deals in today’s regulatory environment, which should help avoid bubble-induced peaks and troughs.
REGIONAL M&A OUTLOOK
NORTH AMERICA: STRONG LEVELS OF ACTIVITY AHEAD
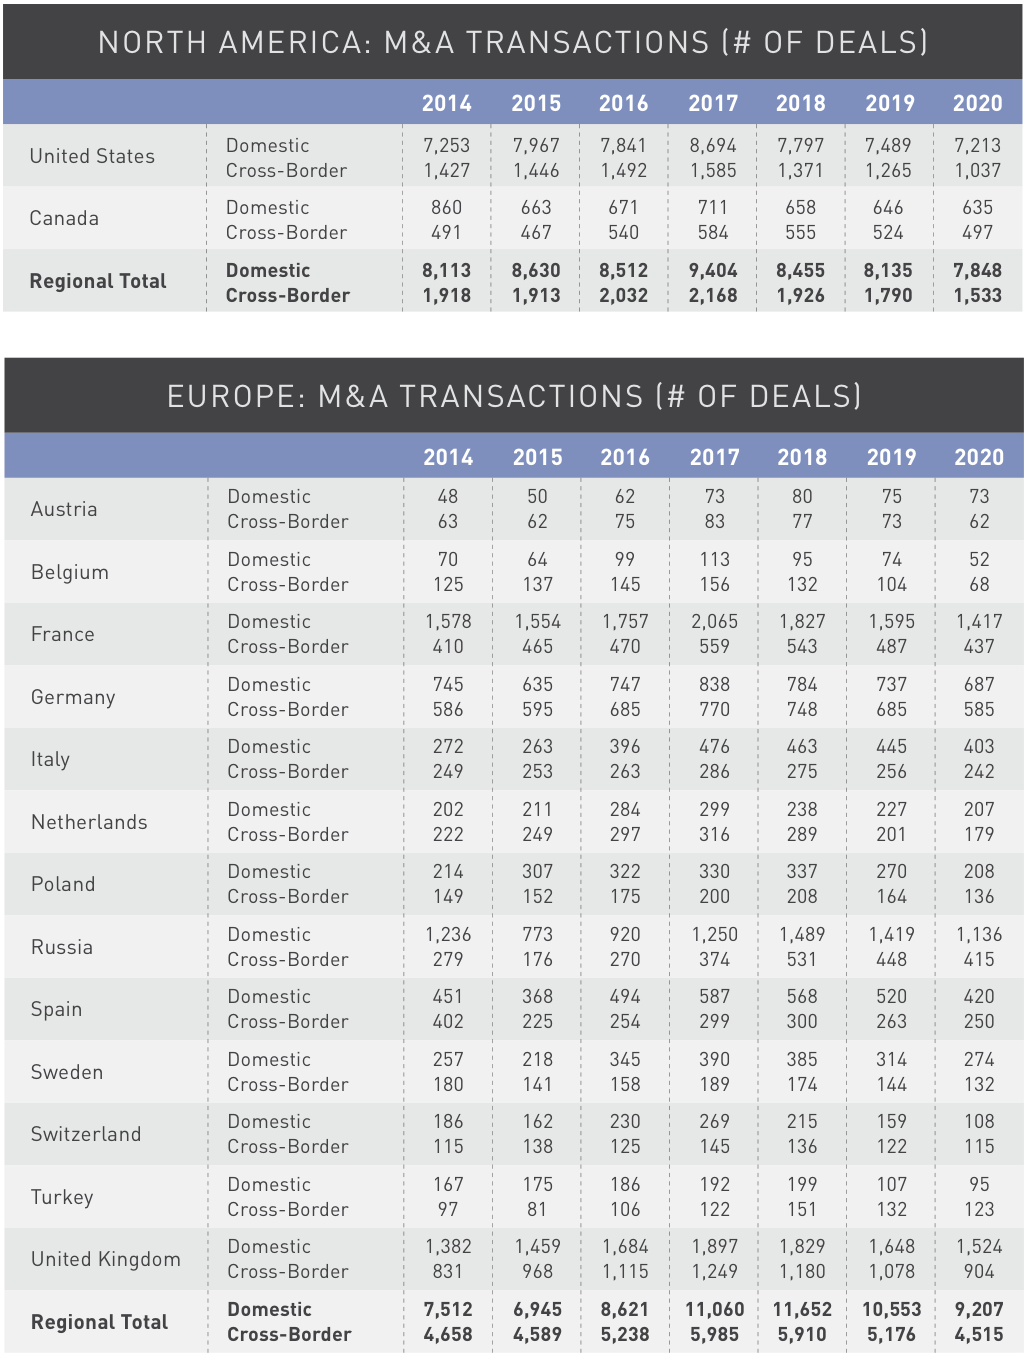
Our global M&A projections are underpinned by strong levels of activity in North America, in particular the US, which hosted 45% of global M&A transactions in 2014. Although we expect the Federal Reserve to start raising interest rates this year, this is unlikely to constrain deal-making in the near future.
Available financing and optimism about the US economic recovery should continue to support equity prices and encourage higher levels of domestic and cross-border M&A over the next few years. Our projections show M&A transactions in North America picking up from US$1.2 trillion in 2014 to a peak of US$1.5 trillion in 2017, followed by an eventual slowdown in 2018 with the expected moderate pullback in equity prices.
EUROPE: RISING M&A DEALS
The strength of the US dollar will also drive cross-border deals in the coming year. With the US exchange rate near a 12-year high relative to the euro, US companies are likely to pursue more inbound transactions in Europe, particularly in the UK, Germany, and Spain. M&A activity in several major Eurozone economies has already picked up this year, flows we expect to accelerate as the region’s economic recovery gains traction and bond yields remain relatively low.
Despite a pullback in the early months of 2015, we expect equity prices to rise over the next three years, as valuations appear less stretched than in other major developed economies, such as the US. Our projections for European M&A transactions show total deal values rising from US$621 billion in 2014 to US$698 billion in 2015. Beyond 2015, we predict that M&A transactions will continue to accelerate in Europe, hitting US$936 billion by 2017. Although transactions are forecast to moderate from 2018 to 2020 as the ECB starts to raise interest rates and equity markets fall back, deal flow should remain above 2014 levels.
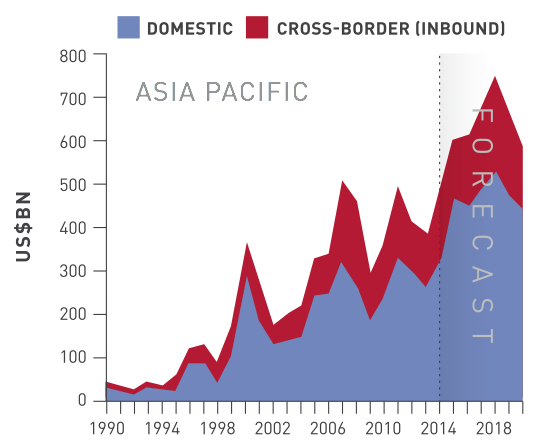
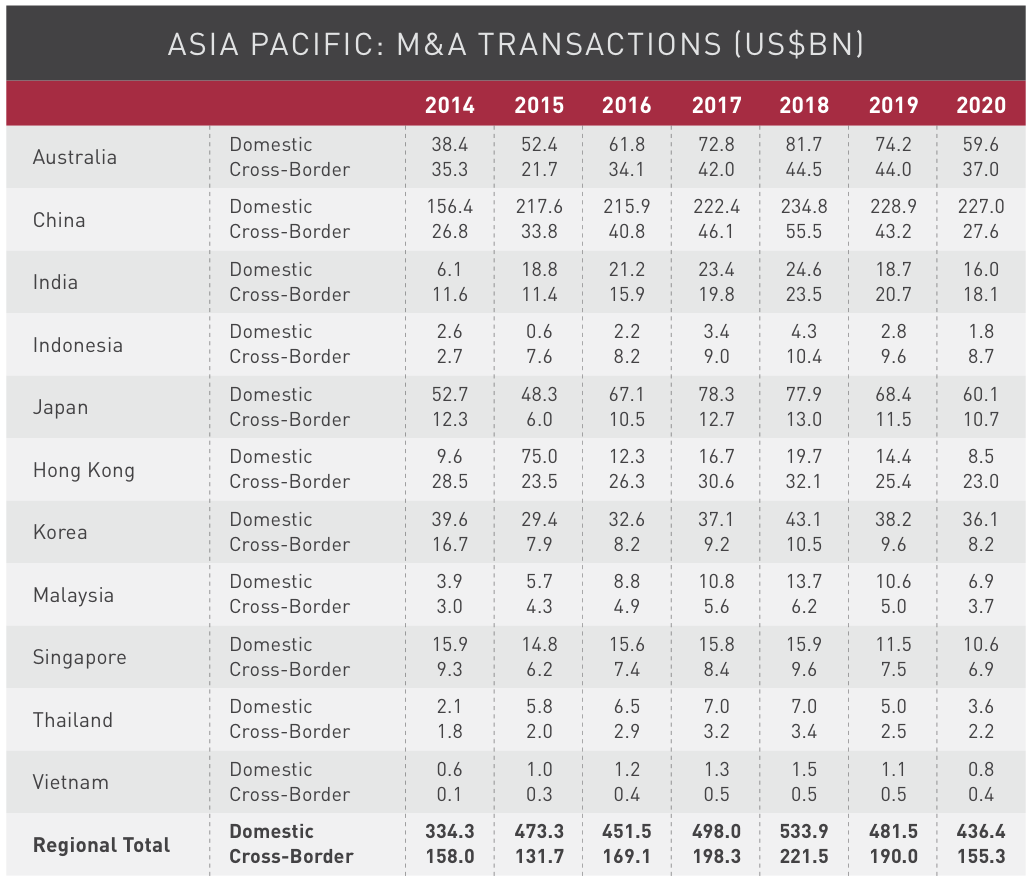
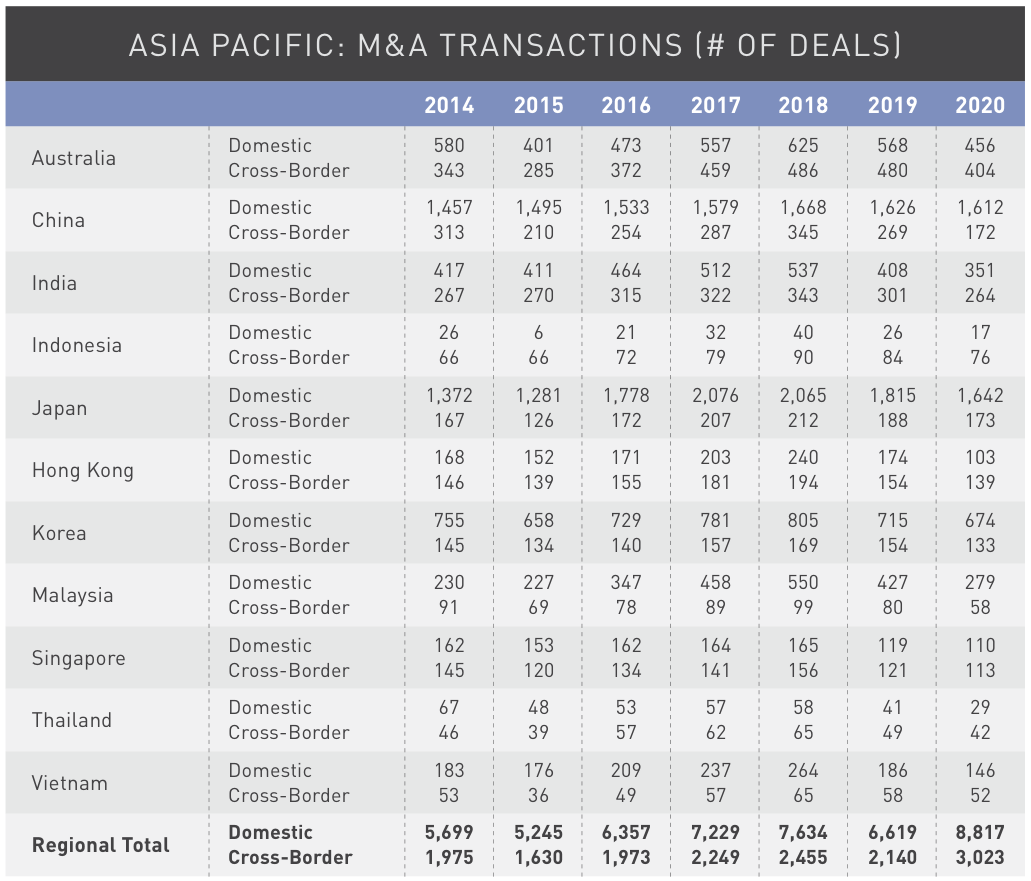
ASIA PACIFIC: RESURGENCE OF GROWTH
In the Asia-Pacific region, M&A transactions rose to US$492 billion in 2014, up from US$388 billion in 2013. With China’s neighbors struggling to adjust to its slowing growth, investor confidence in the region is likely to remain subdued as domestic activity and cross-border inflows are diverted to developed markets where growth prospects have brightened.
Despite a slowdown in China, we expect M&A transactions to pick up further this year to US$605 billion and that the strong economic fundamentals of the emerging Asia economies will help the region reassert itself as one of the world’s most dynamic growth stories next year. This will help regain investor confidence, boost stock prices and drive strong rises in transactions from 2016 to 2018.
Our forecast shows M&A activity in Asia Pacific peaking at US$755 billion in 2018, as investors shift toward this fast-growing region following the peak of activity in developed markets in 2017. But because of the global interconnectedness of stock markets, we don’t expect this shift to last. We predict that moderate corrections in developed stock markets will soften interest in deal-making worldwide by 2019.
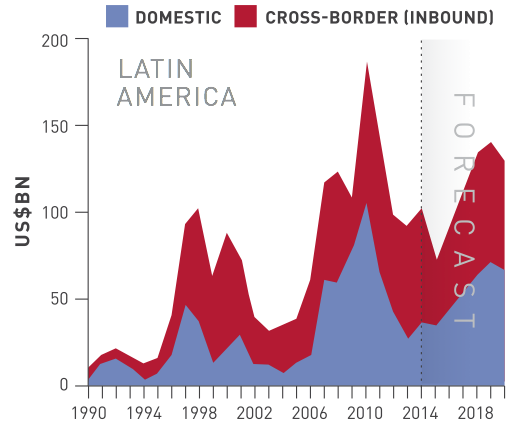
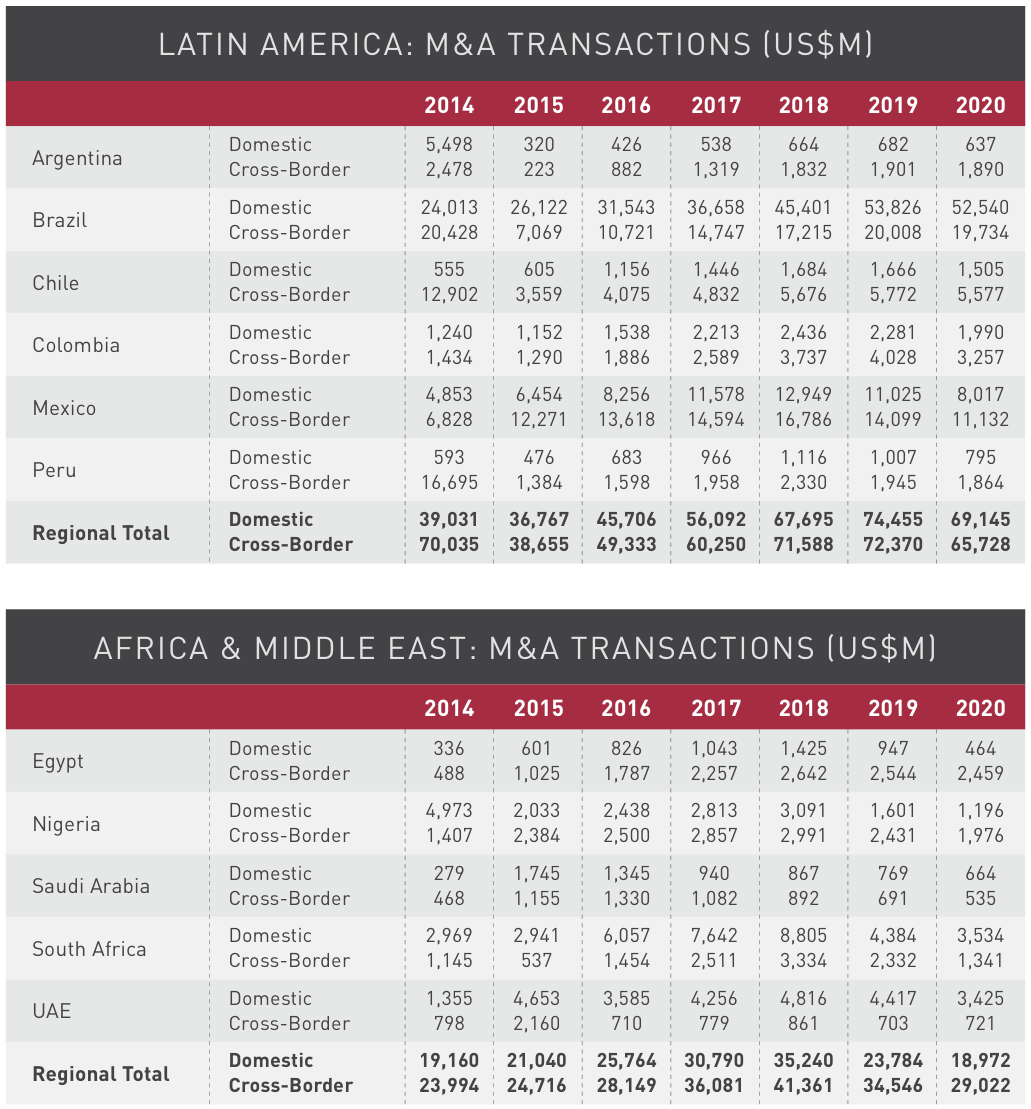
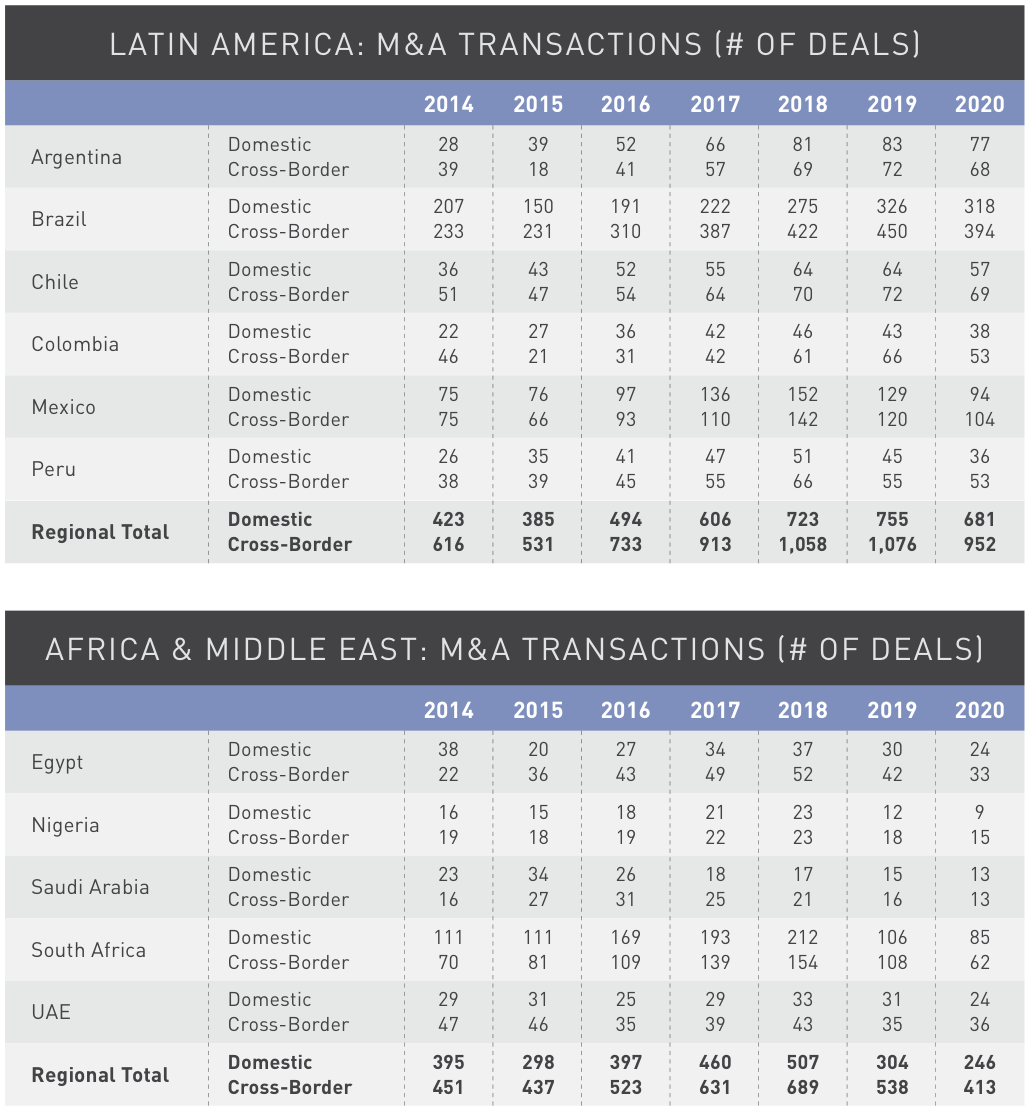
LATIN AMERICA: GRADUAL RECOVERY
While the outlook for Asia suggests a strong upturn in activity over the next three years, deal activity in Latin America will be more subdued. In 2015, we forecast that the total value of M&A transactions will fall to US$75 billion, a 61% drop from their peak in 2010, as the region struggles with structural challenges and lower commodity prices.
In particular, subdued prospects for Brazil and Mexico are dampening the outlook for M&A activity, as these countries host the bulk of the region’s transactions. Still, the economic outlook for these economies should gradually improve, with M&A activity accelerating from 2017 to 2018, reaching US$147 billion by 2019. This would represent a recovery, as it is above the average annual deal flows of US$128 billion the region had sustained from 2007 to 2014.
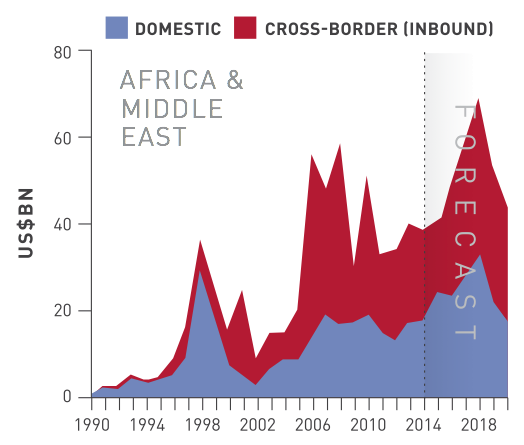
AFRICA AND MIDDLE EAST: REBOUND DEPENDENT ON RISING OIL PRICES
The Africa and Middle East region represents a small share of global transactions, amounting to just 2% in 2014. Deal activity has fallen sharply over the past few years, a drop that could continue amid low oil prices.
Despite these dampened prospects, Saudi Arabia is off to a strong start this year, driven by an increase in domestic M&A deals. The opening of the Saudi stock exchange to foreign investors could also increase cross-border activity. The decline in oil prices has made companies with significant exposure to oil and energy prices more attractive to potential acquirers, generating an upturn in transactions now that oil prices have stopped falling.
Moreover, a recovery in oil prices should stimulate deal-making in the Middle East by increasing revenues for oil-exporting countries. With countries such as Egypt experiencing greater political stability and introducing business-friendly policies, investor confidence should improve.
We expect M&A transactions to peak at US$77 billion in 2018 before slowing as part of our predicted downturn in global financial markets.
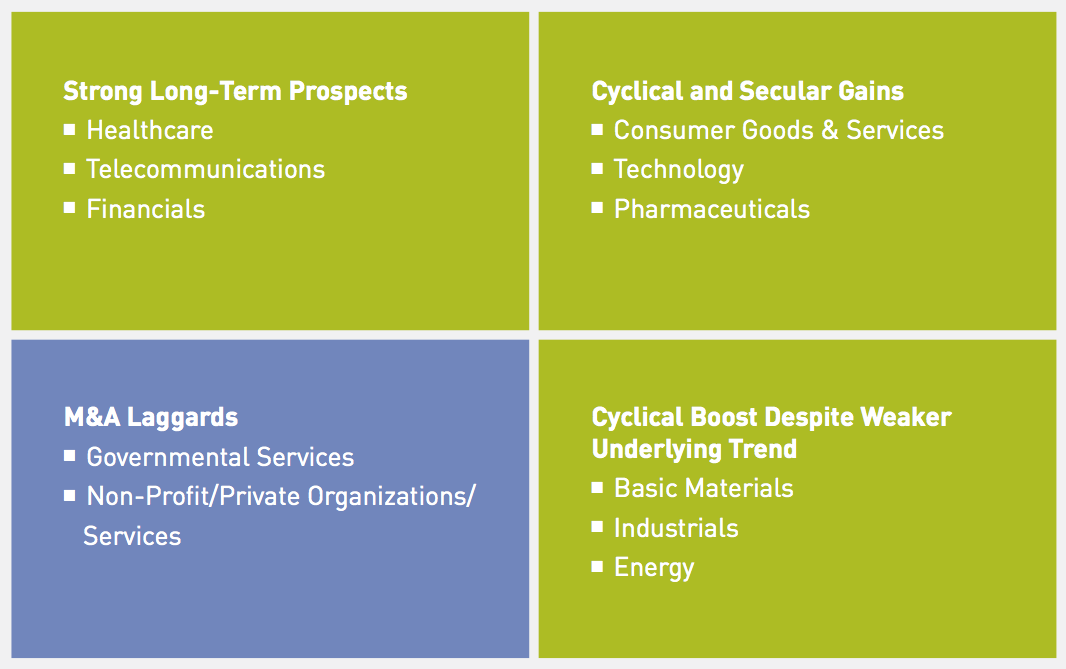
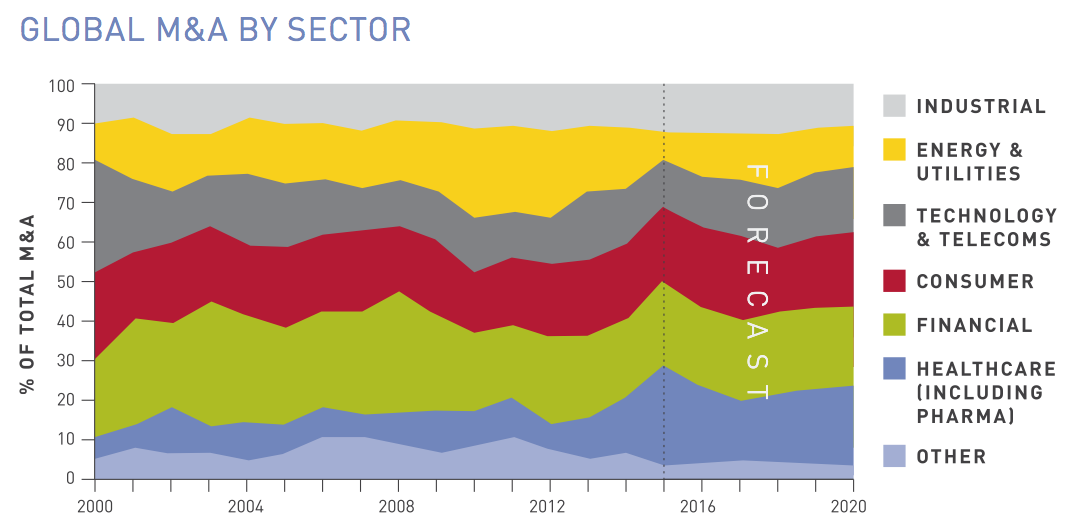
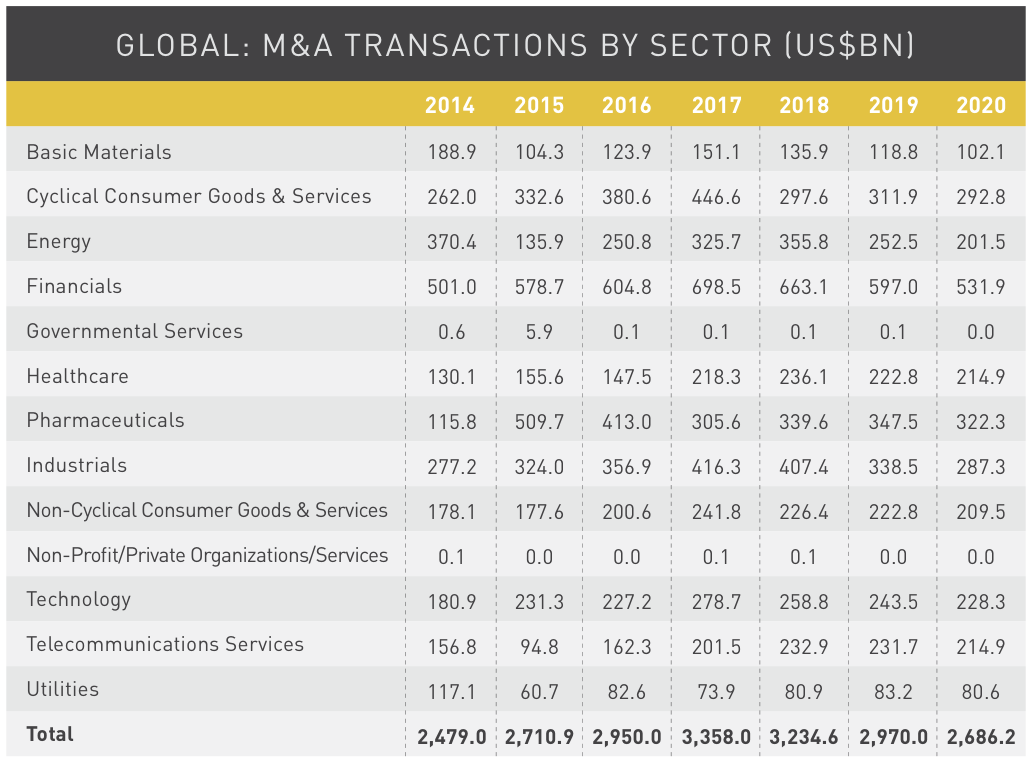
SECTOR M&A OUTLOOK
Within global M&A, sectors that tend to be more cyclical, such as industrials, basic materials and consumer goods, often experience strong growth during upswings in deal-making. Others, such as healthcare and telecommunications, have better long-term prospects that contribute to M&A growth. Our projected growth prospects for the major sectors are illustrated in the chart below.
PHARMACEUTICALS: DRIVING GLOBAL M&A
Pharmaceuticals is the primary sector driving global M&A, with an estimated US$511.7 billion in completed deals in 2015, up from $115.8 billion in 2014. Strong activity is expected to continue in 2016 as pharmaceutical companies use M&A as a key growth strategy to acquire new drugs and expand into new markets.
More broadly, M&A prospects in the healthcare sector remain strong. In the US, uncertainty about the Affordable Care Act is likely to propel healthcare companies, particularly managed-care companies, to seek acquisitions to offset potential losses. Increased demand for healthcare services from aging populations in Europe, Asia, and the US is also likely to put pressure on prices and continue fueling M&A activity within the sector.
TECHNOLOGY AND TELECOM: GOOD LONG-TERM PROSPECTS
Companies in the technology and telecommunications sector have become increasingly active players in global M&A as they are capital intensive and seek acquisitions to achieve economies of scale. The financial benefits of scaling up lead big companies to acquire new start-ups as well as merge with large competitors. The rapid convergence of mobile and fixed-line phone services with cable and other television providers, along with increased regulation and intense competition, are also driving M&A in this sector.
Innovations in mobile payments system, data analytics, and cloud computing create the need for new intellectual property and talent that many companies can access quickest and easiest through acquisitions. In telecom, machine-to-machine operations are increasingly used to drive the rapid rise in connectivity across different devices, prompting telecom companies to merge with and acquire companies in other sectors. As data protection and cyber security become even greater corporate concerns, the need for better IT systems should also boost M&A activity.
CONSUMER GOODS AND SERVICES: STRONG GROWTH AHEAD
Macro fundamentals for the consumer goods and services sector are strengthening in key countries like the US where consumer confidence is on the upswing, corporate balance sheets have improved since the recession, and wages are rising. These stronger consumer fundamentals should drive increased spending, which bodes well for M&A. Cross-border deals should also rise as consumer goods companies look to tap growing middle classes in emerging markets.
At the same time, US brands and the country’s large consumer base will remain attractive to foreign multinational consumer companies. Other factors, such as a global acceleration of urbanization and demographic shifts, should also fuel M&A in this sector, as well as consolidation within the food and beverage industry.
ENERGY: A WAVE OF CONSOLIDATION
Although the drop in oil prices has helped fuel the global economic recovery, it will also lead to negative implications for energy producers, prompting a wave of consolidation in the energy sector. Consolidations should unfold over the next three years as high-cost oil producers, especially US-based hydraulic frackers that face illiquidity in rolling over their high-yield debt, are ripe for takeover.
Globally, we expect less efficient and high-cost oil producers to become vulnerable to acquisition as they strive to compete in an industry in which innovation is keeping oil prices low. The quest for geographic expansion and the need for new technologies and services will also drive M&A activity.
INDUSTRIAL MANUFACTURING: M&A ACTIVITY IN CHINA AND EMERGING MARKETS
M&A activity in the industrial manufacturing sector should rise over the next three years as commodity prices rebound and the US dollar remains strong. Ongoing regional consolidation among smaller, specialized companies is also likely to drive transactions. Much of the deal activity in this sector will occur in China and other emerging economies as local manufacturers seek to reduce excess capacity as economic growth slows. The restructuring and rebalancing of the Chinese economy should also generate a rise in transactions as the government continues to privatize state-owned enterprises, offsetting the negative impact of China’s slower economy.
We anticipate that large manufacturing companies will continue shedding non-core operations, freeing up capital to acquire other high-quality manufacturers to expand their consumer bases. The next wave of innovation, including advancements in automation, robotics and nanotechnology, should also spur acquisitions aimed at cost cutting and market entry.
FINANCE: GRADUAL RECOVERY
In the five years leading up to the global economic crisis in 2007, M&A in the financial sector accounted for over 25% of total M&A, or US$600 billion annually. Since then, that share has dropped to 20%, to US$480 billion per year from 2009 to 2014. In the next three years, we expect M&A activity in the global banking sector to rebound, driven by increased regulation and capital requirements that will force banks to sell off their non-core businesses.
As central banks gradually tighten monetary policy, short-term interest rates will rise faster than long-term rates, creating a flatter yield curve. The flatter yield curve will compress banks’ interest rate margins, as they tend to borrow short and lend long. The downward pressure on profit margins should spur additional M&A activity as banks seek other avenues for revenue growth. Banks will also likely pursue acquisitions to expand their customer bases. For similar reasons, insurance companies also appear ripe for consolidation.
IPO OUTLOOK
The outlook for domestic IPO transactions follows a similar pattern to M&A transactions, reflecting their shared fundamental drivers. Regulatory changes, particularly pension reforms that encourage funds to diversify out of bonds into equities, should continue to encourage firms to raise capital on equity markets.
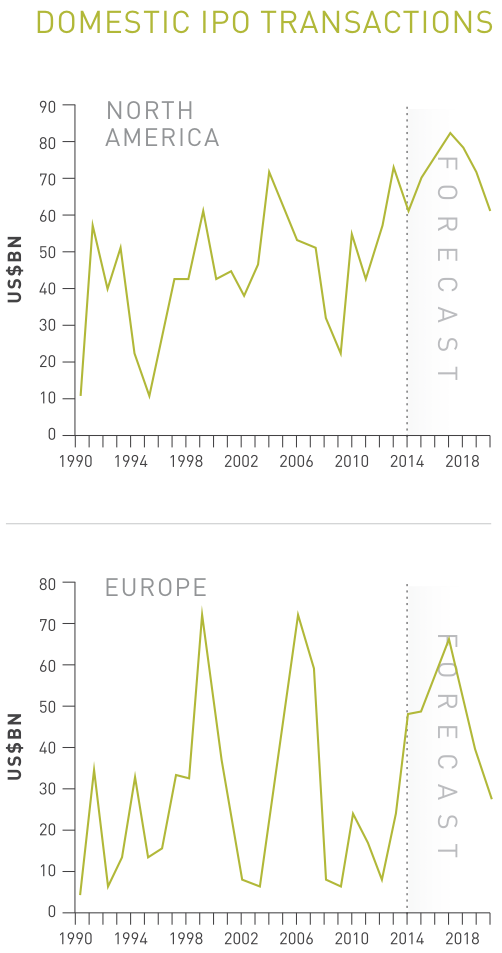
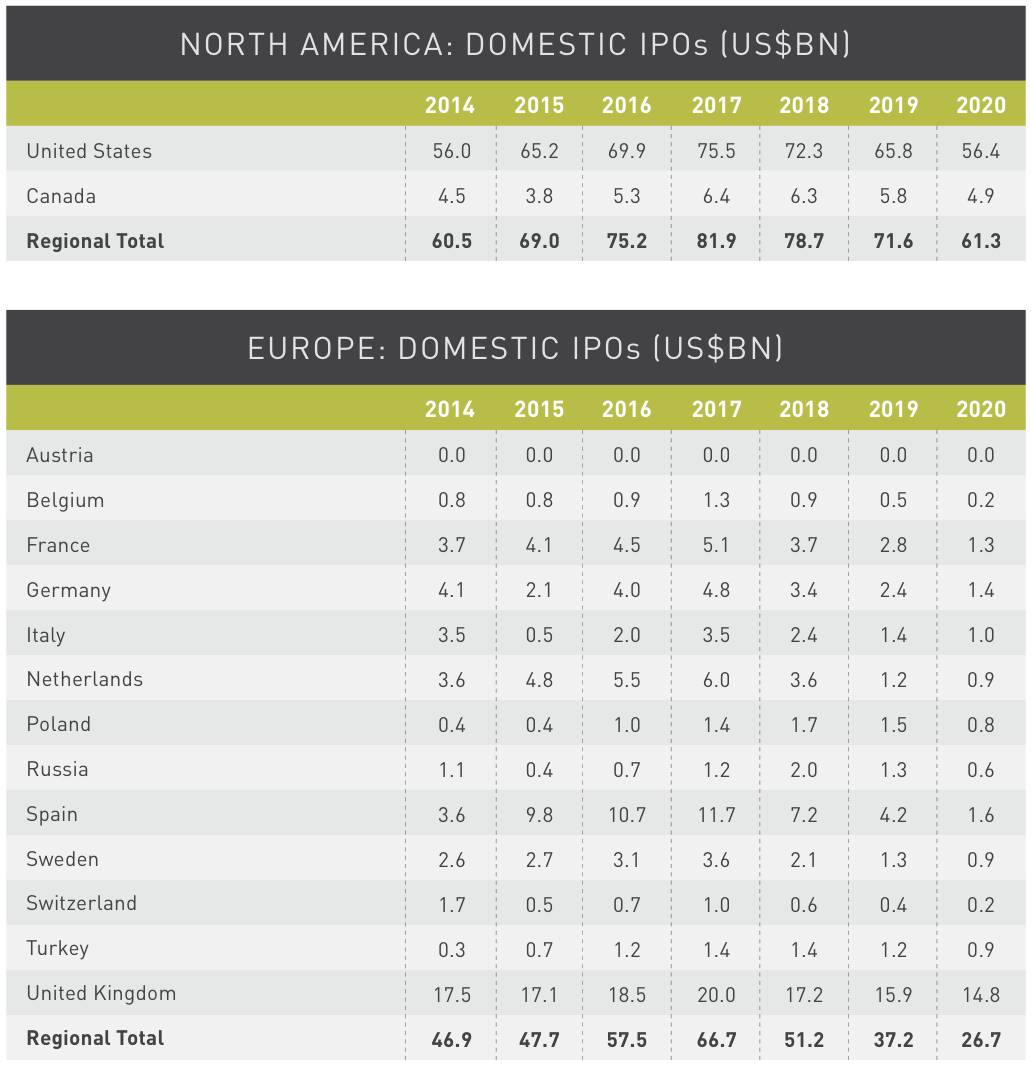
DOMESTIC IPO TRANSACTIONS
In North America, domestic IPO activity dipped to US$60.5 billion last year, which was expected following the record US$73.6 billion raised in 2013. We predict that IPO activity will recover this year as market volatility remains low, corporate confidence grows and stock markets rise, pushing toward a new record of US$82 billion by 2017.
In Europe, domestic IPOs bounced back in 2014 for the first time since the global economic crisis, raising a total of US$46.9 billion, partly because of pent-up demand in the UK. Although the upward trajectory of IPOs may slow this year because of the recent pullback in stock prices and uncertainty surrounding parliamentary elections in several European countries, we expect IPO activity in Europe to rebound next year, pushing the amount raised on stock markets to US$67 billion by 2017.
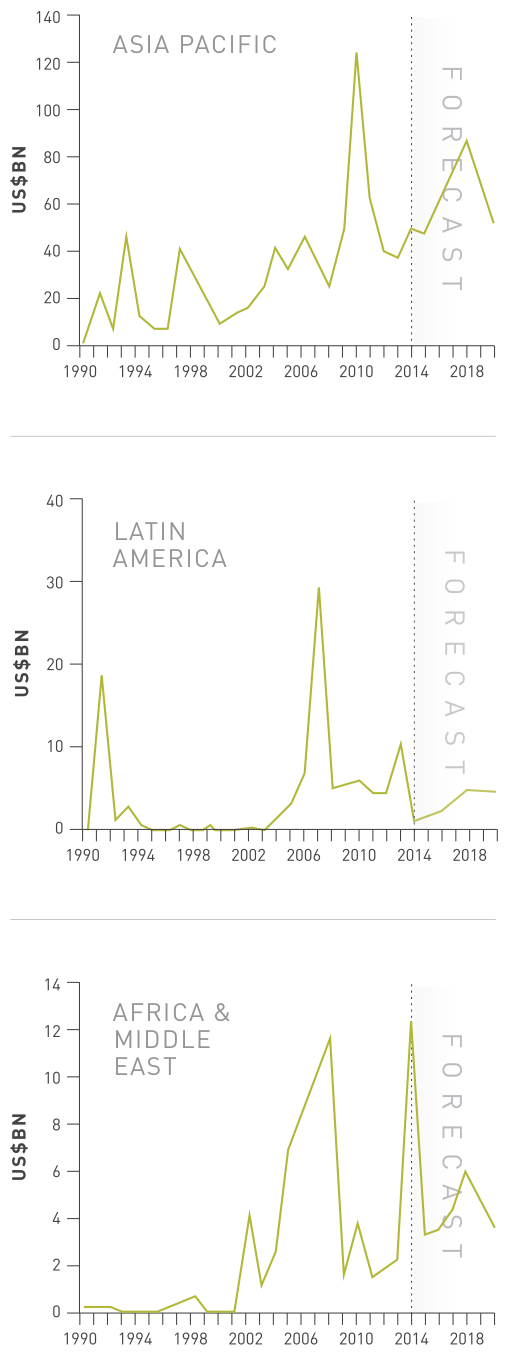
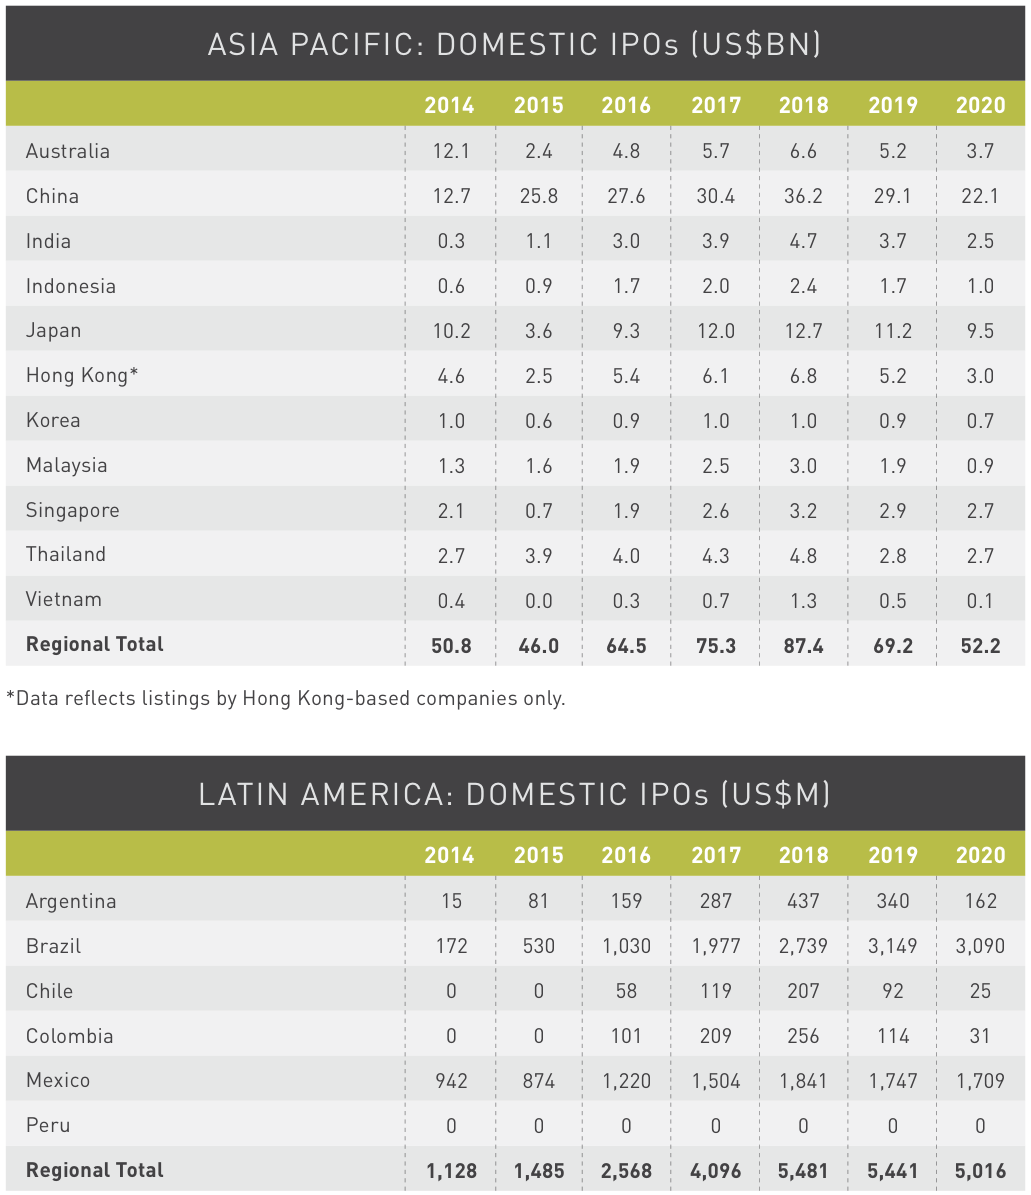
In Asia Pacific, domestic IPO activity rose to US$50.8 billion in 2014 from US$37.5 billion in 2013. This was led by strong gains in Australia, Hong Kong and Japan, as activity in other markets within the region remained subdued. IPO activity is likely to remain at similar levels in 2015 before picking up as the regional economy accelerates and companies seek to raise captial on domestic markets to appeal to the local middle class. Driven by these factors, we expect IPO activity to peak at US$87.4 billion in 2018.
Domestic IPO activity in Latin America fell sharply last year amid a downturn in the region’s main economies and a drop in commodity prices. In 2014, only US$1.1 billion in capital was raised on the region’s stock markets, the lowest annual listing value since 2003. We expect IPO activity to remain at depressed levels this year, with a modest acceleration to US$5.5 billion by 2018 as economic prospects brighten.
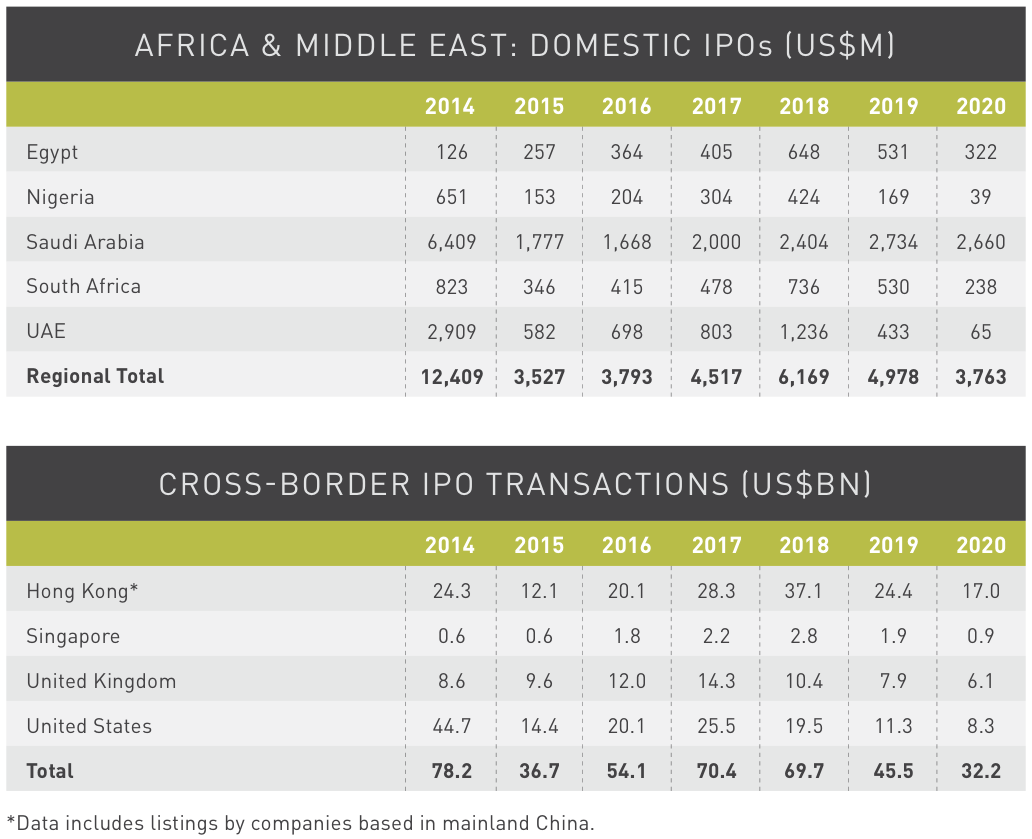
In Africa and the Middle East, domestic IPO activity surged to an all-time high of US$12.4 billion in 2014. This jump was driven by National Commercial Bank’s listing in Saudi Arabia, which raised US$6.4 billion in capital. Because of the one-off nature of this event, we expect IPO activity in Saudi Arabia to return to normal levels this year, although the Saudi stock exchange just opened to foreign investors, which could generate more cross-border flows. In the overall region, we expect domestic listings to generate US$3.5 billion in capital in 2015, climbing to US$6.2 billion by 2018.
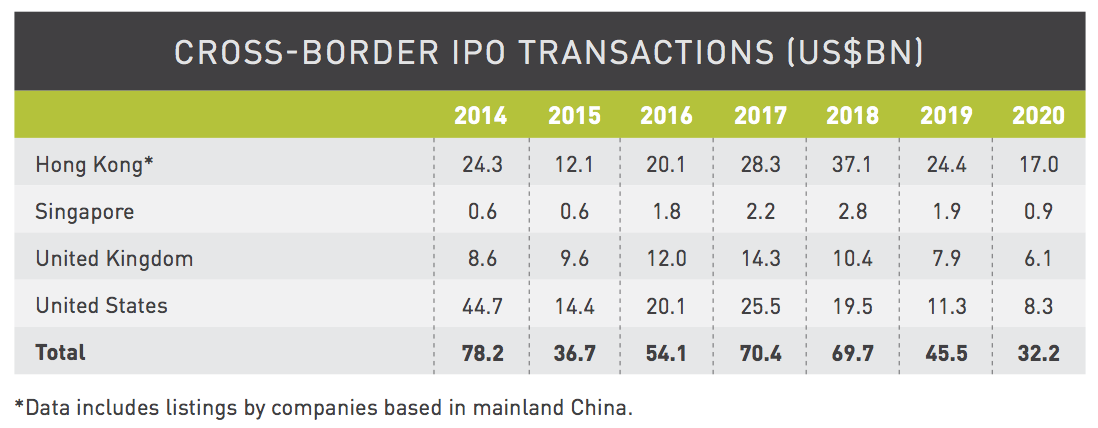
Companies from emerging markets have been major drivers of cross-border IPO activity on the major exchanges. The US market, for example, had a strong year in 2014 led by Chinese retail group Alibaba’s listing on the NY Stock Exchange, which raised US$25 billion, becoming the largest IPO in history. Hong Kong, now the world’s second most popular venue for IPOs, has also hosted large cross-border listings from Chinese companies. Those include Huatai Securities Co. for US$4.5 billion and GF Securities for US$4.1 billion — the world’s second- and third-largest IPOs in 2015 so far.
Our forecasts for cross-border M&A suggest that IPO growth in the US and UK will peak in 2017, while the upswing in IPOs will extend into 2018 for the Hong Kong and Singapore markets. The launch of the Shanghai-Hong Kong Connect in November 2014 should boost that upswing.
IPO growth in the US and UK will peak in 2017, extending into 2018 for the Hong Kong and Singapore markets.
POTENTIAL RISKS
The recovery in global transactions is expected to continue over the next few years as global economic growth strengthens, commodity prices rebound, and monetary conditions tighten gradually.
However, it’s important to note the economic and geopolitical risks that could threaten our forecast by disrupting the nascent global recovery and causing a drop in transactional activity, such as investor fatigue as we get further into the IPO cycle and increasing unrest in the Middle East. Other potential risks include:
GREEK EXIT FROM THE EUROZONE
The rising probability of a GRexit presents a substantial risk to our positive M&A and IPO outlook for the Eurozone. A Eurozone recession and the uncertainty that a Greek exit creates would likely lower European equity prices, place upward pressure on bond yields for the periphery countries, dampen business confidence and investment, and depress M&A and IPO transactions in Europe.
CHINA INVESTMENT STANDSTILL
The Chinese authorities are engaged in a tricky balancing act of trying to maintain strong growth while dealing with financial imbalances and an overheated property market. The increase in total debt from 176% of GDP in 2007 to 264% of GDP by 2014 illustrates the government’s challenge in maneuvering the economy onto a more sustainable path. Investment could quickly collapse if financial stress erupts, resulting in GDP growth falling below 4%. In such a scenario, Chinese outbound transactions activity would fall sharply, hitting financial activity throughout the Asia-Pacific region, particularly in Hong Kong.
FEDERAL RESERVE RAISES RATES FASTER AND HIGHER THAN EXPECTED
Economic growth could accelerate much faster than forecast if the US housing market finally rebounds and consumer spending accelerates. As a result, inflation would rise faster than the Federal Reserve currently predicts and it could engineer a quicker, stronger monetary tightening than expected. This would produce a sharp rise in US bond yields, and significant volatility and disruptions in US equity markets that would ripple across the globe. The financial stresses would be particularly acute in emerging markets, especially those with weak external positions such as Turkey and Brazil, where interest rates would rise sharply to prevent the currency from collapsing, dampening domestic economic and transactional activity.
UK EXIT FROM THE EUROPEAN UNION
Following the Conservative’s election victory in May, a referendum on EU membership will likely take place in the UK by 2017. The uncertainty surrounding a possible exit from the EU could cap M&A and IPO activity in the build up to the referendum in sectors closely tied to the rest of the European market. That said, to the extent that the UK government can negotiate more favorable arrangements for the UK’s EU membership, the outcome could be a net positive for the local economy. And although UK withdrawal from the EU poses obvious risks, if Brexit was followed by the establishment of London as a deregulated, free-trade hub, it could enhance the UK’s position as a center for corporate activity.
CONCLUDING REMARKS
In the next three years, we expect the recovery in global transactions to continue as global economic growth strengthens, monetary policy remains accommodative and commodity prices rebound.
During that time frame, we predict that transactional activity will continue to rise, peaking in 2017 in developed countries and 2018 in emerging markets before a moderate slowdown. Within the mix, global M&A deals will account for the bulk of transactional activity, rising to US$2.7 trillion in 2015 and peaking at US$3.4 trillion in 2017.
After equity markets in developed economies peak in 2017, the M&A spigot is likely to tighten, leading to a slowdown in the flow of deals from 2018 onward. Global IPO activity will follow a similar pattern, totaling US$214 billion in 2015 and climbing to US$322 billion in 2017 before trending lower beginning in 2018.
Global M&A activity will continue to be powered by strong levels of activity in North America, particularly in the US, which should continue accounting for 45% of global M&A deals by value over the next three years. In Europe, we expect significant growth in equity prices despite a weak start to 2015 as the economy stabilizes and the weaker euro makes European equities attractive to overseas investors.
The re-emergence of dynamic economic growth in Asia should spur an upturn in M&A and IPO activity in 2016 through 2018. Cross-border transactions will play a significant role as companies look to gain market presence in these rapidly expanding markets.
Deal activity in Latin America will be much slower to recover, weighed down by structural economic challenges in Brazil. Mexico offers a brighter outlook as the government has implemented key reforms to its education system, labor markets, and energy sector.
Rising oil prices should revitalize M&A and IPO activity in Africa and the Middle East. In Africa, rising transactional activity will also depend on whether governments continue implementing economic reforms such as those in Egypt, which has become more business friendly.
As for business sectors, pharmaceuticals and healthcare should remain leading drivers of global transactions as aging demographics in major countries and the demand for new drugs fuel deal-making. We expect transactional activity in the consumer goods and technology & telecoms to also remain strong in the next three years, along with ongoing consolidation in the energy and financial sectors.
In general, cross-border M&A activity will outpace domestic deals, rising to 38% of total transactions in 2015, up from 36% last year. Cross-border M&A will dip slightly in 2016, but rebound to 38% by 2017. In emerging markets, M&A activity will also pick up in the next few years, rising to 21% of total transactions by 2018, up from 18% in 2014.
APPENDIX
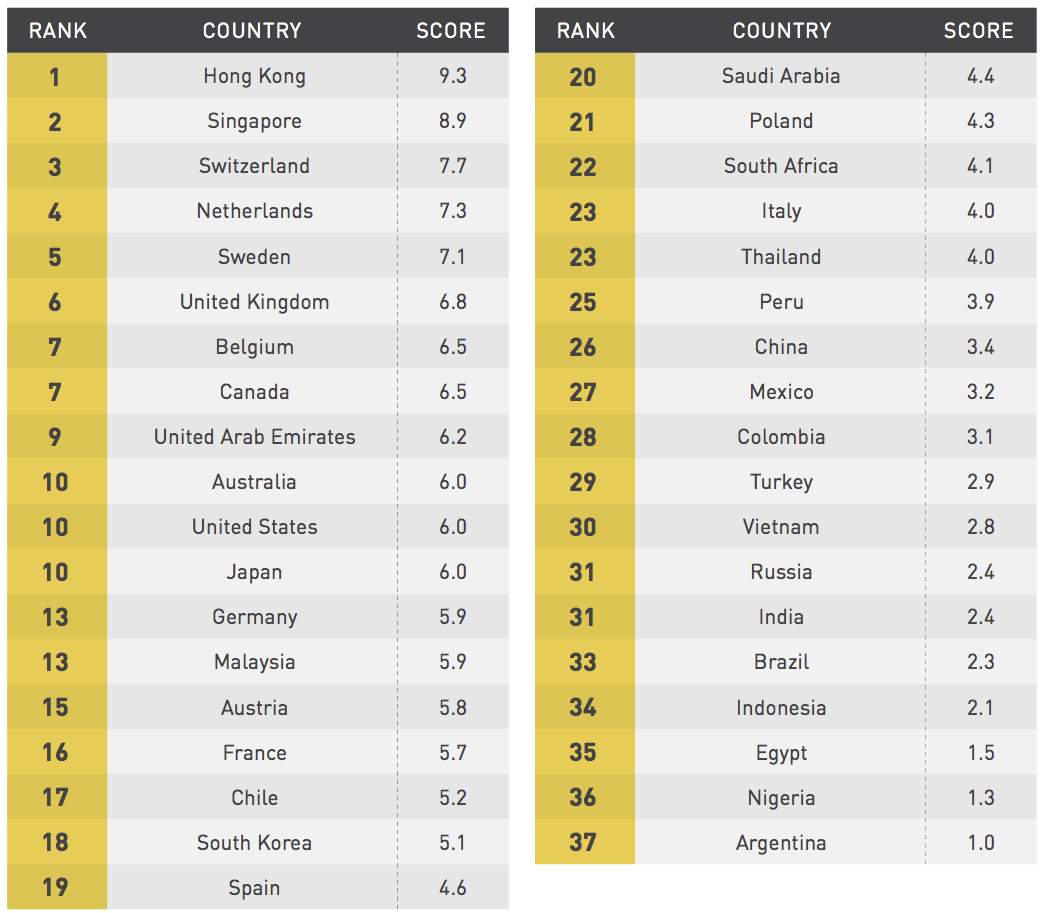
APPENDIX A: TRANSACTION ATTRACTIVENESS INDICATOR
In addition to our M&A and IPO forecast, we created a Transaction Attractiveness Indicator that rates the attractiveness of a country’s current environment for M&A and IPO activity on a scale from 0 to 10. That score is based on a weighted average of 10 key economic, financial and regulatory factors that are typically associated with higher M&A and IPO activity.
Those key factors include the country’s economic growth, stock market size, size of the economy, openness to trade, sovereign credit risk, political stability, ease of doing business, legal structure, freedom to trade, and business regulation. Because many of these factors change slowly over time, a country’s current score is a strong indicator of whether it will have the right features to attract transactional activity in the future. The chart below ranks 37 countries based on their Transaction Attractiveness Indicator scores.
APPENDIX B: COUNTRY FORECASTS


Stay up to date with M&A news!
Subscribe to our newsletter