Abstract
This case provides students the opportunity to apply strategic variance analysis (SVA) methodology in analyzing the performance changes realized in an airline merger. The U.S. Airways–America West merger provides an example of a complex, strategic action that simultaneously impacts firm size, unit pricing and costs, efficiency, and capacity for the combining airlines. This merger provides a rich example for the analysis since it combines U.S. Airways, a higher cost network airline that is geographically focused on the Eastern U.S., with America West, a low cost airline operating primarily along the Western U.S. The case includes merger and acquisition (M&A) theory discussing market power vs. efficiency motives for mergers and discusses the role of the U.S. Department of Justice and Federal Trade Commission in evaluating M&As and their impact on markets. The case asks students to serve as consultants applying the SVA methodology to the past U.S. Airways–America West merger and provide conclusions.
1. Introduction
In 2005, the U.S. Airways merger combined U.S. Airways and America West Airlines into the new U.S. Airways. This followed several acquisitions made by other large domestic airlines operating in the U.S. market, including American Airlines and Delta. The U.S. Airways acquisition aimed to strengthen its position relative to the large U.S. network airlines (Delta, United, American, etc.) and low-cost airlines (Southwest, Jet Blue, etc.). In the years following the U.S. Airways merger, Delta Airlines acquired Northwest Airlines. United Airlines broke off negotiations with Continental Airlines, entered discussions with U.S. Airways, and eventually returned to negotiations with Continental. On May 3, 2010, United announced its merger with Continental Airlines.
As the industry continued to change and consolidate, speculation about a combination between U.S. Airways and bankrupt American Airlines grew, leading investors to question how the previous merger between U.S. Airways and America West affected growth, pricing, efficiency and capacity in U.S. Airways’ post-merger operations. Questions raised included: (i) how did the U.S. Airways–America West merger affect its operating performance? (ii) to what degree were the changes in operating performance driven by growth, changes in pricing or input costs, productivity, or managing capacity? and (iii) did these changes in operating performance match synergies predicted by theories of efficiency and market power or U.S. Airways’ management?
2. The U.S. Airline Industry
2.1. Industry conditions
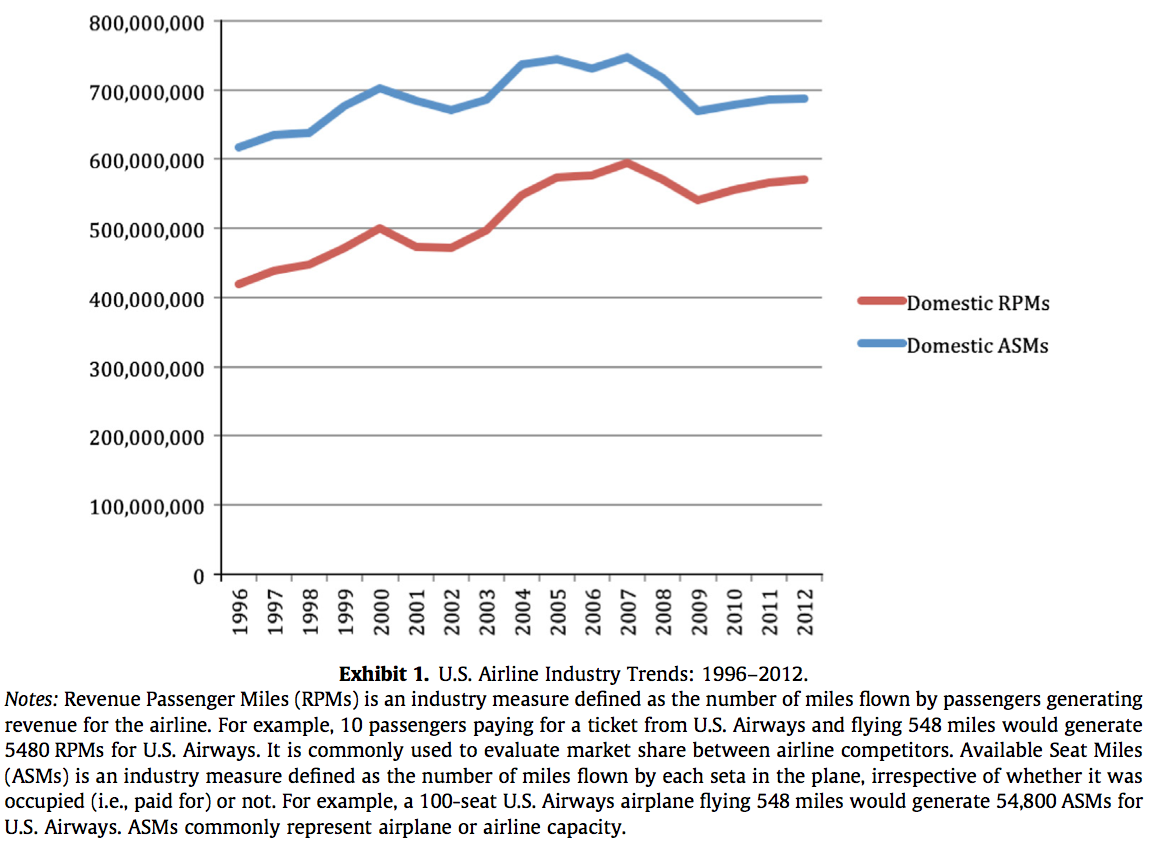
The 1990s were good years for the U.S. Airline Industry. Growth in passenger traffic and airline profitability was generally favorable. However, conditions in the industry changed dramatically with the 9–11 attacks in 2001. Demand for airline tickets dropped significantly (see Exhibit 1). Airlines with high fixed costs, particularly the large network airlines (American, Delta, United…), experienced declining margins. Variable costs associated with fuel expense and labor costs were also putting pressure on margins.
Competitive action was also changing the industry. Many airlines looked to restructuring (including bankruptcy) and mergers and acquisitions as ways of returning to profitability. For example, American Airlines acquired Reno Air in 1998 and TWA in 2001. Delta and United launched low-cost subsidiaries aimed at competing with the growth of Southwest and Jet Blue. The recent acquisition of Northwest Airlines by Delta and the merger of United and Continental reduced the number of large competitors in the industry and put pressure on U.S. Airways and American Airlines to follow the consolidation trend.
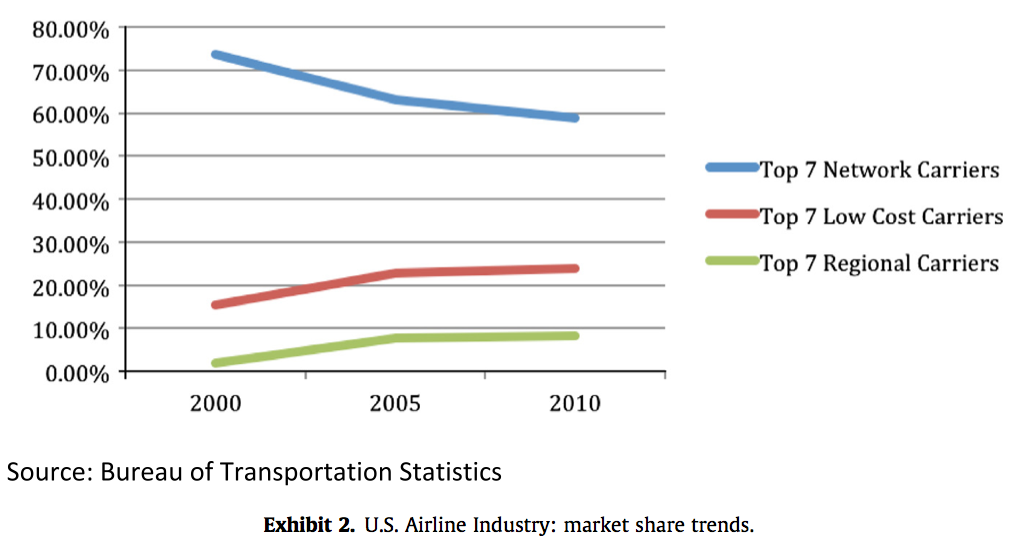
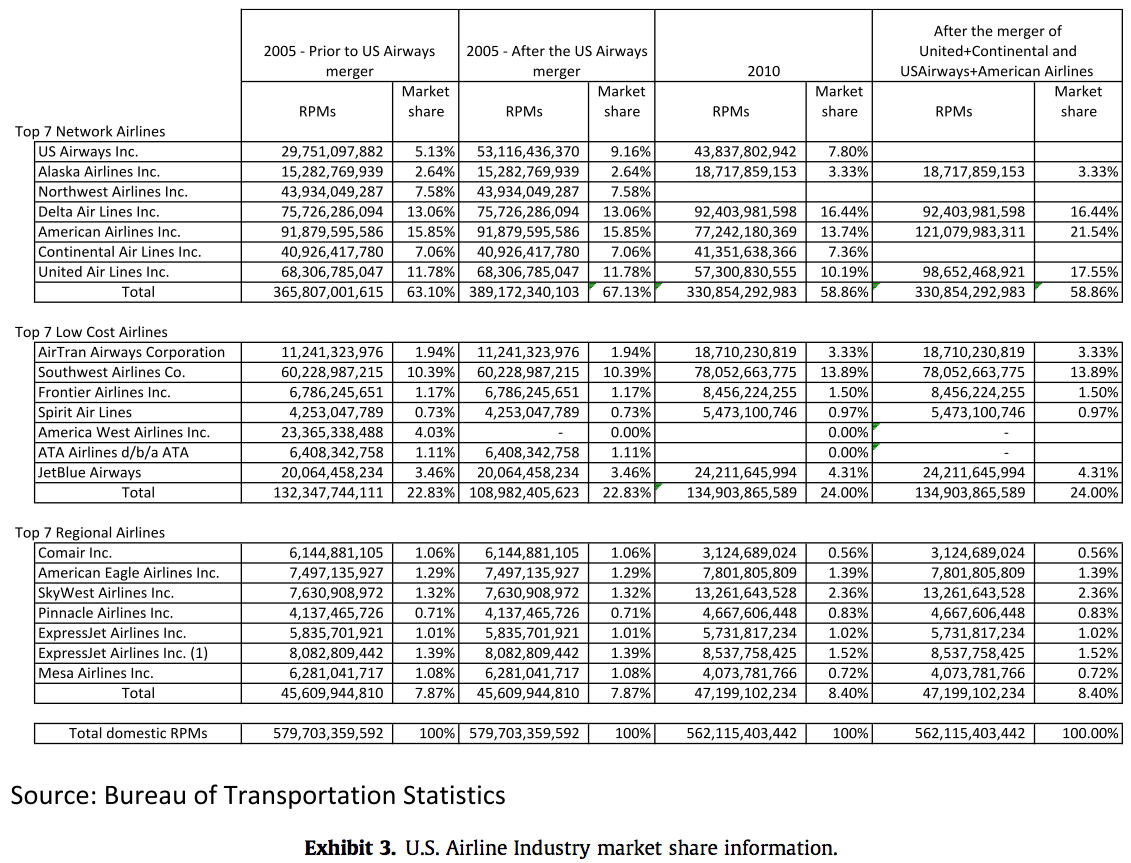
Three groups of competitors formed within the airline industry: network airlines operating hub- and-spoke routes across the U.S. market, low-cost airlines operating point-to-point routes typically from secondary airports in metropolitan markets servicing vacation travelers, and regional, commuter airlines affiliated with large network airlines operating short flights into the larger airline’s hubs. Profits varied widely across the industry, but low-cost and commuter airlines tended to have stronger financial performance than the major network airlines. Aggressive pricing also allowed the low-cost and regional airlines to take market share from the network airlines (see Exhibits 2 and 3).
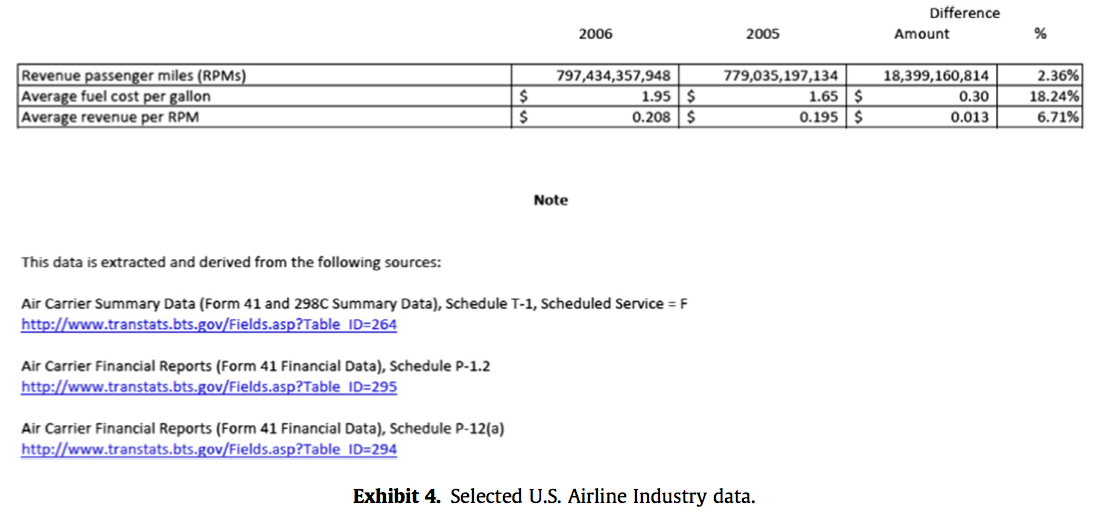
At the time of the U.S. Airways merger, the industry was experiencing a mild recovery in demand. Airlines with favorable relative costs were positioned to take advantage of emerging industry growth. The major network airlines reduced costs associated with wages and salaries, commissions paid to agents, purchased services, aircraft, landing fees, and other operating expense on a per revenues basis. For example, United Airlines reduced operating expense by over 23% of revenues between 2001 and 2005. But, fuel costs and aircraft maintenance expense increased. Exhibit 4 provides the total scheduled traffic, average fuel cost per gallon and average revenue per RPM for U.S. carriers for 2005 and 2006. Despite these improvements, network airlines were still losing money and operating at a cost disadvantage compared to low-cost airlines. Airlines still wrestling with high operating costs or weak market positions looked to horizontal acquisitions as a mechanism to strengthen their ability to compete.
In the period following the U.S. Airways merger, the industry experienced another wave of consolidation, with horizontal combinations of Delta-Northwest and United-Continental. At one time, U.S. Airways was in discussions with United Airlines about a possible merger, but the discussions ended when United shifted its attention to Continental. The consolidation of the industry continued to be driven by the poor profitability of the industry competitors. Price competition from low-cost competitors, high fixed costs, and fluctuations in variable costs such as fuels caused periodic losses for the larger airlines. As a result, many airline competitors looked to horizontal acquisitions to address the structural challenges facing the industry.
2.2. Airways (pre-merger)
U.S. Airways, created in 1939 under the name All American Aviation Company, grew via acquisitions to become one of the larger airlines in the United States. It acquired many regional airlines such as Mohawk Airlines (New York and New England), Pennsylvania Commuter Airlines (Pennsylvania), and Pacific Southwest Airlines (California) in its expansion into a national airline. Its largest acquisition occurred in 1989 when it purchased Piedmont Airlines, strengthening its position in the East Coast market. In 2000, U.S. Airways accepted a takeover offer from United Airlines, but the merger was blocked by the U.S. Justice Department.
In 2003, U.S. Airways experienced a 24% drop in revenues and posted a $174 million loss. It filed for Chapter 11 bankruptcy protection and started restructuring its debt and labor contracts. During bankruptcy, U.S. Airways announced a plan to merge with America West in 2005.
2.3. America West
America West was launched in 1981, as a low-cost regional airline operating in the southwest United States. At the time of its merger with U.S. Airways, America West operated a hub in Phoenix and Las Vegas serving over 100 destinations. In 2005, America West was the second largest low-cost airline in the United States based on revenue.
America West experienced bankruptcy restructuring in the early 1990s, emerging with support from partners Continent Airlines and Mesa Airlines. After emerging from bankruptcy, America West launched an expansion into the eastern U.S. based from a hub in Columbus, Ohio. It eliminated routes to Hawaii. It upgraded its fleet, ordering new Airbus 320s and retiring Boeing 727s. A new logo was launched and innovations such as e-ticketing and online ticket sales were implemented.
3. The U.S. Airways merger
3.1. Introduction
M&A in the airline industry is a relatively new strategic activity. During most of the industry’s history, M&A between competitors was not allowed due to industry regulations. In 1978, these constraints were relaxed as the industry was de-regulated and horizontal M&As were allowed for the purpose of generating efficiencies. This resulted in periodic acquisitions as the network airlines used M&A to reduce the level of competition in the U.S. market and eliminate excess capacity.
On May 19, 2005, America West and U.S. Airways announced their plans to merge. The announced merger of U.S. Airways and America West occurred as U.S. Airways was emerging from bankruptcy restructuring. The management team of America West assumed leadership of the combined company with America West CEO Douglas Parker being named CEO of the merged airlines. Along with his top management team from America West, CEO Parker focused on creating a stronger airline by combining a struggling U.S. Airways, which was strong in East Coast markets, and America West, which concentrated on markets along the West Coast. America West was considered the second largest low-cost airline behind Southwest Airlines. U.S. Airways was considered a hub-and-spoke network airline that lacked national scale. The combination of the two airlines would create a national network air carrier with the efficiencies of a low-cost carrier.
3.2. Stated goals of U.S. Airways–America West merger
CEO Parker suggested a number of synergies resulting from combining U.S. Airways and America West. First, the geographic markets were complementary. For example, pre-merger flyers from the East Coast traveling beyond the U.S. Airways geographic market were required to transfer to a competitor airline to complete their journey. Or, they might ticket with a larger competitor for a direct flight. The same issue faced an America West passenger traveling beyond the geography served by America West. By combining the operations of U.S. Airways and America West, the company expected to increase revenues as routes and connections across geographic markets were implemented. The combined passenger volume of the larger airline could also justify extending its geographic market. CEO Parker announced plans to re-enter the Hawaiian market specifically. He estimated new revenues from improved connections and expanded markets would be $150–$200 million (Carey, 2005).
Unprofitable routes could be eliminated, allowing cost savings in personnel servicing these routes, in maintenance expense, in fuel costs, etc. (Carey, 2005). By eliminating unprofitable routes, CEO Parker estimated U.S. Airways could reduce post-acquisition costs by $150–$200 million. Where possible, U.S. Air and America West flights serving the same routes could be consolidated, resulting in a single flight with more efficient utilization of staff, fuel, and maintenance services. U.S. Airways planned to make improvements in efficiency by ‘‘matching aircraft size to route demand’’ (typically measured as passenger load factor) and ‘‘flying the planes more hours per day’’ (Carey, 2005). These changes were expected to improve efficiency and capacity utilization by an undisclosed amount.
CEO Doug Parker stated that after the merger closed the combined company ‘‘will immediately integrate their managements, scheduling, pricing, marketing, and frequent flier plans, which will deliver ‘99% of the synergies’ very quickly.’’ (Carey, 2005) The total anticipated synergies from the merger were estimated to total $600 million. CEO Parker made no mention of changes to ticket prices that might result from the market power gained by merging U.S. Airways and America West or any plans to reduce purchasing costs, labor costs, or fuel expense through greater bargaining power with its suppliers or labor unions.
3.3. Efficiency vs. market power – M&A goals
As a horizontal merger, the proposed merger required review by the Federal Trade Commission (FTC) and the U.S. Department of Justice (DoJ) to examine whether the combined U.S. Airways would harm consumers by reducing price competition. Prior to this review, the companies involved in the merger could file information about their industry, their businesses, and the anticipated operational synergies associated with the merger. Essentially the merging companies could argue that combining their operations would allow U.S. Airways to be more efficient, reducing costs, and allowing them to pass efficiencies on to customers in the form of price reductions. Along with reviewing the filings of the merging companies, the FTC and DoJ examine the concentration within their industry. According to FTC guidelines, proposed horizontal mergers or acquisitions in markets with high levels of concentration are reviewed for anti-competitive impact.
The measure used to evaluate industry concentration is the Herfindahl–Hirschman Index (HHI) (DoJ, 2010). HHI measures the relative size and distribution of competitors within an industry. To calculate HHI, the individual market shares of each competitor within an industry are squared and aggregated into a sum. Thus, as the size of competitors measured by their market shares increases the HHI of the industry increases. At the time of the U.S. Airways merger, the DoJ guidelines stated HHIs that exceed 1800 indicate highly concentrated industries (DoJ, 1997). M&A transactions that increase HHI by more than 100 points within an already concentrated industry raise anti-trust concerns based on the DoJ and FTC Horizontal Merger Guidelines (DoJ, 1997, 2010). The DoJ guidelines were revised in 2010. Updated guidelines identify an industry with an HHI of 2500 as considered highly concentrated. Industries with an HHI between 1500 and 2500 points are considered moderately concentrated. The U.S. DoJ and FTC also examined M&A transactions increasing industry concentration by more than 100 points, depending on whether these occurred in moderately or highly concentrated industries. Mergers that increased HHI by more than 200 points typically received greater regulatory scrutiny.
The DoJ closed its investigation on the anti-competitive effects of the America West and U.S. Airways merger, issuing a statement on June 23, 2005. The investigation concluded,
The Antitrust Division has concluded that the proposed merger of America West and US Airways would not reduce competition, and therefore has decided to close its investigation without issuing requests for additional information. There is very little overlap between the networks of America West and US Airways. America West operates primarily in the western United States, with hubs in Phoenix and Las Vegas. In contrast, US Airways operates primarily in the eastern United States, with hubs in Philadelphia, Pittsburgh and Charlotte and substantial presences in Washington, D.C. and New York City. The Division has found that integration of airlines with complementary, end-to-end networks, like those of the merging firms, can achieve efficiencies that benefit consumers. The consolidation of America West and US Airways, which will create the fifth largest domestic carrier, will enable the merged airline to offer U.S. consumers more and better service to more destinations throughout the country. (DoJ, 2005)
U.S. Airways CEO Doug Parker was concerned about changes in the industry concentration since the combinations of Delta-Northwest and United-Continental. He knew the industry HHI had increased. As he evaluated the possibility of combining with American Airlines, he wondered if the industry had crossed the new threshold of a 1500 HHI and was now considered a moderately concentrated industry. He also wondered if combining with American Airlines would increase HHI by greater than 200 points and result in much greater scrutiny by the DoJ and FTC. With this concern in mind, he wanted to understand how the merger between America West and U.S. Airways had affected the efficiency and pricing of the combined company. If he could show the efficiency gains from the merger were strong and resulted in savings that were passed on to U.S. Airways’ customers, U.S. Airways would be in a better position to argue for support of another acquisition, such as American Airlines. This would help U.S. Airways respond to concerns about a clash with the stated objectives of the FTC’s Bureau of Competition which was ‘‘committed to preventing mergers and acquisitions that are likely to reduce competition and lead to higher prices, lower quality goods or services, or less innovation (FTC, 2012).’’
3.4. Possible performance changes resulting from M&A
Answers to the following questions were important to address the concerns of the DoJ and FTC and to understand the full range of performance effects of the U.S. Airways–America West merger:
- Did the merged U.S. Airways grow its sales volume between the pre- and post-merger periods as predicted by management or did sales volumes decline?
- How did changes in pricing and costs affect post-merger performance? Although no changes in ticket prices or inputs costs were predicted by U.S. Airways’ management to result from the merger, the airline industry had consistently experienced volatility in prices and costs. Also, theories of horizontal acquisitions suggest the combined company use its increased market power to raise prices or bargain with supplier for volume discounts.
- Did the merged U.S. Airways improve its efficiency as predicted by management or did the challenges of acquisition integration negatively affect operational efficiencies?
- Did the merged U.S. Airways reduce its cost associated with unused capacity? Was it able to reduce the excess capacity of its combined fleet of planes?
Showing evidence that customers benefited from operational efficiencies and more competitive prices in a previous merger could help U.S. Airways build a case for approval of a future merger or acquisition. Understanding performance variances from a previous merger were also important for understanding the effectiveness of U.S. Airways’ merger integration team and its ability to deliver the savings and performance improvements in a proposed merger or acquisition. This could also help in estimating synergies for prospective mergers or acquisitions.
4. The strategic variance analysis (SVA)
Cost/managerial accounting literature recently introduced the concept of strategic analysis of variance, whose methodology is based on the strategic analysis of operating income first formulated by Horngren, Foster, and Datar (2000) and later extended by Sopariwala (2003). The extended analysis explains the difference in operating incomes between two years as a combination of four components. The first component, the growth component, measures changes in operating income resulting from changes in sales units, holding sales prices, input costs and input–output relationships constant. Further, this component can be broken into a market size variance, representing the change in the company’s operating income due to a change in the market size, and market share variance, representing the change in the company’s operating income due to a change in the company’s market share.
The second component, the price-recovery component, evaluates changes in operating income caused by variations in sales prices and unit input costs keeping sales units and input–output relationships constant. This component includes a revenue effect, which measures the impact of changing sales prices and is set off against the cost effect, which measures the impact of changing input costs.
The third component, the productivity component, examines changes in operating income caused by changes in input–output relationships (i.e., a company’s operational efficiencies), holding sales units, sales prices and unit input costs constant. Finally, the fourth component, the capacity underutilization component, measures changes in operating income resulting from a change in either the amount or cost of unused capacity between two years.
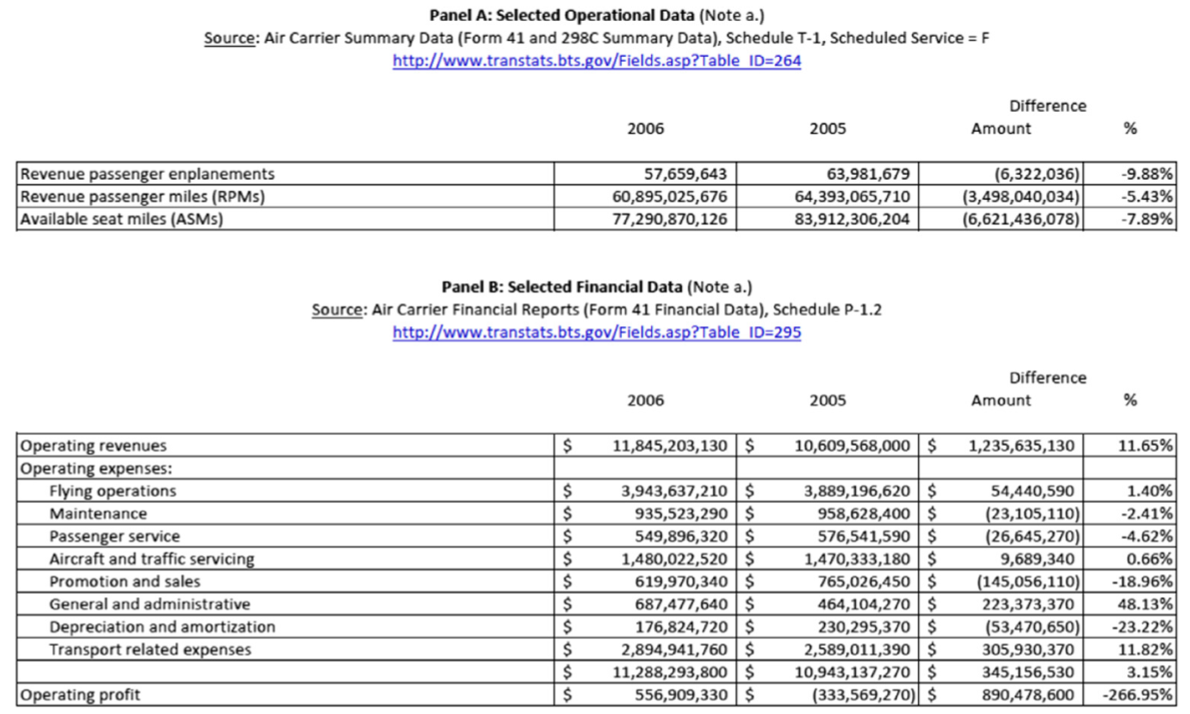
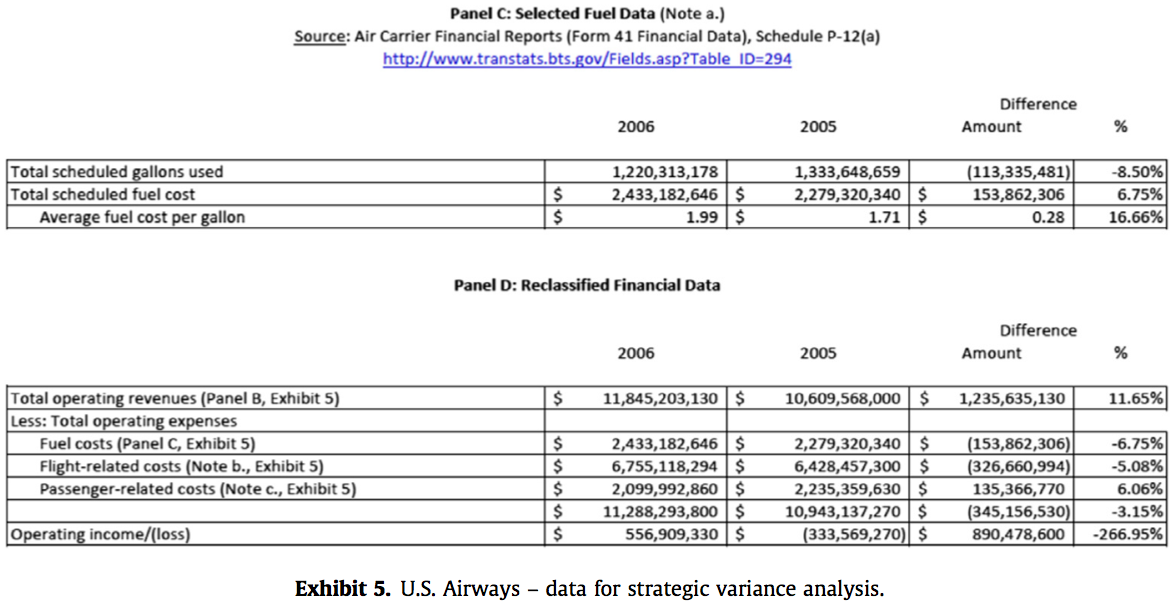
5. The financial and operating data: 2005 vs. 2006
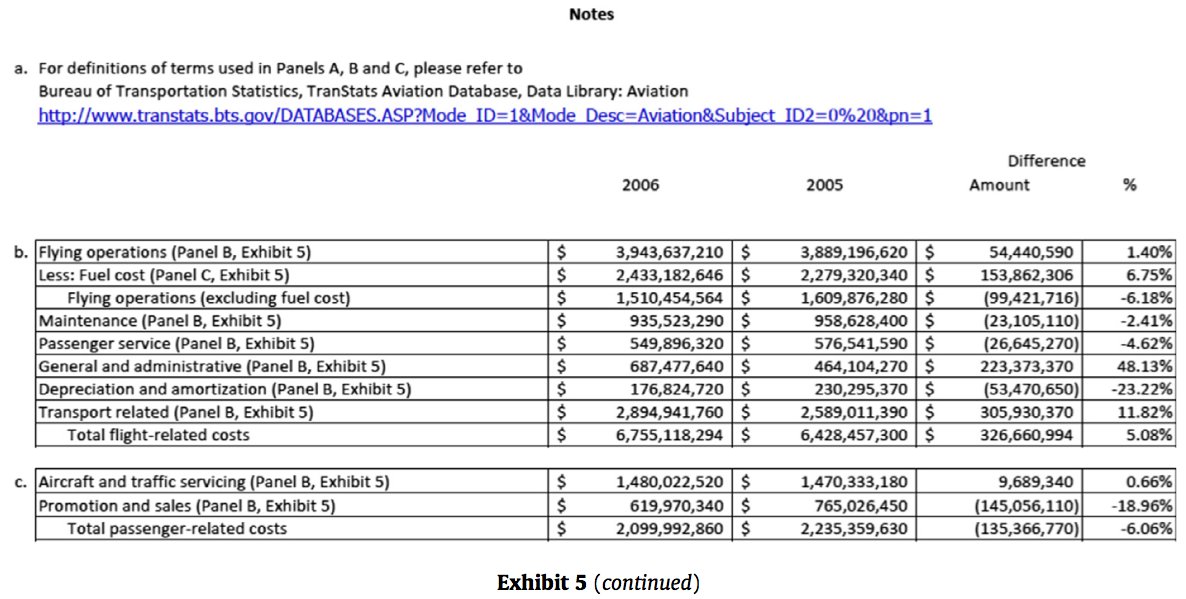
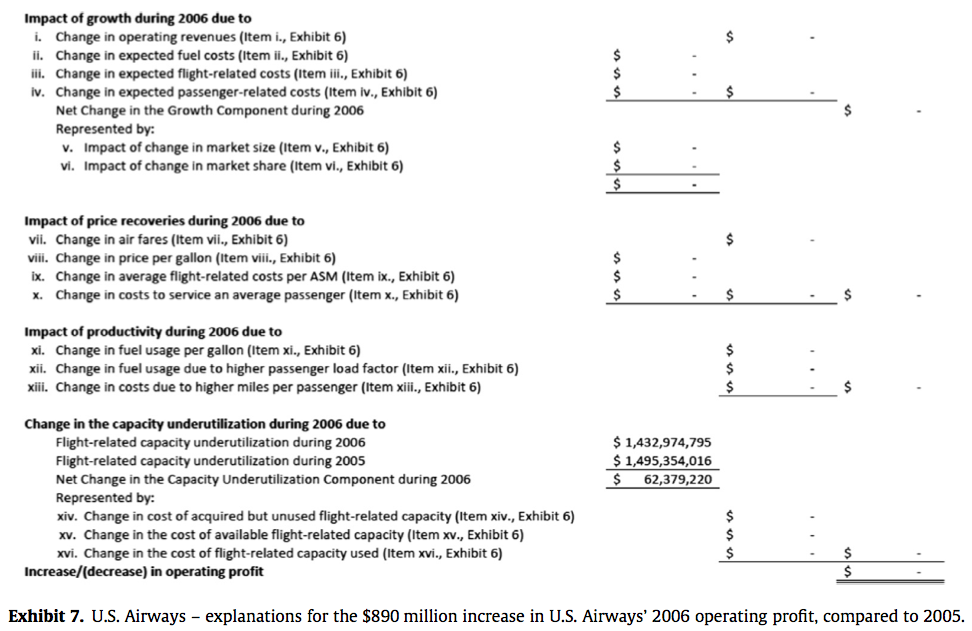
The financial and operating data of U.S. Air and America West are combined to determine their pre-merger (i.e., year 2005) performance and compare it with their post-acquisition, or year 2006. The necessary data was extracted from the U.S. Department of Transportation’s Bureau of Transportation Statistics’ TranStats Aviation Database. Panel A of Exhibit 5 provides U.S. Airways’ operating data (i.e., revenue passenger miles (RPMs), available seat miles (ASMs) and revenue passenger enplanements) for 2005 and 2006, Panel B of Exhibit 5 details its operating revenues and expenses for 2005 and 2006 revealing an $890 million increase in U.S. Airways’ 2006 operating income over that in 2005 and Panel C of Exhibit 5 provides its fuel usage and fuel costs for 2005 and 2006. Panel D of Exhibit 5 reclassifies U.S. Airways’ 2006 and 2005 operating expenses of $11.3 billion and $10.9 billion respectively into three groups; fuel costs, flight-related costs (including flying operations without fuel costs, maintenance, passenger service expense, general and administrative expense, depreciation and amortization, and transport-related expense) and passenger-related costs (including aircraft and traffic servicing expenses and promotion and sales expenses).
6. Discussion questions
6.1. Technical analysis
6.1.1. Question 1
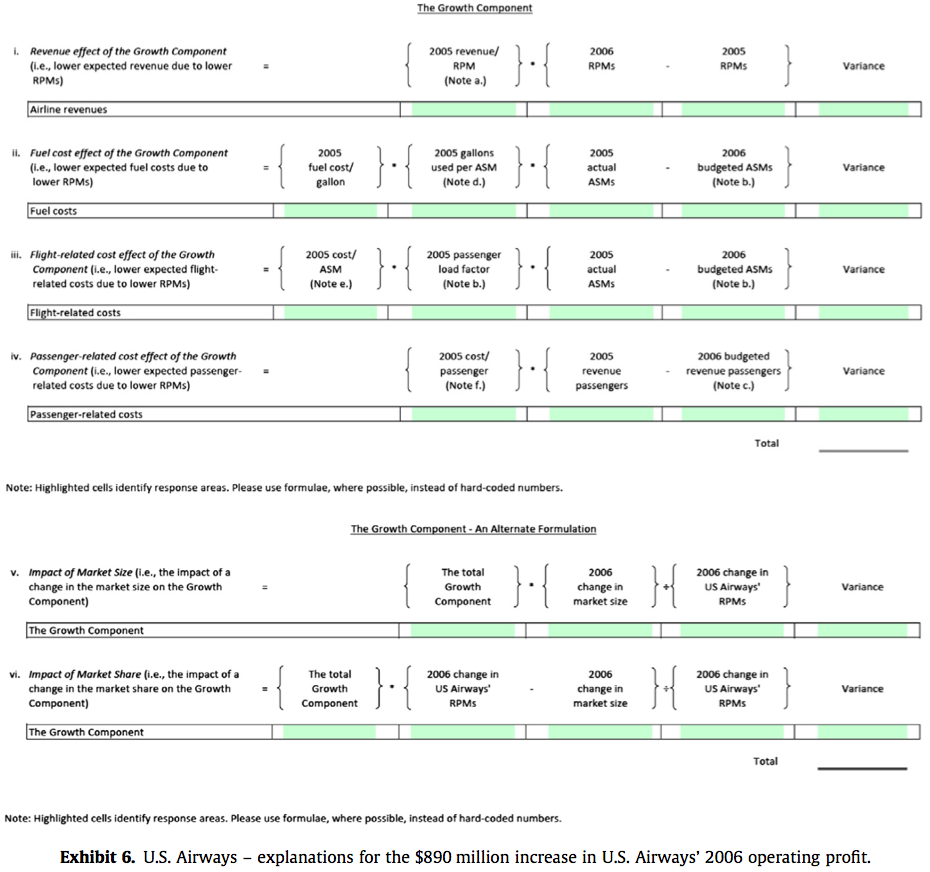
Using the methodology outlined in Mudde and Sopariwala (2008) and the data in Exhibits 4 and 5, calculate the following variances and components in the blank Exhibits 6 and 7:
a. The Growth Component, which is made up of variances reflecting changes in sales volume (i.e., RPMs) on (i) revenues, (ii) fuel costs, (iii) flight-related costs and (iv) passenger-related costs.
b. Using the total of the Growth Component derived in 1.a., determine the variances reflecting changes in (i) market size and (ii) market share.
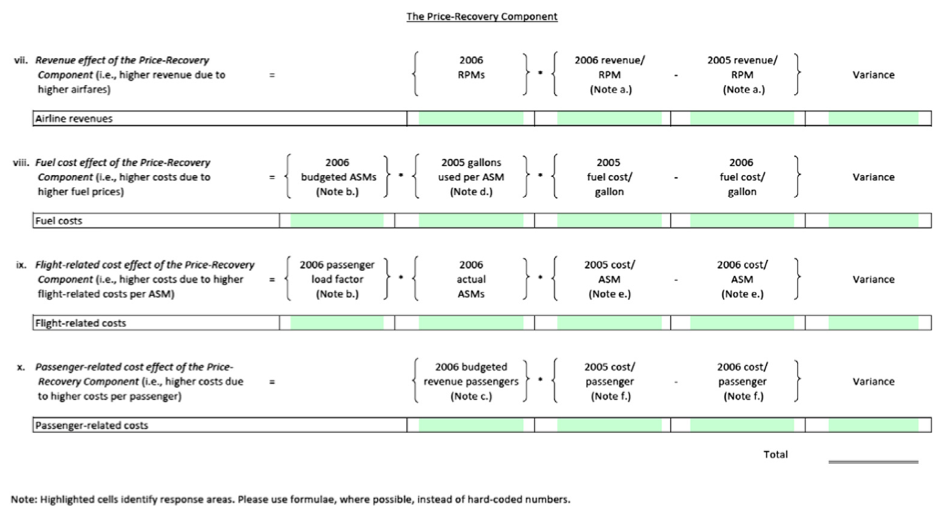
c. The Price-Recovery Component, which is made up of variances reflecting changes in (i) average airfares, (ii) average fuel costs per gallon, (iii) average flight-related costs and (iv) average passenger-related costs.
d. The Productivity Component, which is made up of variances reflecting changes in (i) fuel usage due to fuel efficiencies, (ii) fuel usage due to a change in the passenger load factor and (iii) passenger-related costs due to higher miles traveled by the average passenger.
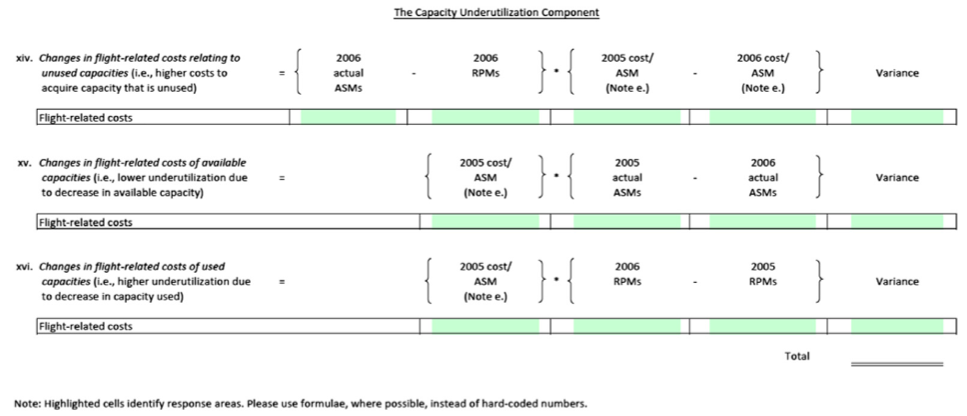
e. The Capacity Underutilization Component, which is made up of variances reflecting changes in the cost of (i) acquired but unused flight-related capacity, (ii) available flight-related capacity and (iii) used flight-related capacity.
6.1.2. Question 2
Based on the market share data in Exhibit 3, calculate the industry concentration at the following points in time:
a. Calculate the HHI for 2005 (prior to the U.S. Airways–America West merger) and compare with the HHI for 2006 (after the U.S. Airways–America West merger).
b. Calculate the HHI in 2010 and compare with the HHI after the merger of Delta-Continental and merger of American Airlines–U.S. Airways.
6.2. Interpretative analysis
6.2.1. Question 1
Based on the market share data from 2010 disclosed in Exhibit 3, would the proposed merger of American Airlines and U.S. Airways’ increase the airline industry’s concentration above the 1500 threshold for a moderately concentrated industry? Will it increase the industry’s HHI by more than 200 points? What are the implications for regulators evaluating the competitive effects of the merger?
6.2.2. Question 2
Explain the predictions associated with efficiency arguments for M&A and market power arguments for M&A.
a. Given the conditions in the industry, what does the Market Power Theory of M&A predict about the merger’s impact on the component variances of SVA?
b. How do the strategic variances realized by U.S. Airways between 2005 and 2006 compare with the predictions of the Market Power Theory of M&A?
c. Given the conditions of America West and U.S. Airways as they combined, what does the Efficiency Theory of M&A predict about the merger’s impact on the component variances of SVA?
d. How do the strategic variances realized by U.S. Airways between 2005 and 2006 compare with the performance changes predicted by the Efficiency Theory of M&A?
6.2.3. Question 3
Summarize the predictions of U.S. Airways’ CEO on how the combination of America West and U.S. Airways would impact post-merger performance:
a. What are the predictions of U.S. Airways’ CEO regarding the synergies expected from the merger of U.S. Airways and America West?
b. What do these expected performance changes predict about the merger’s impact on the four component variances of SVA?
c. How do the strategic variances realized by U.S. Airways between 2005 and 2006 compare with the performance changes predicted by U.S. Airways management?
6.2.4. Question 4
Based on the completed SVA, interpret the results of the SVA for U.S. Airways’ management:
a. Has the U.S. Airways merger delivered the performance improvements predicted by management?
b. Interpret the relationship between the different components and the challenges associated with integrating two large, complex airlines – specifically:
i. How have marketing changes affected both price-recovery and growth variances?
ii. Which variances are most susceptible to influence by external factors?
iii. U.S. Airways’ management suggested that synergies from the merger will be realized ‘‘very quickly’’, suggesting a short time horizon for an SVA analysis. What types of post-acquisition synergies are likely to be realized in a short time horizon? What types are likely to require more time? Would you expect significant changes in the SVA findings if the time horizon for the analysis included 2007?


7. Teaching notes
7.1. Educational objectives
The focus of this teaching case is introducing MBA students (or MSA students) to the application of the strategic variance analysis (SVA) methodology [Horngren, Datar, and Rajan (2012) and Sopariwala (2003)], its use in examining the effectiveness of management decisions and strategies, and the interpretation of SVA results for general managers. The case focuses on the U.S. Airways–America West merger; a strategic action that simultaneously impacts firm size and growth, pricing and unit costs, productivity, and capacity utilization for the combining airlines. The case discusses the theoretical role of efficiency and market power in horizontal acquisitions and the importance of industry concentration in the regulation of horizontal acquisitions.
The application of SVA to mergers and acquisitions (M&A) demonstrates the SVA methodology’s ability to isolate changes in important variances such as growth, price-recovery, productivity, and unused capacity. SVA provides better information about M&A performance than methods used in previous research and practice, which focus on general accounting performance or financial returns.
The case focuses on two primary learning outcomes: (a) students learn the technical application of strategic variance analysis and (b) students use the results of their SVA to understand the changes in accounting performance resulting from a complex strategic action and examine the effectiveness of a specific M&A, the merger of U.S. Airways and America West. Secondary learning outcomes include exposing students to M&A theory, regulatory perspectives on M&A, and measures of industry concentration.
The case is also designed to develop students’ critical thinking skills and improve their business judgment, strategic thinking, and measurement and reporting expertise, all of which are part of the AICPA’s stated core competencies for accounting students (AICPA, 2007).
7.2. Evidence regarding case efficacy
An earlier version of this case has successfully been used in a managerial accounting course required for the managerial accounting track in the MSA program at a large, research-oriented university and in an elective managerial accounting course in the MBA and MSA programs at a mid-sized university. Combined, the case has been taught to 50 students consisting of 34 MSA students and 16 MBA students. The students had a wide range of undergraduate training in accounting, varying from no accounting classes to 13 accounting classes. At the master’s level, students’ accounting experience varied from zero to four accounting classes with the average being 2 previous accounting classes. The students’ self-reported preparation for the case discussion ranged from a high of 6 hour to a low of 30 minutes. The average time for reading and analyzing the case was 3 hours.
A questionnaire was administered to students immediately following the case discussion. The students responded to the questions outlined in the table below anonymously so they could share their opinions regarding the case freely. Each question response was on a scale of 1–10 (with 10 being most ‘‘helpful’’). The following table summarizes the students responses to questions related to their learning:
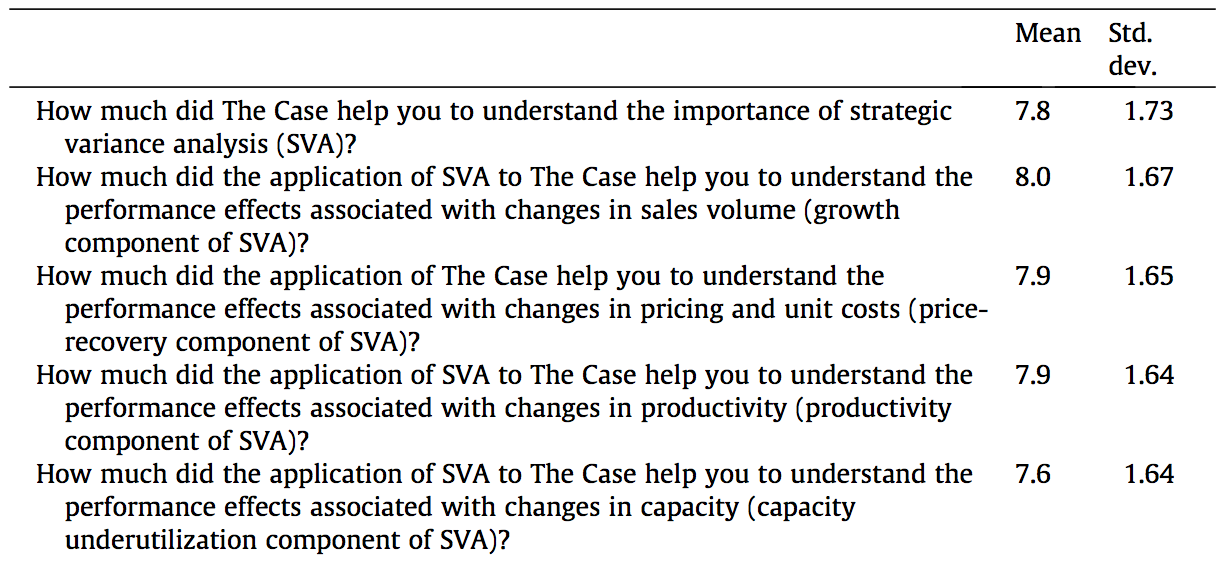
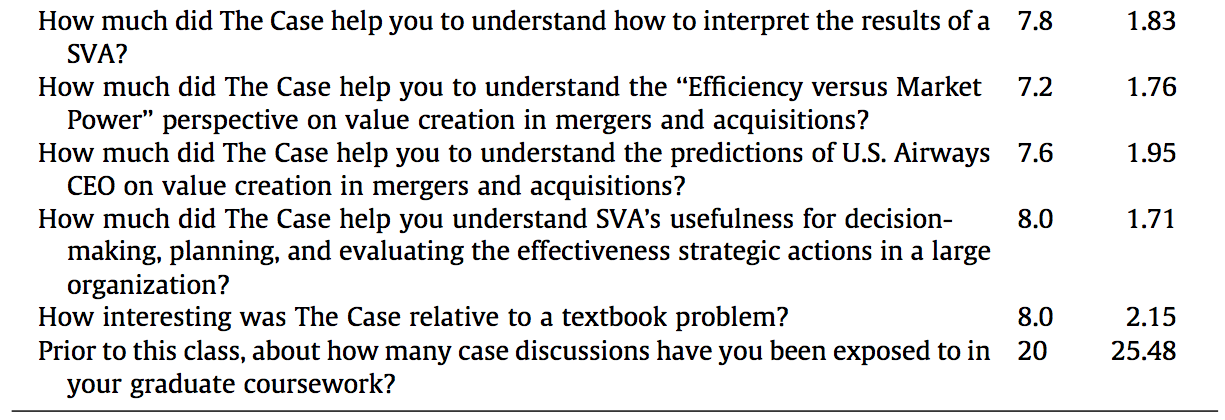
When asked, ‘‘would you recommend that instructors at other universities use the case?’’ the students responded unanimously ‘‘yes’’ and included the following comments:
‘‘the case helped my understanding of SVA and its application to the real world.’’ ‘‘[the case] highlights company claims vs. actual company results from M&A transactions.’’
‘‘[the case is] recommended because SVA is a subject I have never seen before and seems helpful/useful.’’
‘‘In terms of cost accounting cases, there aren’t many that reach outside of the manufacturing realm. It was refreshing. Also, a very solid and interesting application of SVA on a worthy candidate of a company.’’
‘‘on top of it being helpful in understanding SVA, it was a very interesting read.’’
7.3. Implementation guidance
Presenting the topic of strategic variance analysis the week before the case discussion is recommended. Typical preparation for the SVA lecture and case discussion includes readings and assignments related to strategic analysis of operating income as presented by Horngren et al. (2012) and Sopariwala (2003). Also helpful is an example of SVA applied to one company in the airline industry, Southwest Airlines (Mudde & Sopariwala, 2008). Using the example of calculating strategic variances based on a manufacturing example and the methodology discussed in Horngren et al. (2012) and Sopariwala (2003), the calculations of growth, price-recovery, productivity, and capacity underutilization variances can be reviewed. Based on the Mudde and Sopariwala (2008) article applying SVA to Southwest Airlines, the differences in applying a SVA to the airline industry as opposed to manufacturing can be highlighted. Additional background readings could include the guidelines on horizontal mergers published by the U.S. Department of Justice and the Federal Trade Commission.
7.3.1. Suggested class scheduling
7.3.1.1. Introduction to strategic variance analysis (75 minutes). We recommend that one class be used to introduce and familiarize students with the strategic variance analysis concept using the following readings and handout, which could be provided to students:
a. Sopariwala (2003). Strategic Analysis of Operating Income: An Extension to Horngren, Foster and Datar. Journal of Accounting Education 21, 2003, 25–42. [This reading discusses the Strategic Variance Analysis methodology, initially introduced in Horngren, Foster and Datar (2000, pp. 470–477) and provides the rationale for Sopariwala’s extension of the Horngren et al. (2000) methodology. This reading uses a simple manufacturing example to distinguish between the two methodologies and should be an appropriate introduction to strategic variance analysis.]
b. Mudde and Sopariwala (2008). Examining Southwest Airlines’ Strategic Execution – A Strategic Variance Analysis. Management Accounting Quarterly, (Summer 2008), 20–32. [This reading applies Sopariwala’s extension of the Horngren et al. (2000) methodology to Southwest Airlines and should enable students to apply what they learnt about strategic variance analysis in the context of a simple manufacturing environment, to the real-life example of Southwest Airlines.]
After concluding the above-mentioned review of strategic variance analysis, the instructor could present the case assignment, highlighting the technical and interpretive questions, and explain the student workbook that students need to complete for the next class.
7.3.1.2. Technical analysis (75 minutes). This 75-minute class could be dedicated to discussing the U.S. Airways merger SVA and discussing Questions 1 and 2 relating to the technical analysis of SVA and the Herfindahl–Hirschman Index (HHI) respectively.
Question 1 may require the instructor to review the rationale of SVA and its application to evaluating the performance implications of complex, strategic actions, such as M&As. SVA is a methodology that isolates the performance effects of changes in firm size (identified as the growth component), changes in unit pricing and unit costs (identified as the price-recovery component), changes in efficiency (the productivity component), and changes in cost of underutilized capacity (the capacity underutilization component). With SVA’s ability to isolate the performance impacts associated with growth in sales volume (holding pricing, productivity, and capacity constant), it can examine whether a particular M&A resulted in performance gains from post-acquisition changes in sales volume. With SVA’s ability to isolate the performance impacts associated with changes in the prices for either products sold or inputs purchased (holding sales volumes, productivity, and capacity constant), it can examine whether a particular M&A resulted in performance gains from post-acquisition changes in price-recovery. With SVA’s ability to isolate the performance impacts associated with changes in productivity (holding sales volumes, pricing, and capacity constant), it can examine whether a particular M&A resulted in performance gains from post-acquisition changes in efficiency. Lastly, with SVA’s ability to isolate the performance impacts associated with changes in the cost of unused capacity (holding sales volumes, pricing, and productivity constant), it can examine whether a particular M&A resulted in performance gains from post-acquisition changes in capacity. Each of these changes can be a source of either positive or negative synergy within a specific acquisition. SVA’s ability to provide this information allows managers to understand what types of synergies have been realized and where corrective action may be required to get the anticipated economic benefit expected from an acquisition. Students may have struggled with the logic of the SVA methodology or its application to the U.S. Airways merger, so starting with a review of the rationale behind the SVA methodology and the results of the SVA analysis may help to expose some basic misunderstandings.
Following the review of the technical application of SVA, the instructor should lead a discussion of the calculation of the HHI based on Question 2.
7.3.1.3. Interpretative analysis (75 minutes). Before commencing the interpretative analysis, it is important to have reviewed the technical analysis of industry concentration and SVA so that all students are interpreting the same set of facts. Since this part of the discussion involves questions that encourage students to interpret the results, the time required for each question can vary. The instructor should maintain a flexible plan for managing the time dedicated to each question, with an upper limit of time for each question to assure that discussion progresses through all of the assigned questions. The instructor may choose to discuss all the outlined questions or select only some of the questions, allowing for a deeper interpretation of a smaller range of issues. In the following sections, we review in detail the teaching plan, presenting the solutions to each question and outlining strategies for managing the interpretive discussion.
Question 1 discusses the changes in industry concentration that affect the level of price competition in the industry. This has implications for the regulatory environment as well as the post-acquisition performance changes. Particularly, industry concentration affects whether U.S. Airways can use market power gained from its merger with America West to improve its price-recovery component of SVA. Question 2 reviews the predictions of the market power theory of M&A and examines whether the findings of SVA are consistent with this theory. It next discusses the efficiency theory of M&A and examines whether the findings of SVA are supportive of this theory. Question 3 explores the predictions of U.S. Airways’ management and examines whether SVA is supportive of their predictions. Finally, Question 4 encourages students to reflect on the overall findings, interpret the results for management, and draw conclusions regarding the realization of synergies in the U.S. Airways merger. The SVA will show mixed results. Some of the predictions from U.S. Airways management are realized (productivity improves due to the merger), but others are not (price-recovery does not improve due to cost reductions from eliminating unprofitable flights). The primary realized performance improvements in the post-merger period were not predicted by management (significant increases in airfares and reductions in the cost of capacity underutilization). Management also made no mention of possible performance problems, or lack of synergies that could result from the merger (losses of market share and significant increases in unit costs).
The value of utilizing SVA to examine the effectiveness of strategic managerial actions is demonstrated by the difference between the synergies predicted by U.S. Airways management and those realized in the merger. The importance of post-acquisition managerial learning via SVA is ironically shown by the attempted take-over of Northwest Airlines, while still integrating the U.S. Airways–America West merger and the current U.S. Airways and American Airlines merger.
Students can get additional background on the Horizontal Merger Guidelines issued by the U.S. Department of Justice and the Federal Trade Commission August 19, 2010, available at the following website:
http://www.justice.gov/atr/public/guidelines/hmg-2010.html#4a.
http://www.justice.gov/atr/public/guidelines/hmg-2010.html#5c.
7.4. Recommended solutions
The Recommended Solutions associated with this case, along with the Student and Instructor Versions of the Excel Workbook, are available on request from the authors.
Acknowledgments
We first thank the Editor-in-Chief (David E. Stout), the Associate Editor and the reviewers for their insight and helpful suggestions. We next thank the session participants at the 2009 American Accounting Association Annual Midwest Regional Meeting and the 2010 AAA’s Management Accounting Section’s Research and Case Conference for their helpful comments on earlier drafts of this case. Finally, we thank Karen Sedatole, Michigan State University, for her efforts and contributions to improving the case, teaching notes, and learning objectives by using the case with her MSA & MBA students.