By Sriram Prakash, Irina Bolotnikova, Haranath Sriyapureddy – Deloitte
Contributors: Ben Davies, James Anson-Smith, Jo Brealey, Kristie Ampuero
About The Deloitte M&A Index
The Deloitte M&A Index is a forward-looking indicator that forecasts future global M&A deal volumes and identifies the factors influencing conditions for dealmaking.
The Deloitte M&A Index is created from a composite of weighted market indicators from four major data sets: macroeconomic and key market indicators, funding and liquidity conditions, company fundamentals, valuations.
Each quarter, these variables are tested for their statistical significance and relative relationships to M&A volumes. As a result, we have a dynamic and evolving model which allows Deloitte to identify the factors impacting dealmaking and enable us to project future M&A deal volumes. The Deloitte M&A Index has an accuracy rate of over 90% dating back to Q1 2008.
In this publication, references to Deloitte are references to Deloitte LLP, the UK member firm of DTTL.
Key points
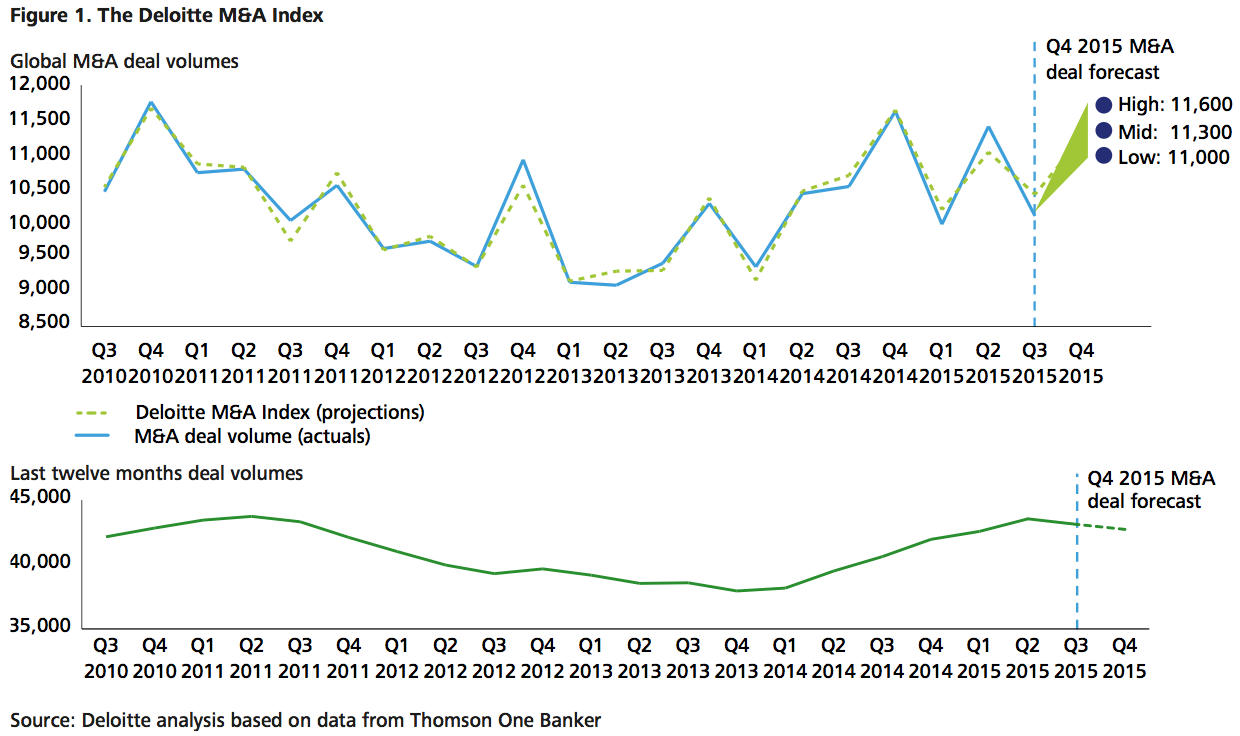
- We are expecting 2015 to end with over $4 trillion worth of deals making it the highest for deal values since 2007. However, on a last-twelve-months (LTM) basis, there was a slowdown in the volume of transactions in the second half of 2015.
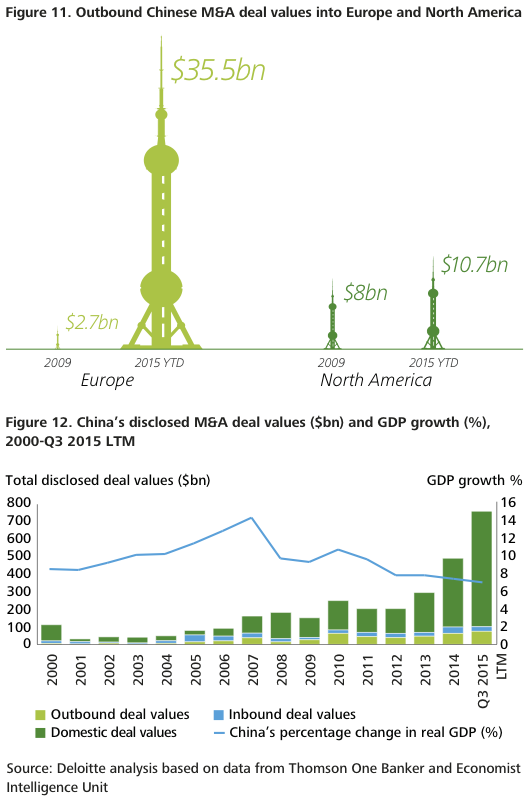
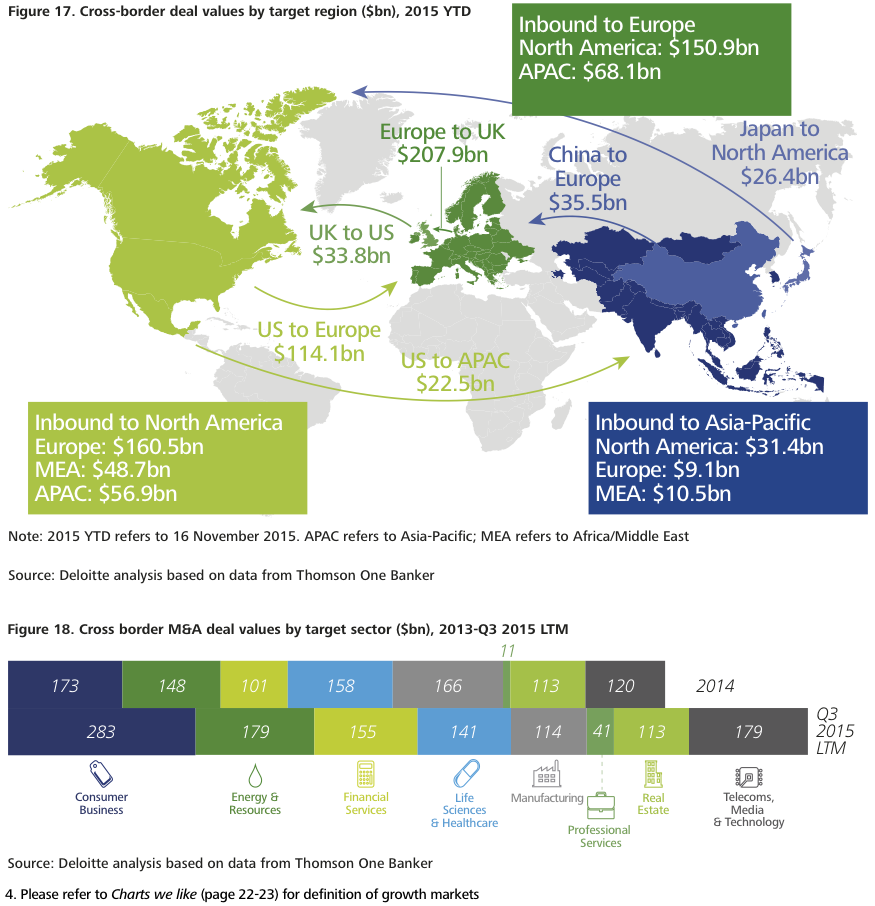
- Cross-border deals are a major feature of this M&A wave. More than $1 trillion worth of cross-border deals have been announced so far this year, of which a third were in the vibrant deal corridor between North America and Europe. In addition, new corridors have started emerging between Asia and Europe, led by China and Japan, and are likely to continue in 2016.
- Our analysis shows that companies are committing to deliver annualised cost synergies that represent, on average, 3-4% of the transaction value. If all announced cost synergies are realised and sustained, they could add an estimated $1.5-1.9 trillion to the value of these companies. Therefore delivering these synergies will be high on boardroom agendas.
- The threat of disruptive innovation is impacting the traditional products and markets of many companies. In response they are launching venture funds to seek and invest in new sources of innovation, which could lead to smaller, but more strategic deals.
- As this record-breaking year draws to a close, concerns over global growth are back, along with divergence in economic and monetary policies. Looking ahead, we expect such divergence to create M&A opportunities and define dealmaking in 2016.
Factors influencing M&A in 2016
Divergence in global economic growth
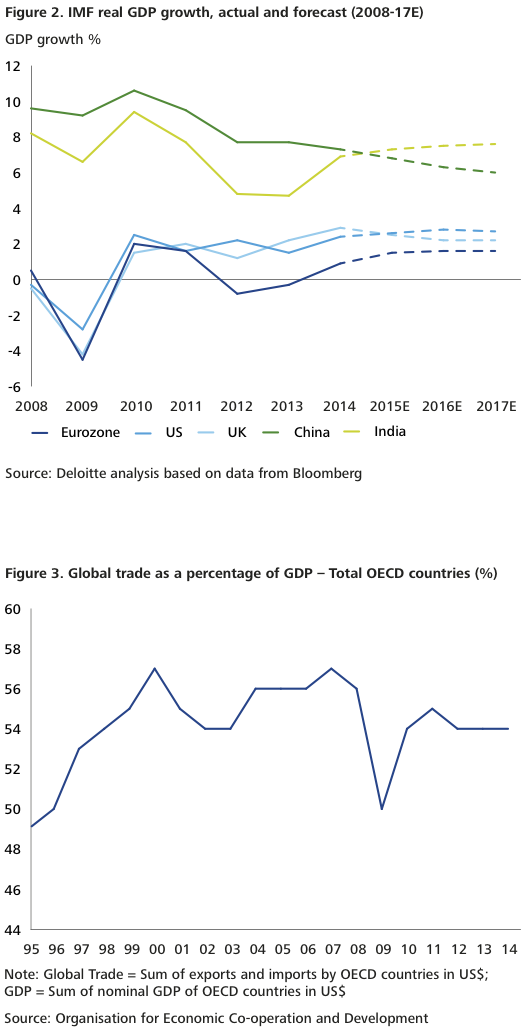
After a strong recovery, the US economy experienced a modest slowdown in the second half of 2015 and the International Monetary Fund (IMF) cut the growth outlook for the US in 2016 from 3% to 2.8%. While unemployment in the US is low and wage recovery strong, the labour participation rate as measured by working age population in employment remains the weakest since the 1970s. Meanwhile, the IMF expects the eurozone to grow at 1.6%, in part due to the continued commitment of the European Central Bank (ECB) to quantitative easing.
Among BRICs, China missed its first growth target in two decades, while the commodity exporting nations of Brazil and Russia have slipped into recession. On the other hand, India will be the fastest growing major economy in 2015, according to IMF forecasts. In addition, the Philippines, Vietnam, Indonesia and Malaysia – four of the ten fastest growing economies in 2015 – are in the Association of Southeast Asian Nations (ASEAN) region.
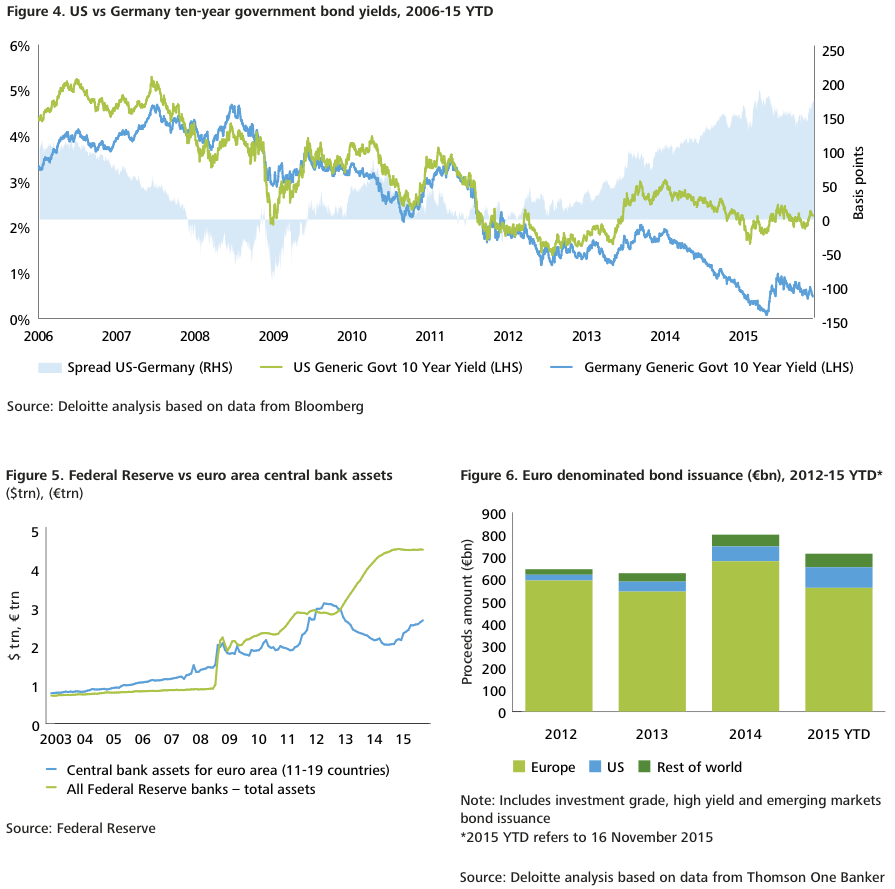
Against this backdrop, global trade as a proportion of GDP has been broadly stagnant since 2011, sparking debate on whether the impact of globalisation has peaked. Potential reasons include cyclical shifts such as the slowdown in investment in response to weaker demand in major economies, as well as structural shifts such as the realignment of China from an export-oriented to a domestic consumption-driven economy.
Divergences in economic growth mean companies would need to be actively on the lookout for growth markets and deal opportunities.
Divergence in monetary policies
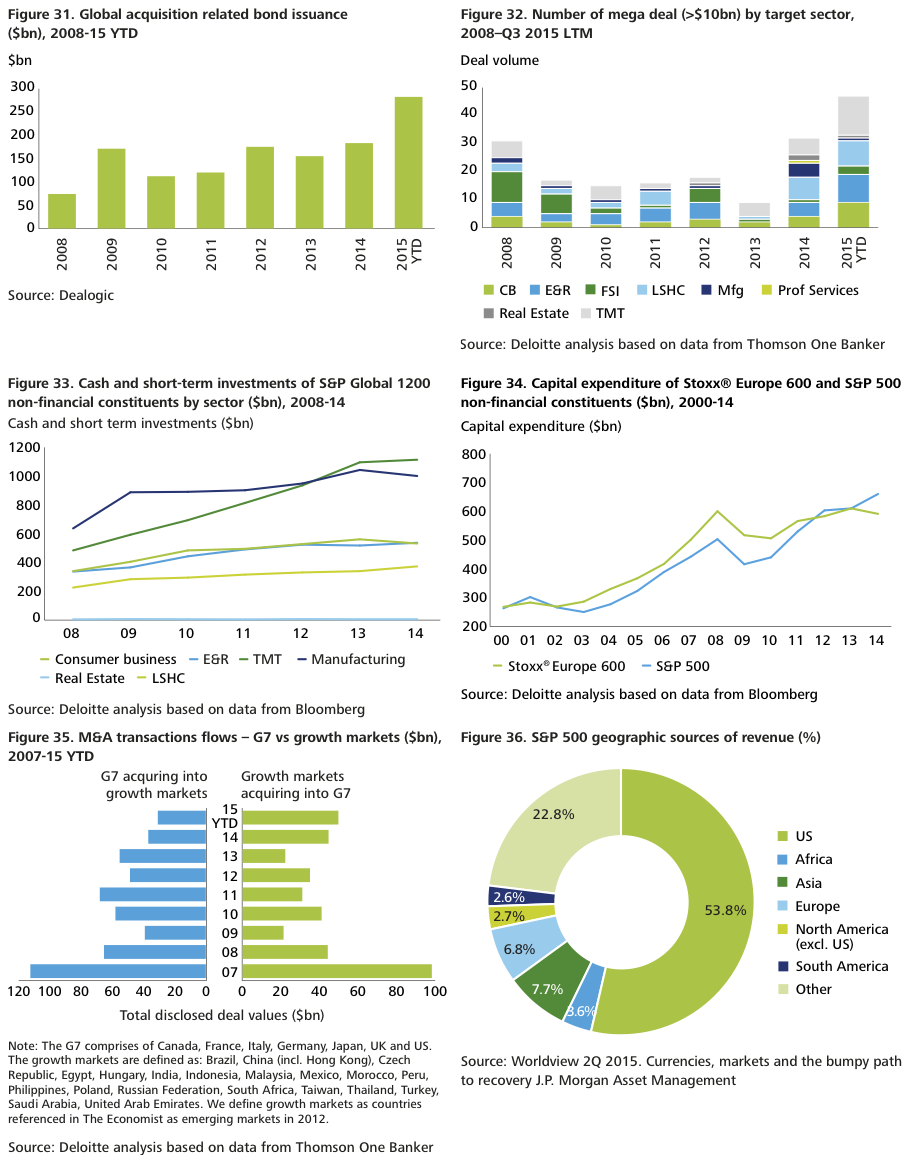
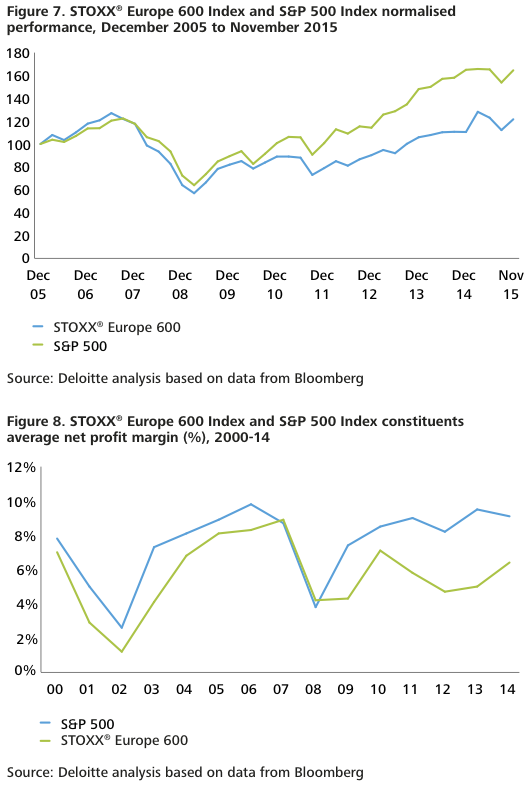
Monetary policies among the major central banks are diverging. In the US, the market is widely expected to have already priced in the gradual increases to the Federal Reserve interest rate. While we do not expect major shocks in the debt market, increases in the cost of credit could lead to a slowdown in the issuance of acquisition related bonds which globally stands at $282 billion, a 15-year high.
At the same time, the ECB is committed to its quantitative easing programme, which has led to a slide in bond yields. The spreads between the US and German 10-year bonds are widening. This presents opportunities for global companies to take advantage of the funding conditions in Europe to raise additional debt. So far this year overseas companies have issued €155 billion worth of corporate bonds in Europe, much higher than the €120 billion raised during the whole of last year.
Divergence in corporate performance
Since the financial crisis, European corporate earnings have trailed those of the US companies, where they are close to 15-year highs. However, the gap is expected to narrow if European demand picks up following the ECB stimulus. We have already seen European corporate margins increase at a strong pace since 2013, while S&P 500 companies are expected to show three consecutive quarters of declining earnings.
The US dollar has appreciated in recent years and future Federal Reserve rate increases are likely to strengthen it further. This in turn will put pressure on the earnings of US companies that depend on exports. It is estimated that around 45% of the revenues of S&P 500 companies come from overseas markets. We therefore expect US companies to continue cross-border M&A acquisitions to offset some of the pressure, and benefit from growth in new markets.
Divergence in deal valuations and cash positions
P/E multiples for deals in the US and Asia are well above their 15-year average, whereas in Europe they are still close to their average. European companies have access to local markets that are expected to grow faster than many other developed economies, making them attractive acquisition targets at favourable deal P/E multiples.
With $1.6 trillion, North American non-financial companies, led by those in the US, have the highest levels of cash reserves in the S&P 1200 Index and this puts them in a strong position to acquire assets in Europe. The European companies in S&P 1200 have $1 trillion in cash reserves, while Asian companies have $844 billion in cash reserves.
Impact of Chinese slowdown on M&A markets
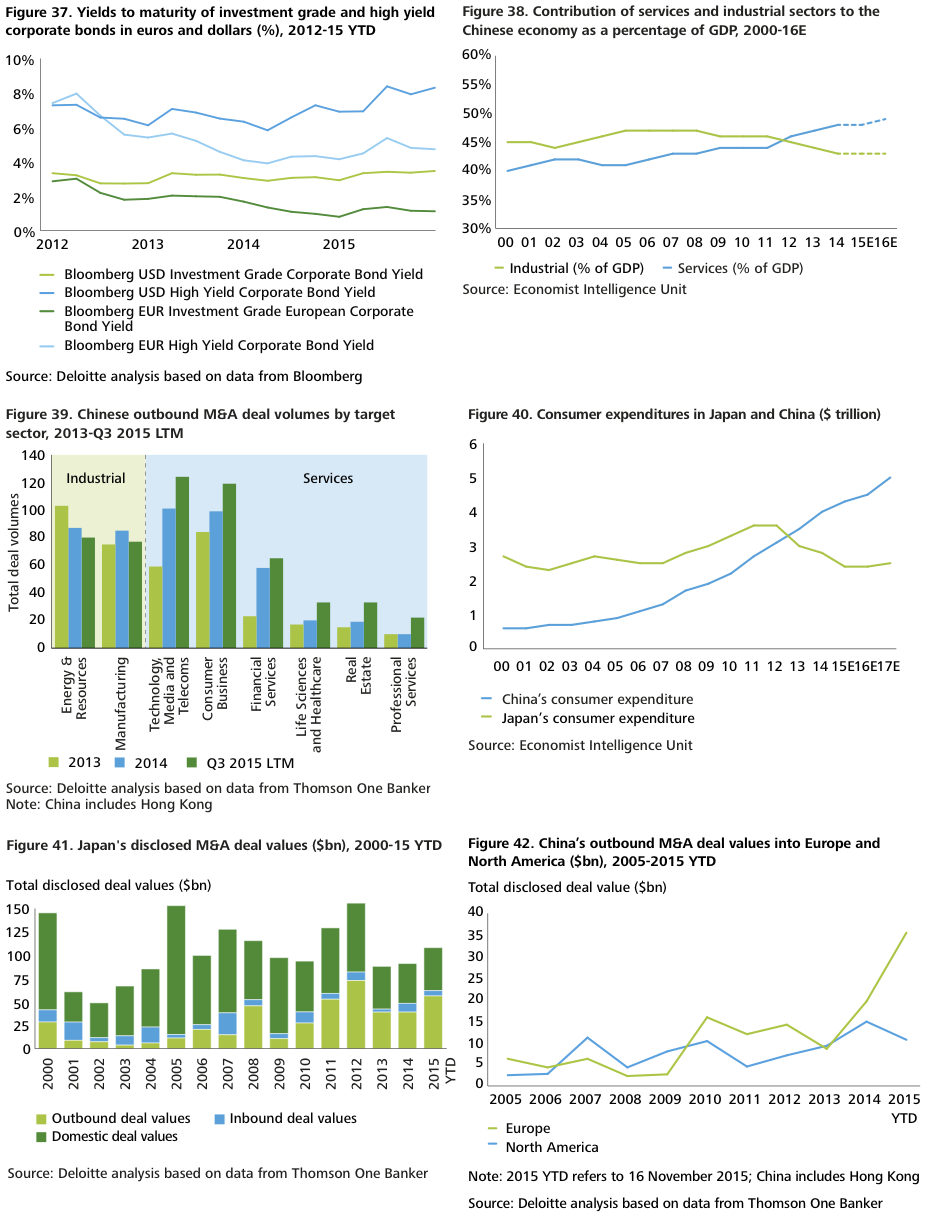
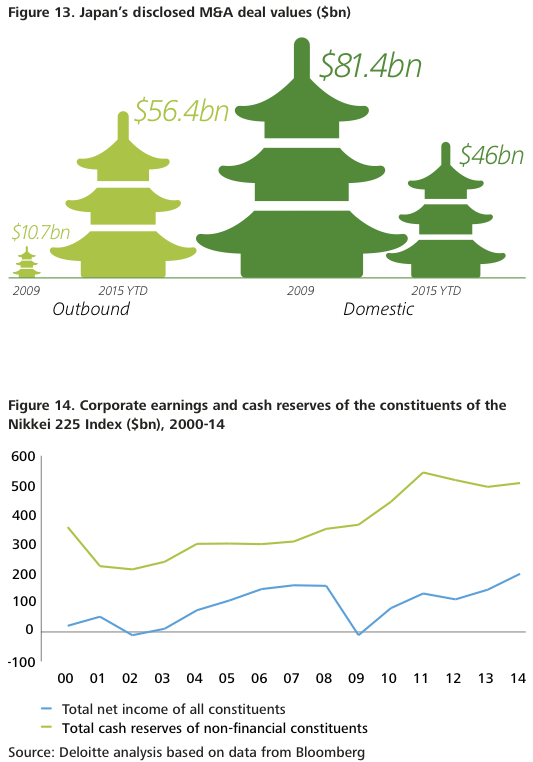
After decades of era-defining growth, in 2014 China missed its growth target for the first time since 1998, recording its lowest growth rate in 24 years. In its latest five-year plan, Chinese authorities have announced a revised growth target of 6.5% up to 2020.
China is in the midst of rebalancing from an investment led, export oriented economy to a consumption driven one. This shift is signalled by the dominance of the services sector, which now accounts for 48% of economic output, compared to 43% for the industrial sector.
The decline in Chinese GDP growth and the shift to a consumption driven economy is mirrored by a steep increase in M&A activities, both domestic as well as cross-border. So far this year, Chinese companies have spent $65.8 billion
in overseas acquisitions, with the majority in Europe. However, there was a decline in the volume of outbound acquisitions made in the E&R and manufacturing sectors, while there was an increase on the part of TMT and consumer business companies.
The slowdown in Chinese growth is expected to have a ripple effect on M&A markets, first in the commodities sector, where consolidation is expected as well as in commodity exporting nations where activities could slow down. It could also lead to consolidation in sectors such as shipping and logistics which depend on growth in trade.
Strong resurgence in Japanese dealmaking
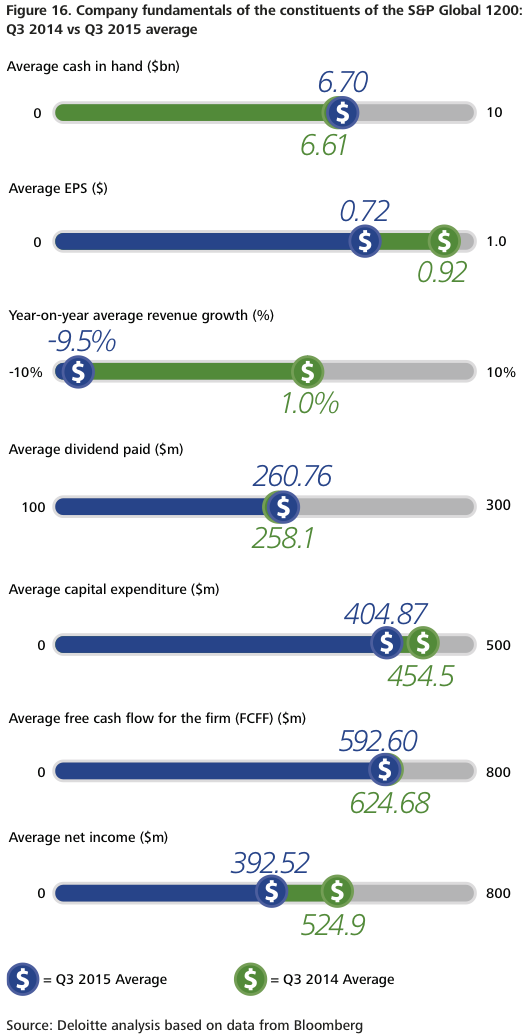
Driven by the weak yen, Japanese corporate profits are at their highest levels in over ten years. We estimate that the Nikkei 225 non-financial constituents have $507 billion in cash reserves, the second highest after the US corporate sector.
At the same time, despite the ongoing economic reforms, Japan remains saddled with falling domestic consumption compounded by a decline in real earnings, an aging population and GDP that shrank at an annualised rate of 1.2% in Q2 2015.
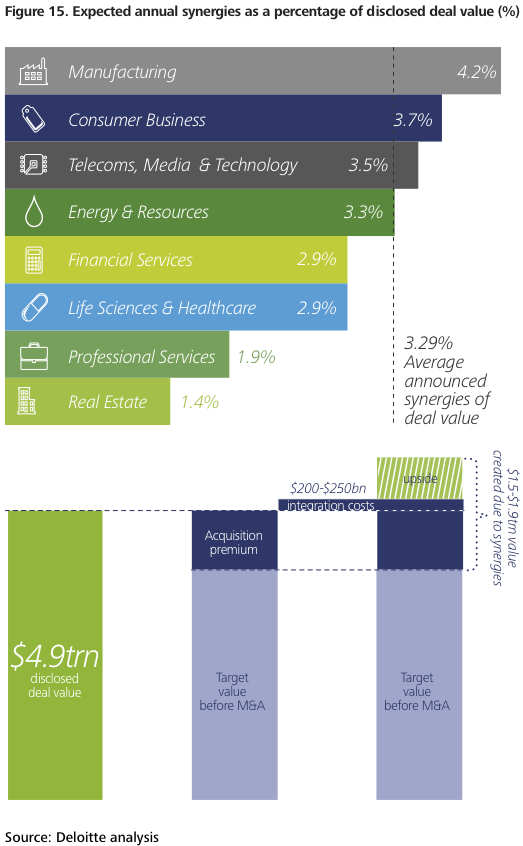
In response to these pressures, Japanese companies are actively looking abroad for growth prospects. So far this year they have made $56.4 billion worth of overseas acquisitions, which account for an astonishing 52% of all announced deals by value, by Japanese companies. This means that for the first time, Japanese outbound M&A figures are higher than domestic figures. Looking ahead, we expect this trend to continue as Japanese companies seek new growth opportunities.
When the ink dries
Since the beginning of 2014, companies have announced around $4.9 trillion worth of deals globally.3 Based on our research of the publicly announced cost synergies, we estimate that annualised cost synergies represent, on average, 3-4% of the transaction value. This means that companies have committed to realise between $150-$200 billion worth of annualised synergies.
If all the announced cost synergies are realised and sustained, this could add an estimated $1.5-1.9 trillion to the value of these companies, before consideration of the premium paid and associated integration costs.
Companies often underestimate both the complexity and true cost of integration. Based on Deloitte’s experience of delivering post-merger integration projects, we estimate that the total cost of integration represents, on average, 4-5% of the deal value.
M&A deals provide the corporate sector with a platform for growth, but companies would need to work hard to realise the synergies in order to create shareholder value. The stakes are indeed high and ensuring successful deal integration is likely to be near the top of boardroom agendas for many months to come.
Corporate barometer
Analysis of S&P Global 1200 company data
Despite the resurgence in M&A, the average cash in hand per company increased from $6.61 billion in Q3 2014 to $6.70 billion in Q3 2015.
The average earnings per share (EPS) decreased from $0.92 in Q3 2014 to $0.72 in Q3 2015.
The Q3 2015 revenues declined by 9.5 per cent compared to Q3 2014 revenues. In contrast, Q3 2014 revenues were one per cent higher than for the same quarter of 2013.
The free cash flow for the firm (FCFF) across the S&P Global 1200 declined from $624.68 million in Q3 2014 to $592.6 million in Q3 2015.
The average dividend payments per company increased from $258.1 million in Q3 2014 to $260.76 million in Q3 2015, continuing the trend of returning cash to shareholders.
Average capital expenditure per company fell from $454.5 million to $404.87 million, largely as a result of the slowdown in capex of the E&R constituents.
Finally, average net earnings have declined from $524.9 million in Q3 2014 to $392.52 million in Q3 2015.
Deal corridors
The US and UK lead cross-border M&A
Cross-border M&A has been one of the key features of 2015. So far this year $1.07 trillion in cross-border deals have been announced and this includes three of the ten largest deals in 2015.
Europe has been at the centre of cross-border deals, with European companies participating in 53% of all announced deals. The North America-Europe deal corridor has dominated, worth $311 billion. US companies have led the way, having announced $114 billion worth of deals in Europe, of which $44 billion are in the UK.
So far this year, the growth markets nations4 have announced $49.6 billion of acquisitions in G7 nations, whereas the G7 nations have announced only $30.7 billion in M&A deals in growth markets, the lowest in over a decade.
Cross-border deal flow is expected to be a key theme in the coming years, as major economies strike agreements and alliances to bolster trade. For instance the recently agreed Trans-Pacific Partnership between 12 Pacific-Rim countries, including the US, Japan, Canada and Australia, is the biggest global trade agreement in two decades.
Geographies
Overview
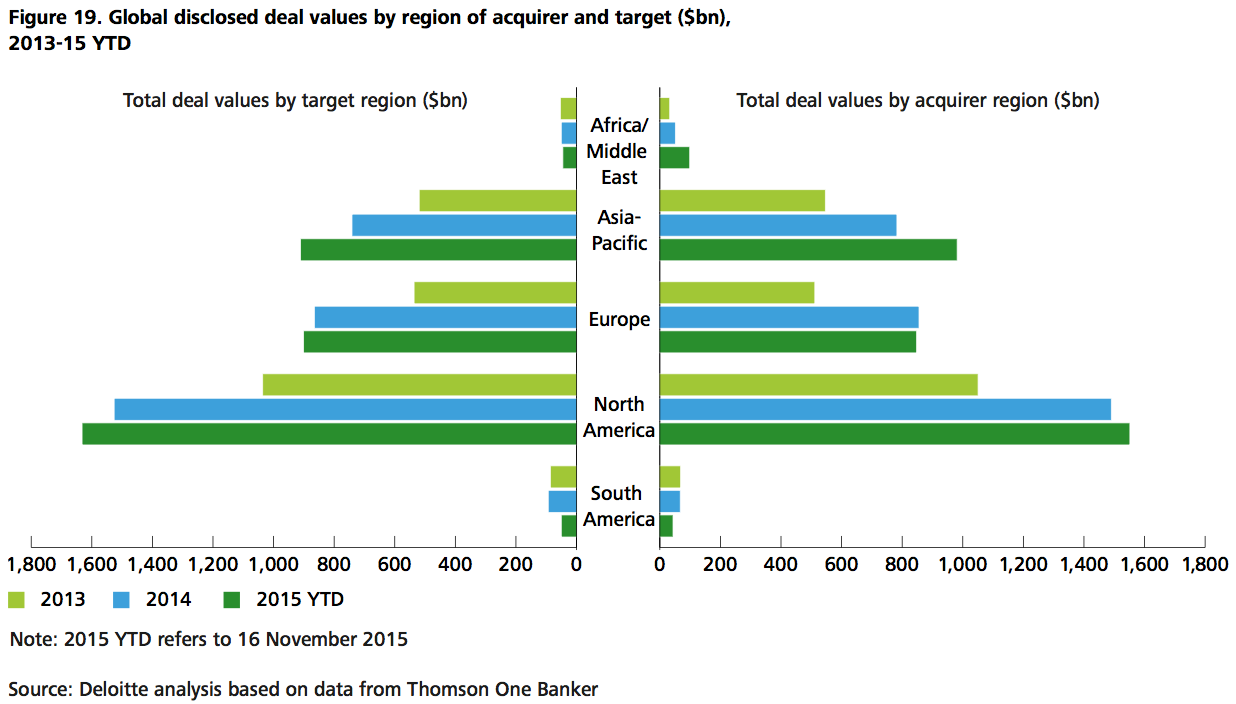
We are expecting this year to end with over $4 trillion worth of announced deals. The majority of the deals have been in North America, while Asia-Pacific overtook Europe for the first time.
North America
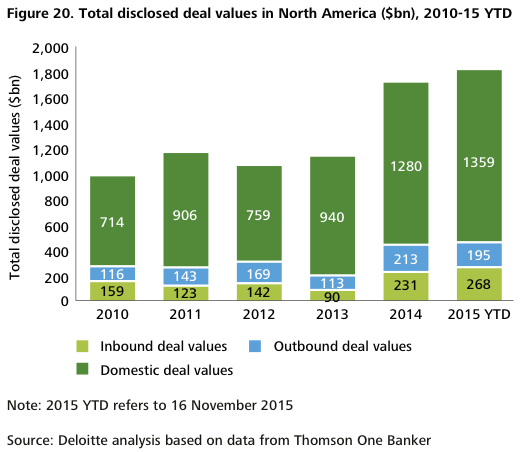
So far this year North American companies have announced more than $2.0 trillion worth of deals, surpassing the 2014 figure of $1.7 trillion. This is largely down to the resurgence in domestic M&A in the US, where currently $1.25 trillion worth of deals have been announced, the highest in 15 years. The US domestic M&A market benefitted from the boost falling energy prices gave to consumer spending.
The expected increases to the Fed rate are likely to strengthen the dollar, putting pressure on companies that are dependent on exports. However, a stronger dollar also presents some companies with deal opportunities as assets abroad will look more attractive in dollar terms.
Canadian companies announced $101 billion in outbound deals so far this year, the highest figure in over a decade. Activist involvement in the energy sector has increased as the pressure from falling energy prices started to mount.
Europe
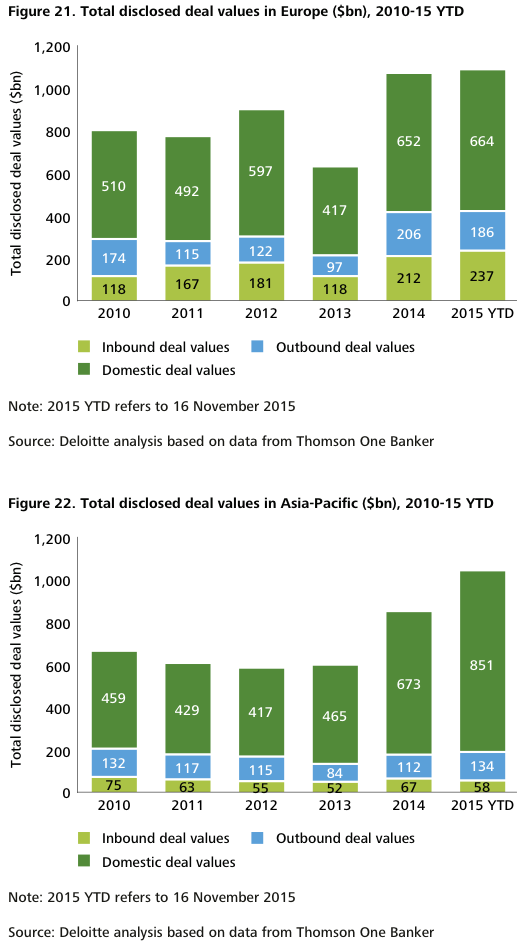
So far this year almost $1.1 trillion worth of deals have been announced involving European companies, surpassing the $1.07 trillion announced for the whole of 2014.
This includes $237 billion worth of inbound deals, the highest levels in well over a decade. US companies were the most active acquirers, announcing $114 billion worth of deals in Europe.
Companies in the UK have been the most sought after targets and so far this year they attracted $313 billion in M&A investment from both eurozone and overseas acquirers.
Looking ahead, we expect the weakness of the euro, favourable debt market conditions, attractive valuations and a positive growth outlook to offer opportunities for dealmakers.
Asia-Pacific
Domestic deals in Asia-Pacific have been the highest in over a decade, totaling $851 billion and largely led by China. While we expect the Chinese domestic M&A market to slow down in light of lower economic growth, outbound investment will continue as Chinese companies seek new markets.
M&A activity of Indian companies in value terms has grown 6.1% year on year during the first three-quarters of 2015, led largely by the return of private equity deals and an increase in cross-border deals by Indian companies.
The weak Australian dollar has given a boost to inbound M&A into Australia.
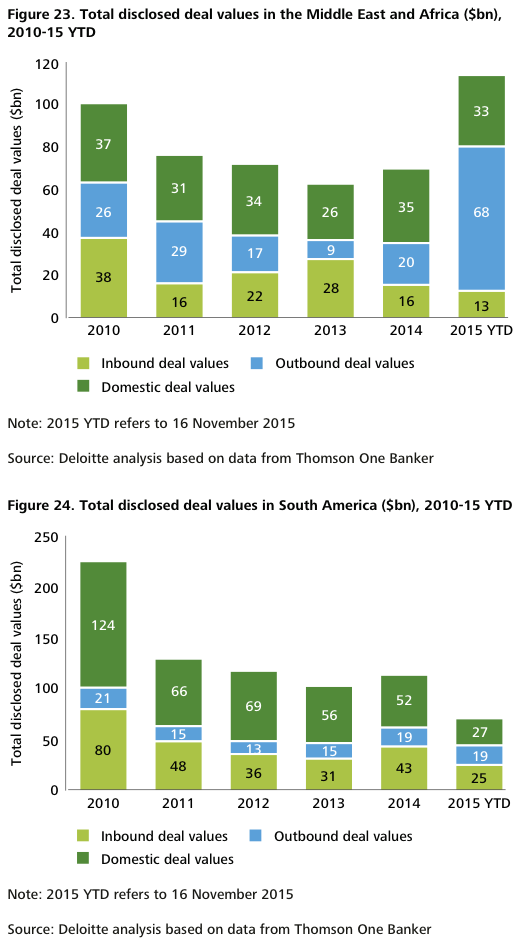
Africa and the Middle East
The sharp drop in oil and other commodity prices adversely impacted M&A activities for the natural resources exporting nations in the Middle East and Africa.
In Africa, M&A activities declined to $27.4 billion, the lowest level since 2012. African companies have been diversifying their portfolios and, led by South Africa, outbound acquisitions reached $9.5 billion so far in 2015.
In the Middle East outbound deal activities reached their highest levels since 2007. So far this year $67.8 billion worth of deals have been announced, primarily driven by Israeli acquisitions in the US.
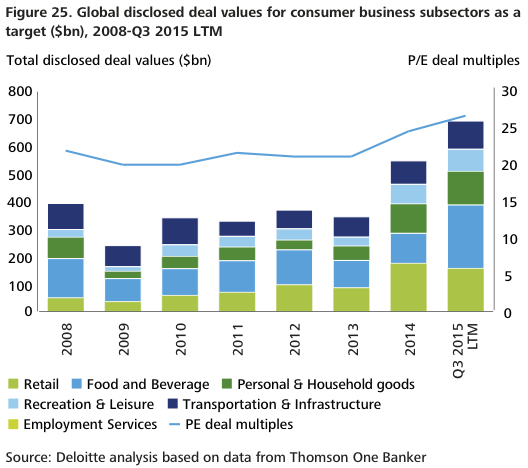
South America
The slowdown in China has hit the commodity exporting nations of South and Latin America hard. Indeed, M&A activity is the lowest since 2005 and Brazil, the largest economy in the region, is currently in recession.
M&A activity this year has largely been sustained by cross-border activities. So far $44.2 billion worth of cross-border deals have been announced, accounting for 62% of all deals by value. Italian and US companies have been the most active investors in the region, responsible for 50% of inbound deals by value.
Private equity has started to make a comeback in the region taking advantage of the attractive valuations. Other developments, such as the Pacific Alliance between Mexico, Chile, Colombia and Peru, are expected to boost to investment and M&A in the coming years.
Sectors
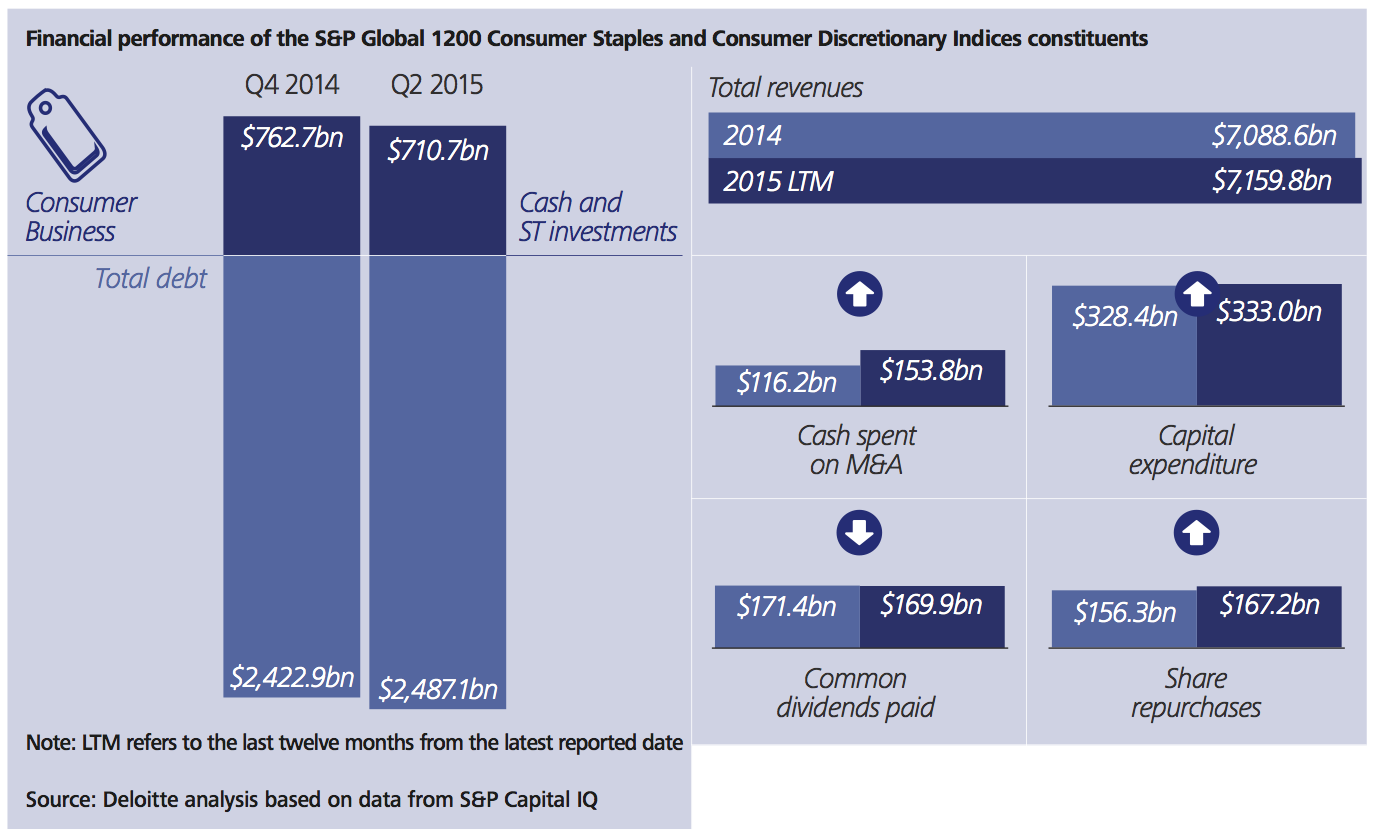
Consumer business
So far this year $655.5 billion worth of deals have been announced, of which $258 billion have been cross-border in nature, largely driven by US and European companies.
M&A activity is getting stronger in Asia, where companies announced $165 billion in deals. Asian acquirers accounted for the majority of these transactions. Looking ahead we expect Asian acquirers, led by China, to continue the pace in 2016.
Deal PE multiples currently stand at their highest since the financial crisis. The constituents of the S&P Global 1200 consumer indices have spent $153.8 billion of cash on M&A over the last 12 reported months. The 2015 LTM revenues remain stagnant and this could put pressure on companies to divest their non-core product portfolios and focus on core markets and products.
The consumer business sector is facing competition from non-traditional new entrants from the technology sector and this in turn could lead to participation in cross-industry strategic alliances and venture investments.
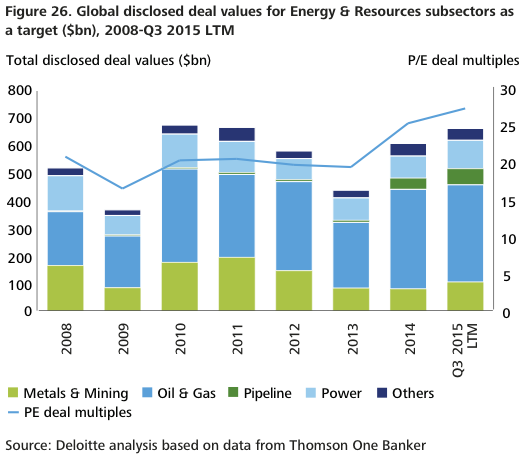
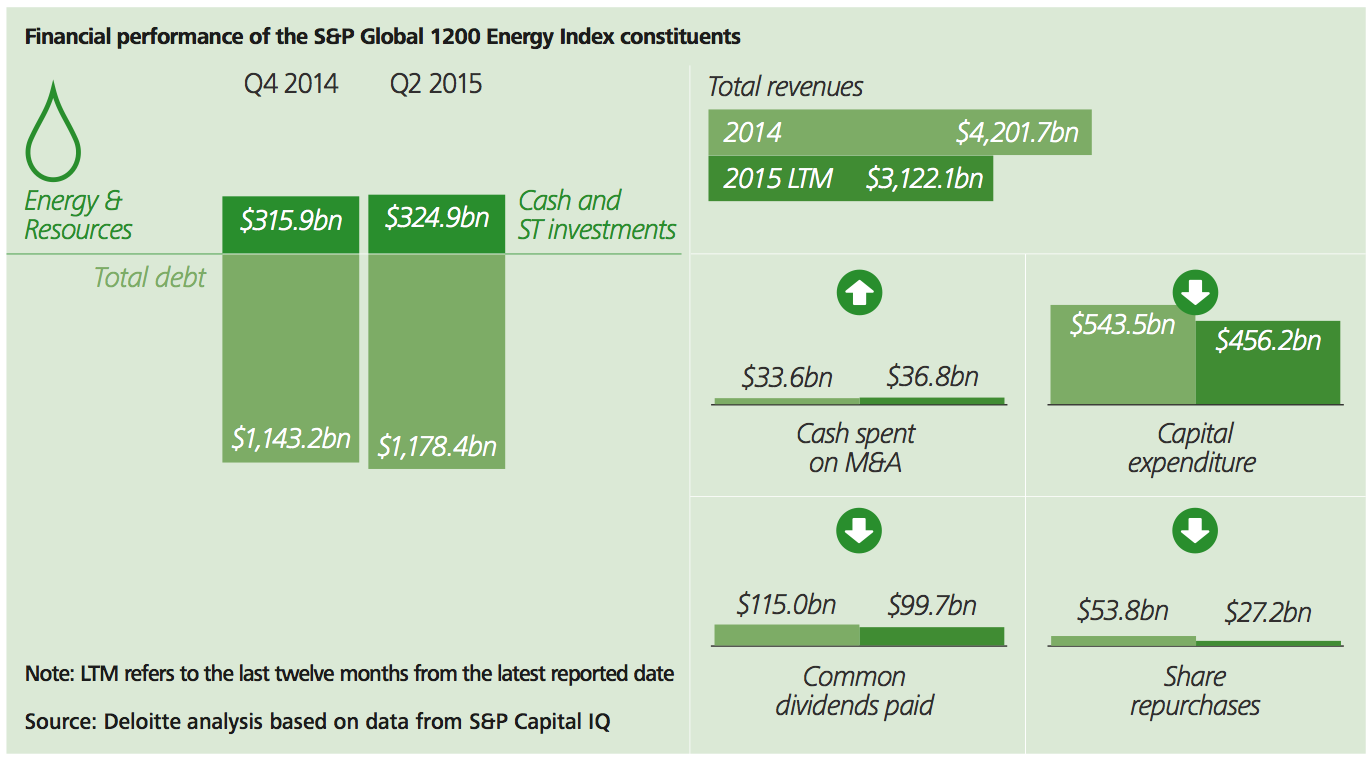
Energy and resources
The end of the commodity super-cycle has reverberated dramatically across M&A markets. Pressure on revenues has meant that companies are looking to consolidate. So far this year $534.8 billion worth of deals have been announced, which includes ten mega deals, double the number of mega deals announced in 2014.
However, deal volumes have declined for the fourth year in a row. This is closely linked to the commodity price index, which also has been on the decline during the same period.
Comparing the last 12 reported months with 2014 levels for the S&P Global 1200 energy constituents, capital expenditures have been badly hit.
Looking ahead, we are expecting companies to divest their portfolio of assets and further consolidation to take place. We also expect private equity deals to make a comeback in this sector.
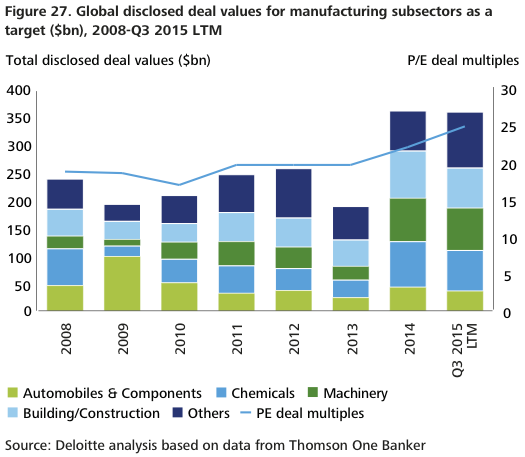
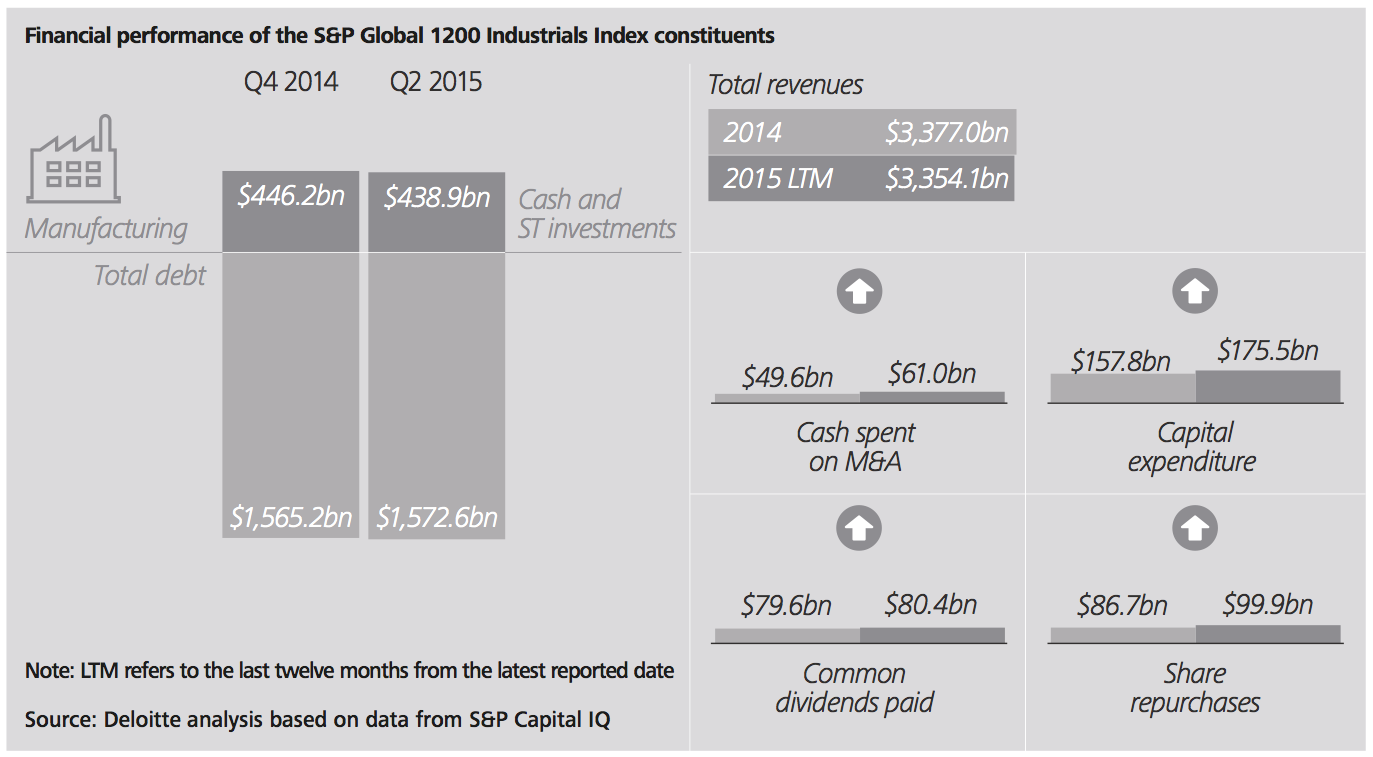
Manufacturing
So far this year $297 billion worth of deals have been announced, keeping pace with 2014. There has been a sharp increase in deal values in the aerospace and defence sectors as well as in the paper and forest products sectors.
There were $101.2 billion worth of deals announced in Asia-Pacific region, the same level as the whole of 2014 with the majority of acquirers from Asia itself. In contrast, so far $90.3 billion worth of deals have been announced in Europe, compared to $120.3 billion in 2014.
Comparing the last 12 reported months with 2014 levels for the S&P Global 1200 Industrial constituents, we are expecting an increase in both cash spent on M&A activities and capex investment.
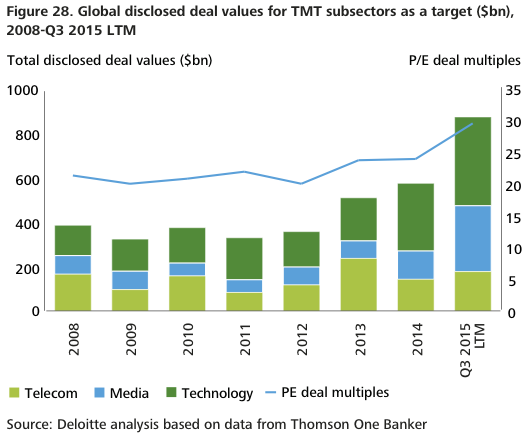
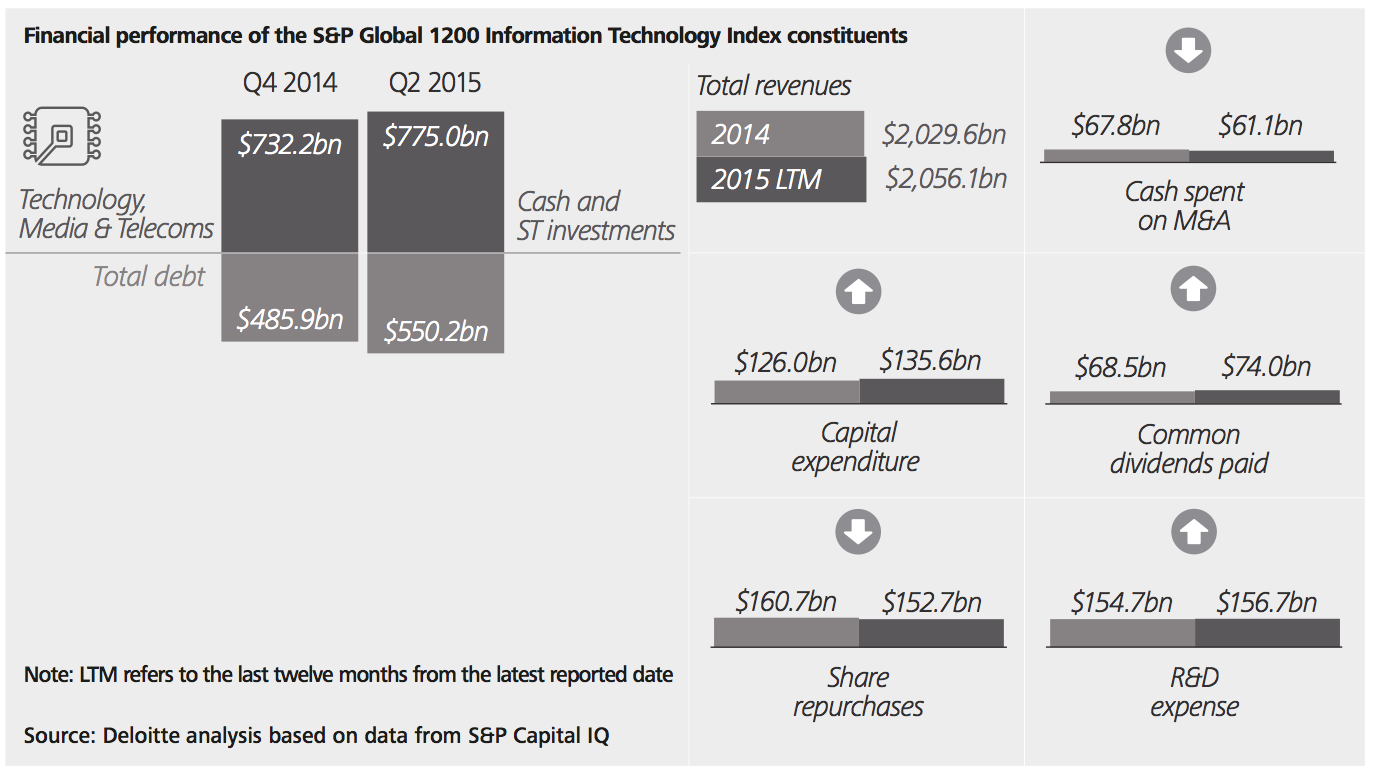
Technology, media and telecoms (TMT)
TMT companies have accounted for 30% of the mega deals announced this year. So far this year, $928 billion worth of deals have been announced, significantly higher than the $581 billion announced during the whole of 2014. This has largely been led by the continued convergence and consolidation in the sector. However, Q3 2015 LTM volumes are 11.9% higher than in the preceding period.
Asia has emerged as a major player. So far this year $224.3 billion worth of deals have been announced with Asian companies as targets, a significant increase over the $103.3 billion announced in 2014.
The deal P/E multiples have started to increase and they are now at their highest levels since the financial crisis. Comparing the last 12 reported months with 2014 levels for the S&P Global 1200 IT constituents, IT companies have started to spend less cash on M&A transactions.
There has been a slowdown in the share repurchase programmes, and coupled with an increase in both capex and R&D spend, it seems the sector is looking to target growth opportunities.
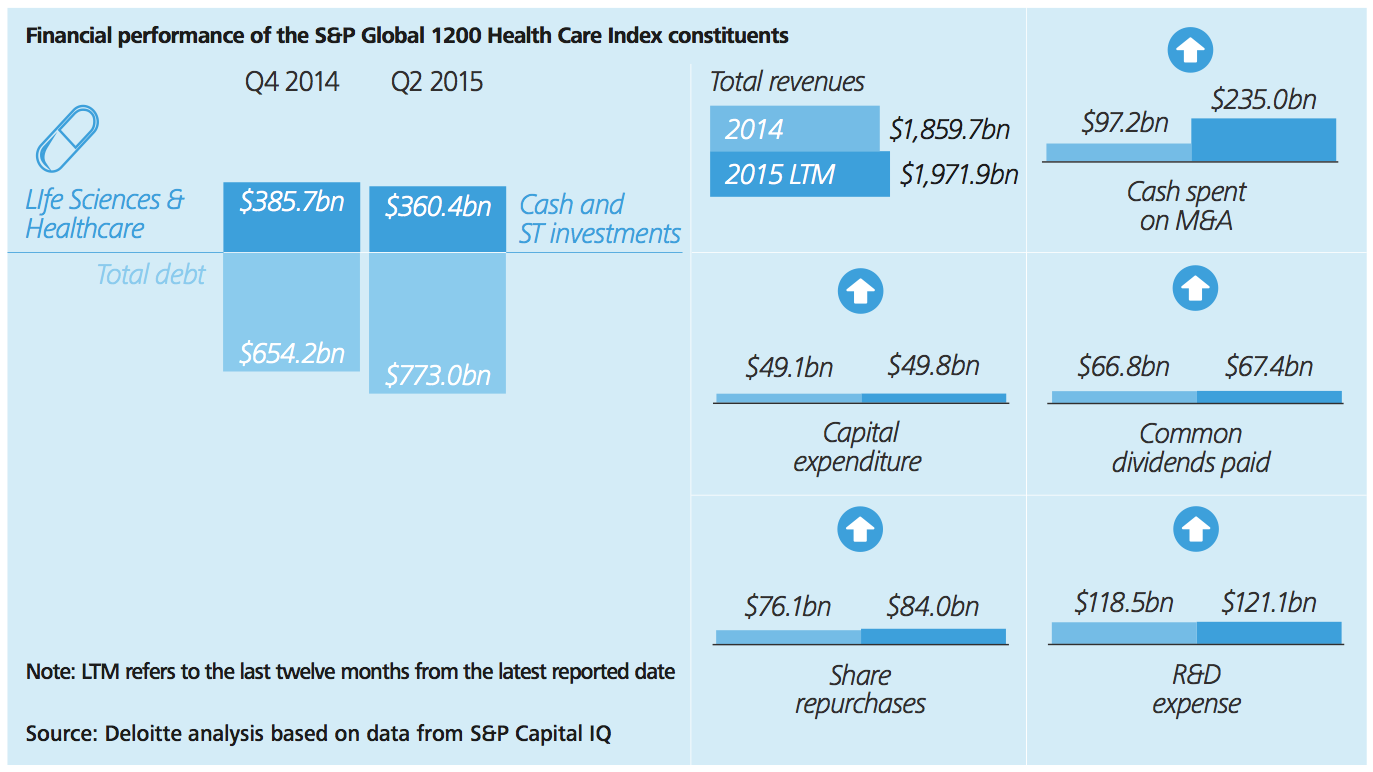
Life sciences and healthcare (LSHC)
The LSHC sector has announced $574 billion worth of deals so far this year, including the estimated $146 billion Pfizer–Allergan deal, which is the largest of the year. We estimate that over a quarter of these transactions were cross-border in nature.
North American companies led the way and accounted for nearly 69% of announced deals.
The combination of challenging economic conditions, pricing pressure from US health reforms and favourable credit conditions have boosted dealmaking.
Deal valuations are currently at their highest levels since the financial crisis. Over the last 12 reported months the S&P Global 1200 healthcare constituents have spent $235 billion of cash on M&A, resulting in a decline in cash reserves and an increase in corporate debt, largely due to issuance of acquisition related bonds.
However, their R&D spend for the last 12 reported months increased by 2.2% over their expenditures in 2014.
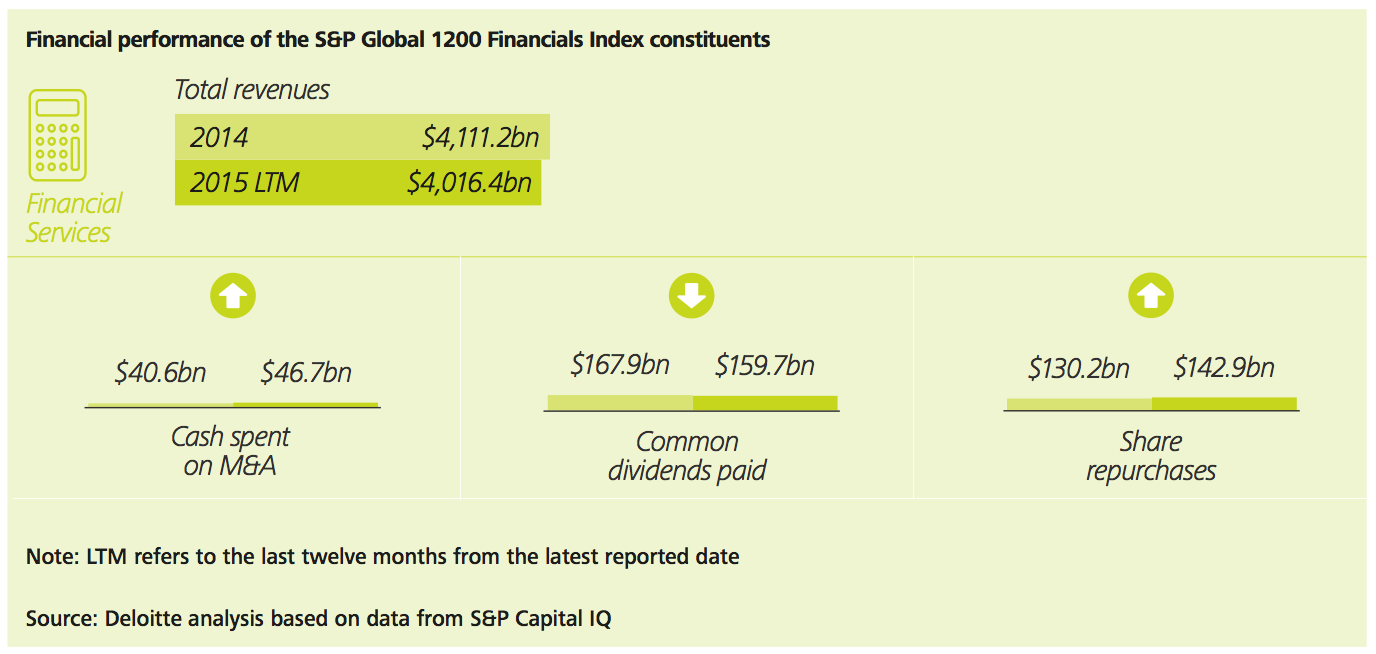
Financial services
So far this year $321 billion worth of deals have been announced. This was led by the sharp rebound in dealmaking in the insurance sector, where the long awaited consolidation resulted in $98.1 billion worth of deals.
Dealmaking in the banking sector has been dominated by non-core divestments. In recent years challenger banks have emerged, particularly in the UK, but some of those were acquired this year by long established banks that were seeking to enter new markets.
The threat of disruptive innovation looms large and many financial services companies have launched venture funds to tap into the burgeoning fintech sector.
The alternative lending sector, including crowdfunding and peer-to-peer lending, has grown significantly in recent years. Some lending platforms have started to acquire others to expand into new markets. At the same time, the range of platforms in the market means we can expect consolidation in the future.
Charts we like