
By Paul Elie, Harry Gruits and Christopher Becker– PricewaterhouseCoopers
Year in Review
2014 – 365 days, 543 deals, $38.7 billion total aggregate disclosed value
Overview
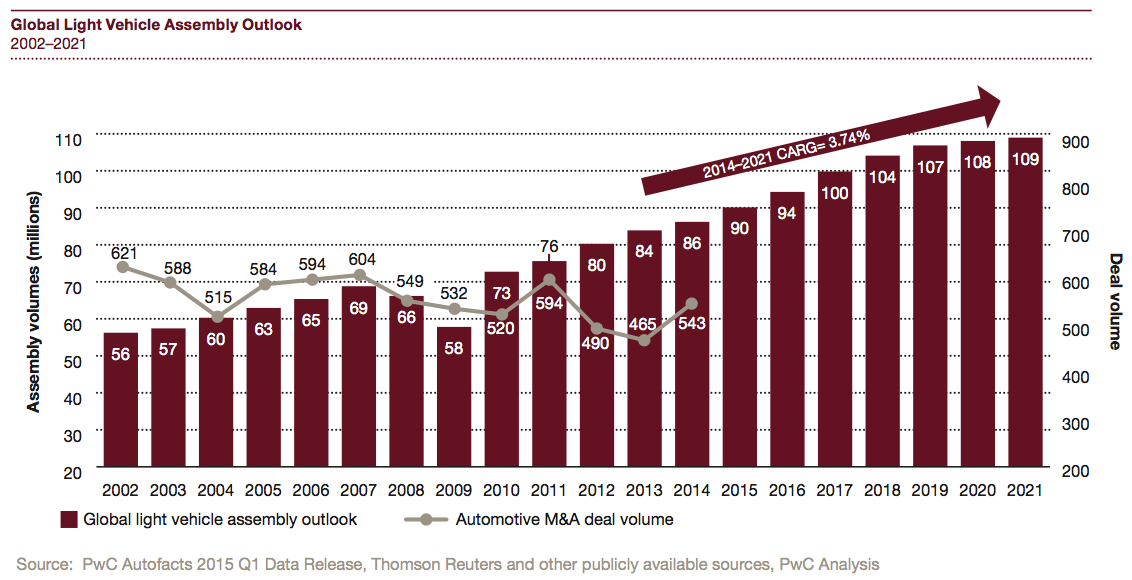
For the first time in three years, 2014 marked an increase in M&A activity. The notable uptick registered across the board in deal volume, value and size. These indicators suggest the overall strength of the automotive industry has returned after several sluggish years and is revving its engine toward the future. PwC’s Autofacts expects the industry to add 23 million units of production between 2014 and 2021, for a compounded annual growth rate (CAGR) of 3.4%. Along with record growth, there are unprecedented global challenges that are influencing business strategies and actions in many industries:
• Demographic changes and profound shifts in global economic power are causing massive upheavals in demand. For automotive, the demographic changes will be led by an influx of younger workers who will drive more flexible labor practices and incentives needed to attract and retain millennials. PwC’s Autofacts predicts that 90% of global growth in car sales through 2020 will come from emerging markets, with China accounting for half of that. The shifts in global economic power also signal a rebalancing from a Western dominance to a realignment where production centered regions are shifting to consumer oriented economies.
• Urbanization and climate change have implications for the future of many industries including automotive. Globally, more than half of the population lives in cities with that number expected to increase. The United Nations (UN) estimates that by 2015, there will be 22 mega cities (populations over 10 million), with 17 located in developing economies. Further, demand for energy is forecasted to increase by as much as 50% by 2030, and water withdrawals by 40%. The impact of these energy challenges could make traditional methods of manufacturing and commerce difficult or even impossible in some places. Sustainable solutions will become at odds with the need for resources to drive growth.
• Technology Drives Changes in Auto – Perhaps the largest global influencer is continued technology integration into all industries, including automotive. PwC’s 2014 CEO Survey reports that 86% of US CEOs say technological advances will transform their business over the next five years. This includes many implications across the industry from the ability to gather and analyze data in real time, to non- traditional competitors, increased transparency and the speed of technological change.
In automotive, new technologies are dramatically changing vehicles, from the advent of the ‘connected car’ and enhanced driver support to better fuel efficiency and new or improved powertrains. Entirely new industries are being created to manage these breakthroughs and develop the processes to integrate new technologies into the automotive business model. An increased focus on fuel efficiency has many OEMs ramping up efforts to manufacture electric and hybrid vehicles with increased range and capabilities. In general, OEMs and suppliers alike will need advanced manufacturing capabilities to leverage global platforms while still catering to local / niche preferences.
Increased demand for connected car systems and technologies also are creating big business opportunities. As software and IT components rise from 30% to 50% of a car’s value, there are numerous inroads for big tech companies to increase their automotive presence. This is especially the case for internet giants with tens of billions available for new ventures. However, with limited room to differentiate through technology, the number of viable OEMs likely will fall. In some cases, joint ventures are being considered due to a foreign partner offering access to valuable technology. In China, strict intellectual property protection encourages leading OEMs to invest in advanced technologies for electric vehicles, autonomous driving and cutting edge technologies central to car sharing and improving urban driving conditions.
Automotive growth and the pace of global changes have the potential to drive M&A activity at every turn ranging from raw material sourcing to final assembly. To stay competitive, companies must collaborate across the automotive network, anticipate hurdles and have strategies in place to work through roadblocks. In many cases, M&A can serve as part of a collaborative strategy for companies to remain viable and vibrant in the ever-changing global automotive industry.
The numbers tell the story…
Deal volume: Global automotive deal volume increased to pre-recession levels, transacting 543 deals. In comparison to 2013, this represents a 17% increase—the highest growth rate since 2002.
Deal value: Global automotive deal value rose to 38.7 billion—a massive increase of 78% over 2013 and its highest level since 2011.
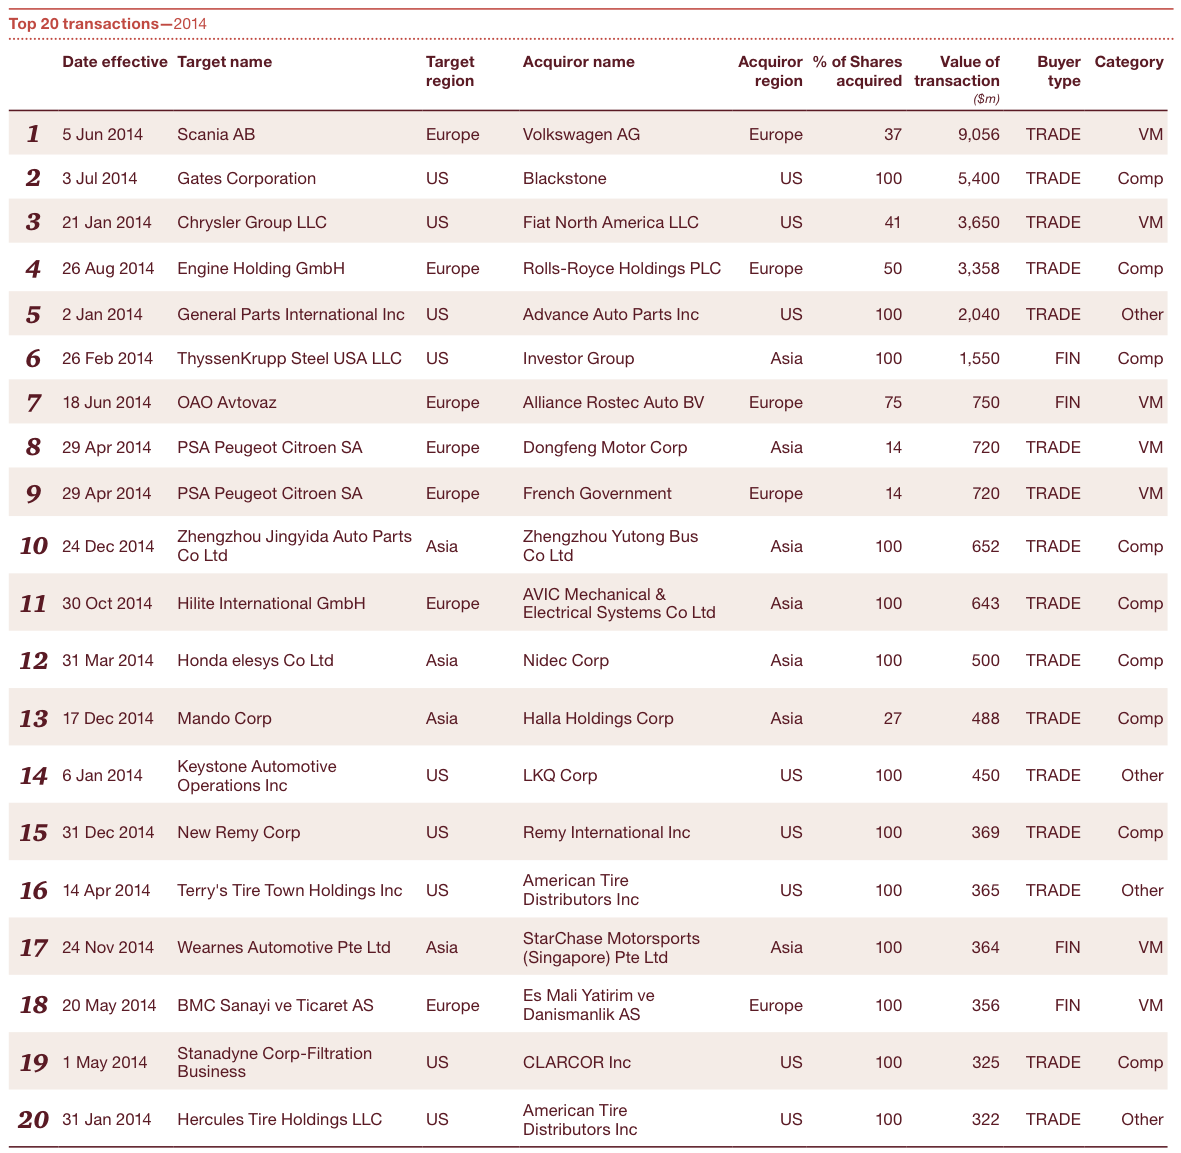
Deal size: Globally, average automotive deal size increased by a rousing 52%, primarily driven by megadeals:
• Volkswagen acquisition of Scania—$9.1 billion
• Blackstone acquisition of Gates Corporation—$5.4 billion
• Fiat North America purchase of remaining shares in Chrysler Group LLC— $3.7 billion
• Rolls-Royce Holdings acquisition of Engine Holding GmbH–$3.4 billion
• Advance Auto Parts purchase of General Parts International–$2.0 billion
• Undisclosed financial buyer of ThyssenKrupp Steel–$1.6 billion
Global automotive
A signal of the return of automotive strength, 2014 represents a turning point in the industry. While Automotive M&A deal volume has declined for five of the last six years, 2014 saw an increase in activity. The 543 deals closed in 2014, represent a 17% increase over 2013 deal volume of 465. This growth is the highest rate since 2002.
Automotive assembly continues to grow at a healthy rate and companies are beginning to use the markets to convert their cash holdings into strategic investments in other businesses.
At 543 deals (181 disclosed value), total disclosed value rose to $38.7 billion. This increase of 78% was primarily driven by megadeals that culminated in a total aggregated disclosed value of $25.1 billion.
In addition to the overall increase in deal value, the average global auto deal size increased 52%, rising from $141 million to $214 million. Global Automotive now is enjoying the highest average disclosed deal value that it has seen since 2009.
Plus, of the 181 disclosed deals, six were megadeals (value greater than $1.0 billion) and 37 had values between $100 million and $1.0 billion.

Top 20 deals
Automotive assembly
Despite economic volatility, political uncertainty, and an unprecedented number of vehicle recalls dominating headlines, vehicle assembly grew at a modest 2.7% in 2014. According to PwC’s Autofacts, Assembly reached 86.2 million units in 2014 and the industry is expecting to add approximately 23 million units between 2014 and 2021. This represents a compounded annual growth rate (CAGR) of 3.4% in assembly.
Much of the assembly growth is attributable to China and North America, which increased by 574 thousand and 1.7 million units, respectively. While China’s growth was largely expected, North America benefited from assembly localization and another year of strong sales.
For much of the year, the industry crowded the headlines as a result of the mass number of global vehicle recalls. It was estimated to surpass the 100 million-unit mark. And then, toward the end of the year, the industry was faced with another hurdle as oil prices fell nearly 50%. The immediate impact is mixed between regions. North America has benefited from an uptick in pickup and SUV sales, but other regions, like Russia, have been hurt by the lower oil prices. In the long-term; however, Autofacts believes the oil issues present the industry with another challenge as increasingly stringent global emission standards have not changed. The vehicles that meet these emission standards are lesser profitable vehicles (sedans). Therefore, the automotive industry will experience a downward pressure on sales until these standards are revised.
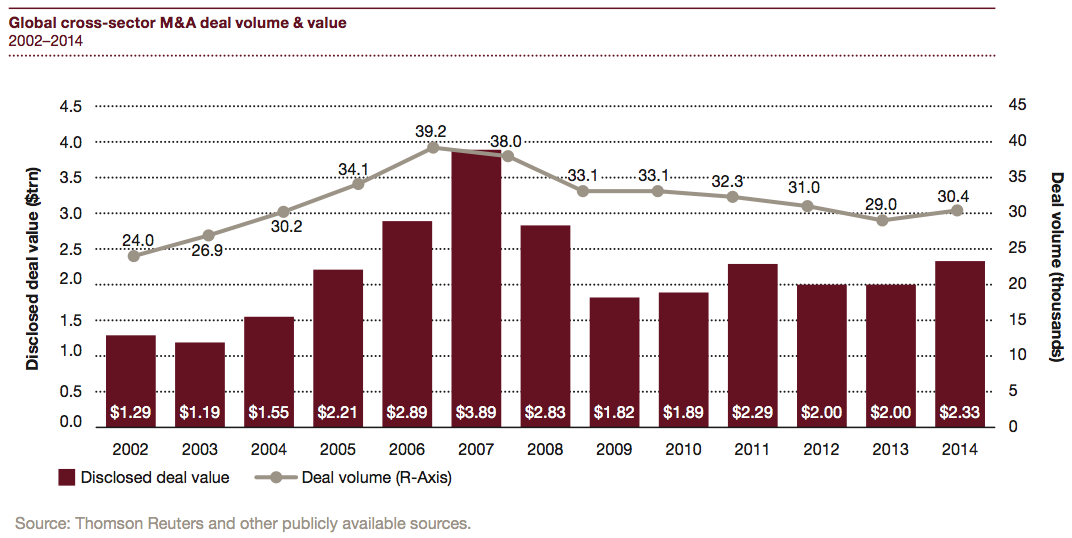
Cross-sector M&A
As evidenced in the chart below, recent global cross-sector M&A is trending upward, though not near 2007 or 2008 levels. In 2014, both deal volume and value increased by 5% and 17% respectively.
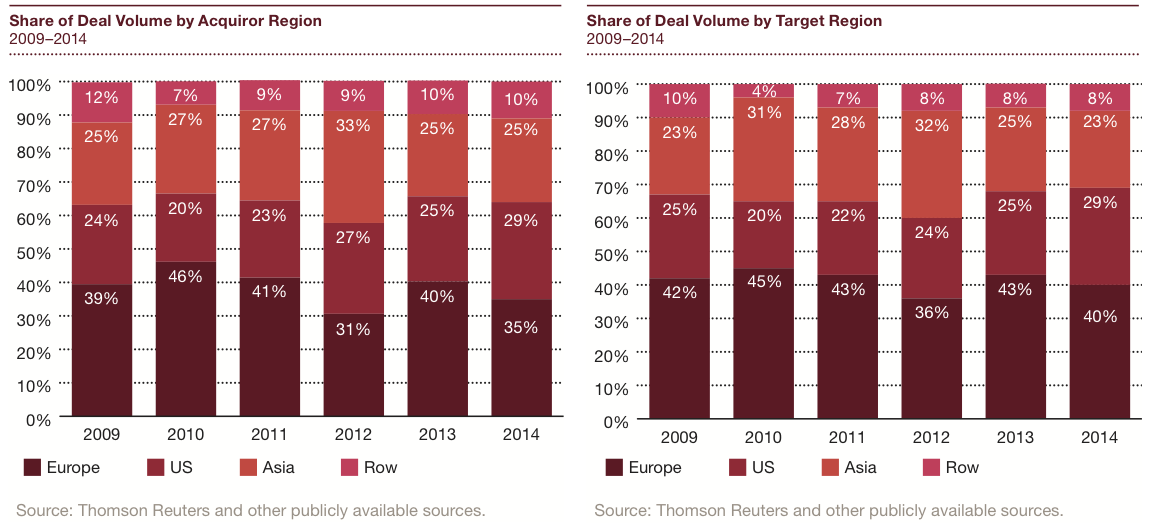
Insights into regions
The big picture
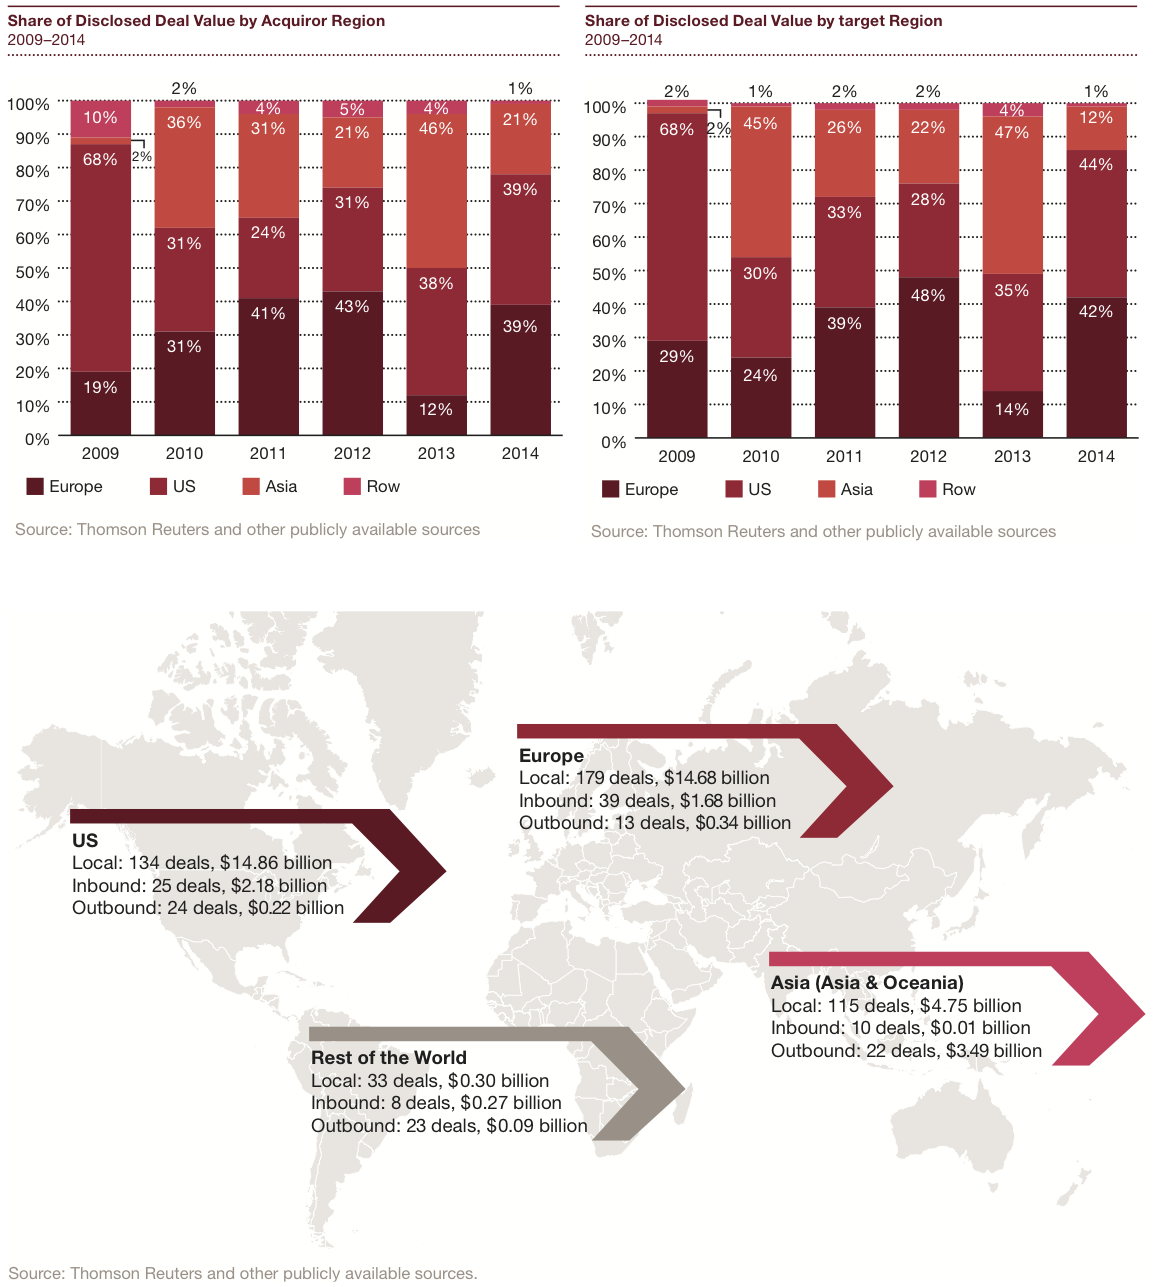
Across all regions, local deals dominated the M&A activity with 89% of all deal value (or $34.6 billion) local deals. The five largest deals of the year were transacted locally in Europe or North America.
United States
In 2014, North America led the M&A market with steady growth in both deal value and volume. Its share of deal value by acquirer and target region was the highest amongst the regions at 39% and 44% respectively. Deal volume increased 39% to 159 in 2014 when compared to 2013 volume of 114. This increase primarily is attributable to an increase in local deals as well as a modest uptick in foreign countries acquiring US assets. This strong growth highlights the ongoing improvement in the economic landscape within the United States, and is evidence of companies’ willingness to return to the M&A markets to seize strategic and growth opportunities.
Europe
Europe’s share of deal volume by acquirer and target region marginally declined in 2014; however, Europe maintained its position as the most active region after a split in 2012. On the other hand, Europe experienced major growth in its share of deal value, likely due to two megadeals that occurred locally within Europe. Share of deal value by acquirer region increased from 12% to 39%, and its share by target region increased from 14% to 42%. This is indicative of European assets being more favorable to investors as well as European based companies starting to invest more in M&A than we have experienced in the last few years.
Asia
Asia’s share of deal volume by both acquirer and target remained relatively flat in 2014 at 25% and 23%, respectively. However, the region saw a major decline in its share of deal value by both acquirer and target as only one megadeal involved an Asian company. For 2014, most of the mega deals were focused on the United States and Europe. Overall, deals increased in Asia by 10%, primarily attributable to Asian companies interested in local assets.
Analyzing industry segments
The big picture
Deal value accelerated in 2014 compared to the same timeframe in 2013—increasing significantly in all categories.
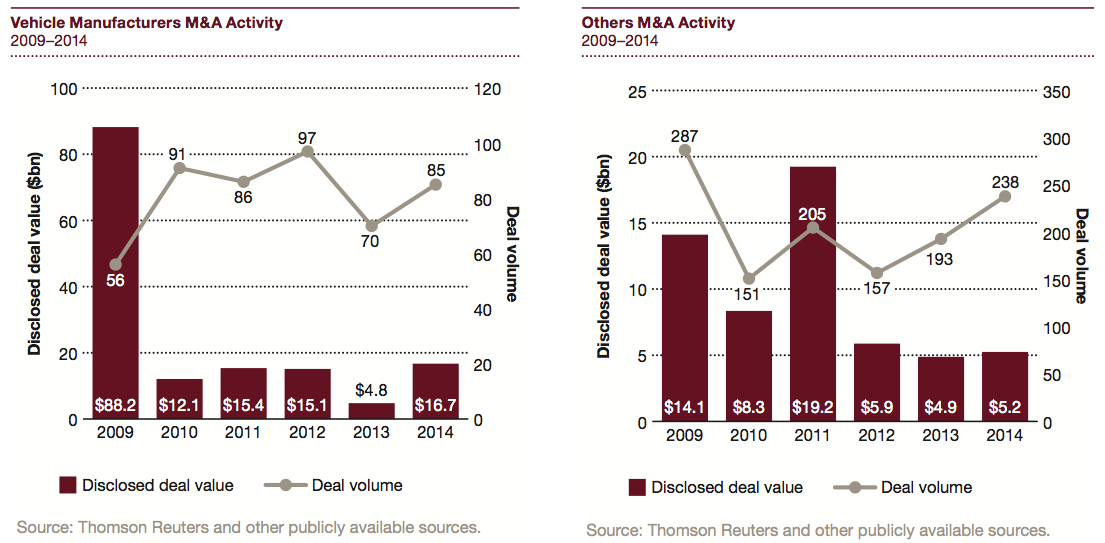
Vehicle Manufacturers
Vehicle Manufacturers were the leading contributors to deal value growth with an increase of $11.9 billion, which was primarily driven by two mega deals with a total aggregate disclosed value of $12.7 billion. Further, vehicle manufacturers’ deal volume increased over the last year by 21%.
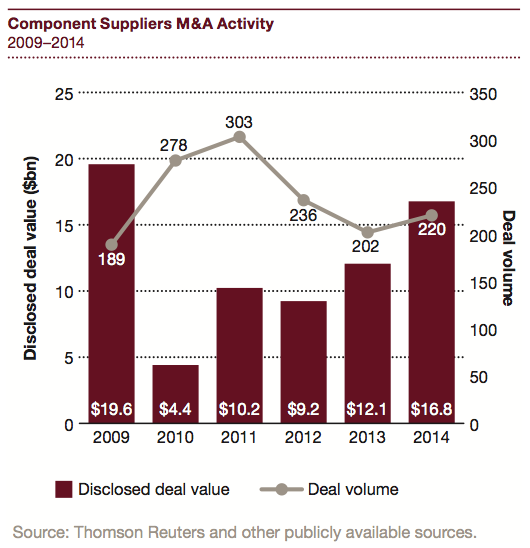
Components Suppliers
Components Suppliers saw deal volume rise from 202 deals in 2013 to 220 deals in 2014, representing an increase of 9%. Deal value followed suit, with an increase of $4.7 billion from $12.1 billion in 2013 to $16.8 billion in 2014. These upturns were mainly fueled by the Blackstone acquisition of Gates Corporation for $5.4 billion. A large amount of smaller deals have also provided stability to both deal volume and value growth.
Others
After significant declines during the peak of the recession, the Others category—including retail/dealership, aftermarket, rental/leasing and wholesale, etc.—is continuing to recover. The segment transacted 238 deals in 2014, representing a 23% increase from 2013.
Who’s buying: Financial versus Trade Buyers
The big picture
Both Financial and Trade Buyers saw increases in deal volume and deal value in 2014, but Trade Buyers stole the show with a 132% increase in deal value.
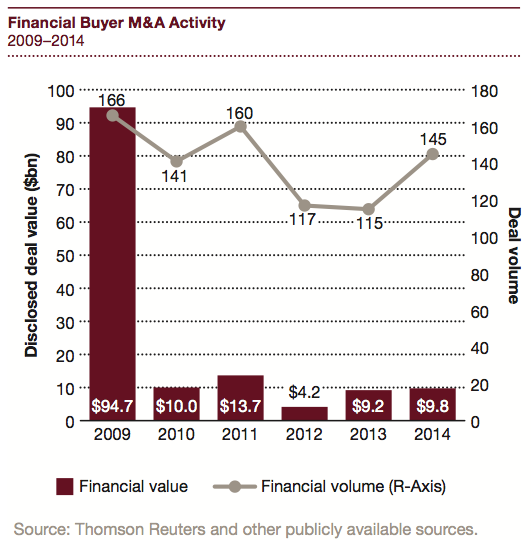
Financial buyers—Green light, red light
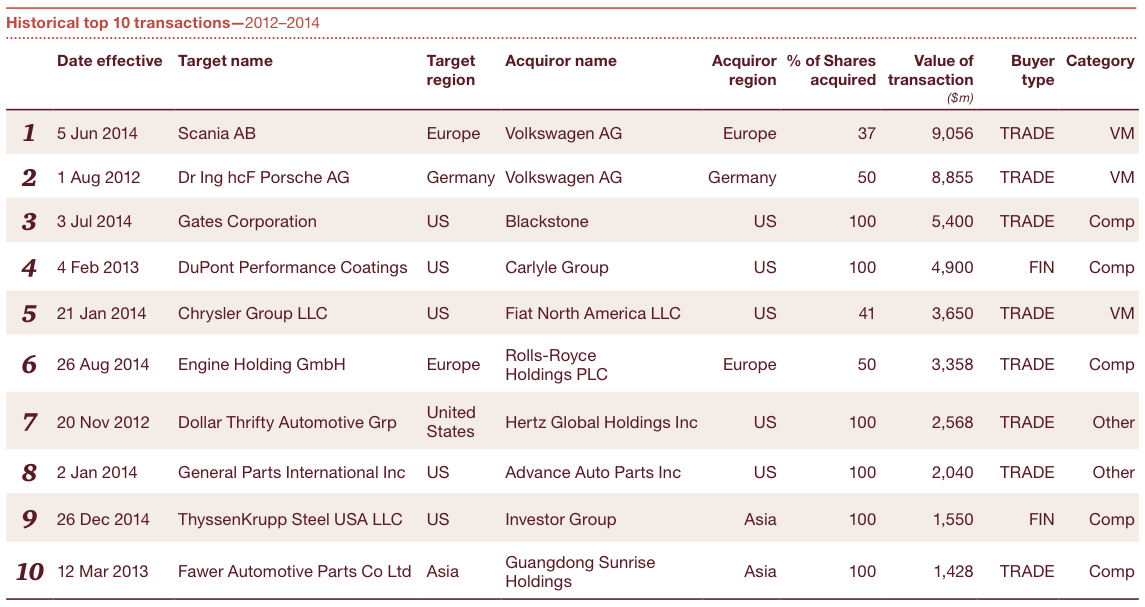
Financial buyers saw increases in both deal value and deal volume in 2014. Financial volume increased by 26%, which represents the first increase in this category in two years. However, this increase in volume only delivered a 6% increase in value, which can likely be attributed to the fact that Carlyle’s acquisition of DuPont Coatings in 2013 was significantly larger than any single transaction in 2014.
Trade buyers—green lights ahead
2014 brought a monumental increase in the value of initiated deals for Trade Buyers, more than doubling the total value from 2013. This increase was significantly driven by megadeals, as four of the five largest deals were with Trade Buyers.

The Road Ahead
A positive outlook for Automotive M&A
While the industry as a whole has faced challenging times over the past several years, the markets seem to have finally pulled themselves out of the worst global economic downturn in recent history.
Given the robust Automotive Assembly outlook, PwC expects the M&A markets to continue to stay strong as companies continue to use M&A to improve technology, grow customer base, and expand geographic footprint.
Green lights on the road to the “ultimate connected car”
Over the long term, we see M&A playing an increasingly vital role in the development and integration of new technologies into vehicles to improve safety, fuel efficiency and connectivity.
While we anticipate ‘all systems go’ for a steady rollout of innovative new technologies over the next several years, clearly the timing and degree of growth in the global automotive markets will depend on the future state of the economic climate around the world.
We predict that these factors will spark automotive M&A growth going forward:
On the road to prosperity—fueling future growth
• High levels of liquidity on corporate balance sheets
• Strategic initiatives to expand market share and grow customer, technology and product portfolios
• Strong economic recovery and pent-up demand in developed countries, such as the US
• Resumption of trend line economic growth in China and India