
EY’s Firepower Index and Growth Gap Report 2016
By Andrew Forman – Ernst & Young
Contributors: Jeff Greene, Chris Morrison
As the specialty pharmaceutical sector sees its ability to pursue large acquisitions evaporate, long-promised organic growth from big pharma new drug launches has finally arrived. But a renewed focus on value-based pricing, staunch competition across key therapeutic battlefields and consolidating payer clout may weaken the industry’s ability to reach revenue targets for both new and legacy therapeutics.
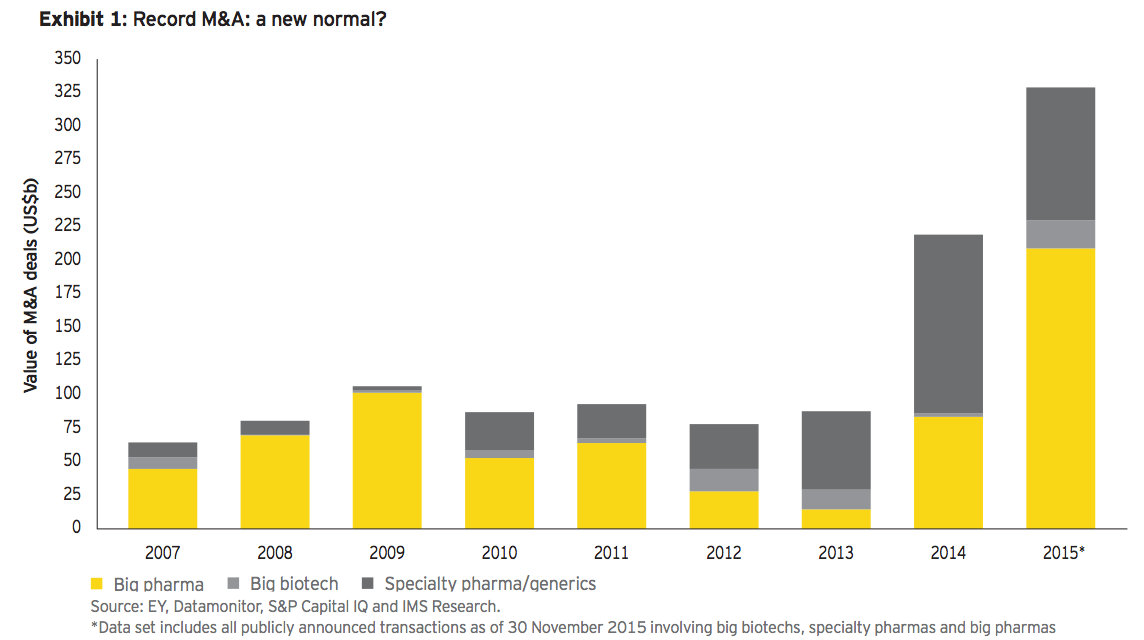
In 2015, biopharmaceutical industry mergers and acquisitions soared above 2014’s record US$200 billion aggregate value. With the US$160 billion Pfizer/Allergan megamerger announcement, the year’s dealmaking frenzy has vaulted over US$300 billion (see exhibit 1). The major strategic forces that shaped 2014 continued into 2015, as specialty pharmaceutical companies led by Valeant, Endo and Teva, as well as big biotechs such as Celgene, took advantage of historically low interest rates to pursue focus, scale and growth opportunities. But big pharma, although involved in a few significant deals, notably the blockbuster “Pfallergan” combination, remained largely on the sidelines. This reluctance — chalked up at times to the high valuations enjoyed by target companies — was particularly striking given the industry’s largest players’ “growth gaps” (see box for definitions).
These growth gaps persist despite an ongoing R&D productivity renaissance and the continuation of 2014’s balmy regulatory climate. The favorable conditions combined to boost drug approval statistics (45 new molecular entities approved in the US in 2015 as of late December, a two-decade high), analysts’ revenue forecasts and the health prospects of millions of patients suffering from diseases as varied as heart failure, uncontrolled high cholesterol and a diverse set of cancers. In fact, big pharma’s aggregate growth gap remains stuck at around US$100 billion (our projected shortfall in 2017 revenue for the subsector compared to overall market growth, based on data from S&P Capital IQ), thanks in part to foreign exchange headwinds.
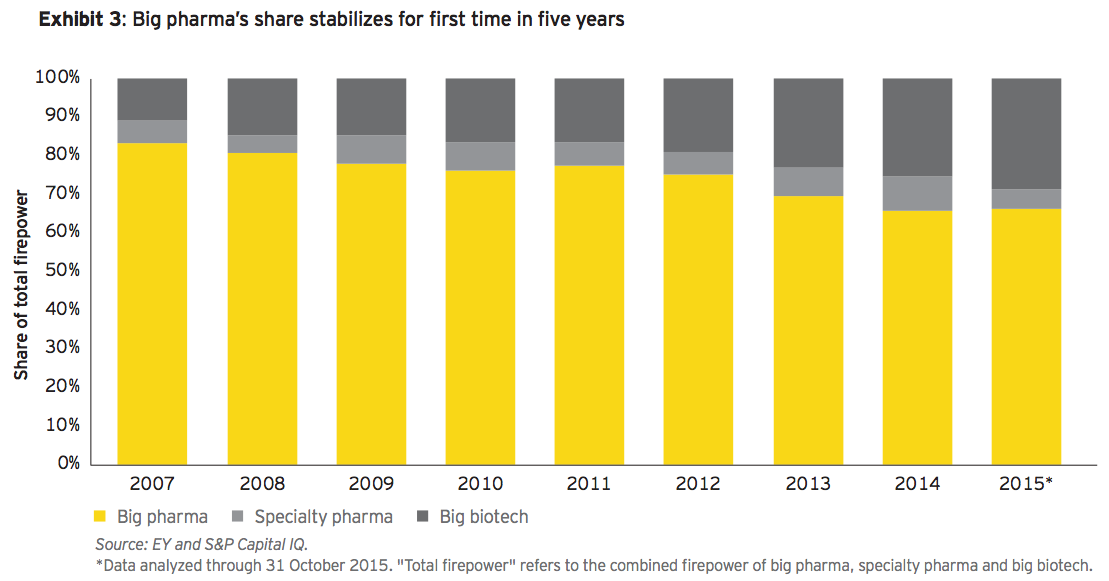
But at the same time, big pharma’s firepower, while drifting slightly lower over the past 12 months, has stabilized in overall share for the first time in five years (see exhibit 3). The closure of Pfizer’s acquisition of Allergan would indeed shrink the gap some 20%, representing the first meaningful reversal in trends for big pharma in the past four years (and since our inaugural January 2013 Closing the gap? report). Will others now follow?
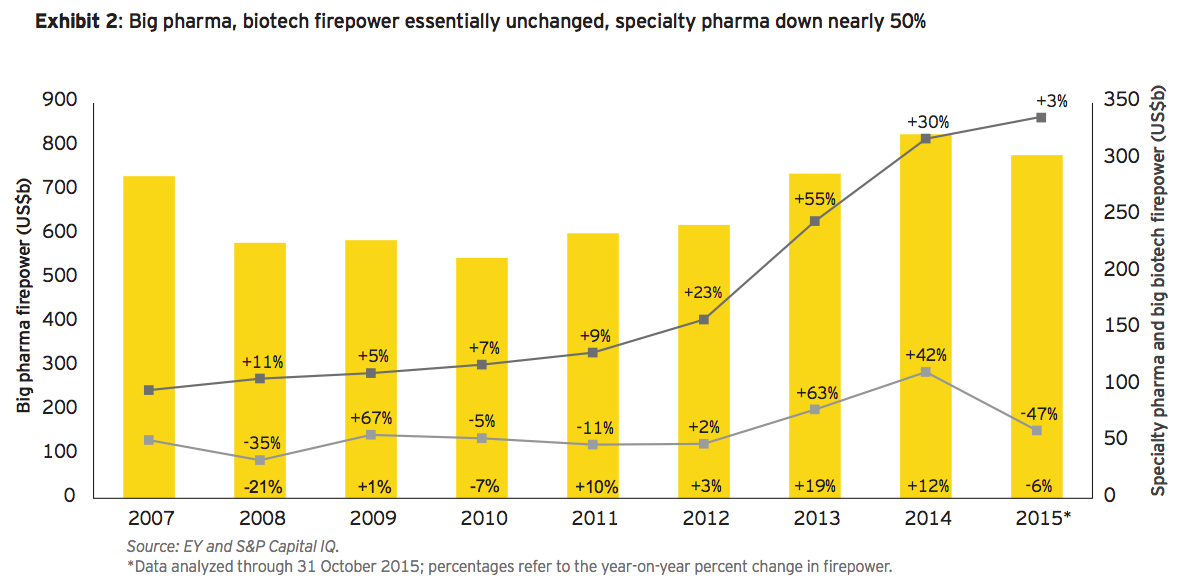
Those favorable dynamics are in large part due to a steep decline in firepower held by the specialty pharmaceutical segment. Not only did specialty pharmas take advantage of their increased firepower by spending it — six of 2015’s top biopharma deals by total valuation were in the specialty or generics sectors — what was left over has eroded. Falling equity valuations, particularly for those with serial M&A business models characterized by increasing leverage, have driven debt/equity ratios much higher. This “firepower squeeze” has effectively stopped further M&A ambitions in their tracks.
And so big pharma has finally seized the industry M&A agenda. Although target valuations remain buoyant — so much so that transformative deals may be out of reach for all but a few biopharma behemoths — growth opportunities lurk among smaller players. After Pfizer’s bid for AstraZeneca was thwarted in 2014, it turned to a smaller target, buying Hospira for US$17 billion in early 2015, and eventually agreed to merge with Allergan. Likewise, AbbVie tried to buy Shire but instead acquired Pharmacyclics for US$20 billion.
Importantly, big pharma (and indeed big biotech) should pursue sensible and targeted M&A while it has the firepower to do so. Existing growth gaps are increasingly likely to be expanded by payer strategies to contain costs, as became increasingly evident as 2015 drew to a close. Biopharmas could face additional growth challenges thanks to payer pushback on both new and old therapies, resulting in slower launch trajectories for newly approved drugs and the faster decline of existing drug franchises.
Definitions
The growth gap is the difference in the sales growth of a biopharma company or biopharma sub-sector (e.g., big pharma) relative to overall drug market sales. It is based on IMS Health’s global drug market forecast and analysts’ estimates of company sales.
The EY Firepower Index measures a company’s ability to do M&A based on the strength of its balance sheet. Together, a company’s market capitalization, cash equivalents and debt capacity provide the “firepower” for deals. Thus, a company’s firepower increases when either its market capitalization or its cash and equivalents rise — or its debt falls.
Focused acquisitions and divestitures have become paramount. Deals targeting narrower therapeutic battlegrounds, emerging and exciting scientific opportunities, geographic strongholds and strategic gaps will drive the M&A agenda.
Meanwhile, portfolio transformation via divestitures and bolt-ons is working. Divesting companies have three times as much firepower as their non-divesting counterparts and have generated greater total shareholder return. Moreover, forward-thinking companies are shifting resources to the therapeutic battlegrounds where they can compete as top-tier players while continuing to prune elsewhere. Merck’s US$9.5 billion acquisition of Cubist to bolster its presence in acute care, for example, came on the heels of divesting its consumer health business to Bayer. The shift toward focus — building strategic franchises across fewer disease areas — should accelerate as companies identify gaps in their pipelines and product portfolios that will further drive M&A.
Our previous Firepower Index and Growth Gap Report, issued at the outset of 2015, described the specialty pharma inversion frenzy fueled by inexpensive debt. Those firepower fireworks generated twice the previous decade’s average deal value and saw big pharma re-enter the fray, accounting for about US$90 billion of the roughly US$200 billion dealmaking total in 2014 (the majority of that activity was through the divestiture and acquisition of operating divisions).
But it was tax-advantaged specialty pharmas — led by the acquisitive Actavis and its Forest Labs and Allergan acquisitions — that stole the show. A seemingly perpetual capital market tailwind continued into 2015, lifting stocks through July and creating a seemingly endless supply of newly public biotech companies.
As 2015 closed, however, the biopharma bull market had lost the staggering momentum it had built up over the past few years. The Nasdaq Biotech Index was up a more modest 10.9% (compared to 2013’s 66% and 2014’s 34% gains) and the ARCA NYSE Pharmaceuticals Index was up just 1.6% year to date, narrowly outperforming the S&P 500, which slipped into negative territory.
Top 2015 deal trends
• The US$160 billion Pfizer/Allergan merger takes total announced deal value to new heights. This largest-ever life sciences deal (and third largest in any industry) closes Pfizer’s growth gap. How will others use their firepower?
• As big pharma emerges from the shadow of its patent cliff, new breakthrough therapies insignificant unmet disease areas, like oncology and infectious disease, have begun to drive industry growth. But internal R&D successes won’t be enough for many of the industry’s biggest players who will still need to turn to M&A to reach growth goals.
• Payer consolidation, the increasingly fraught debate over drug pricing, the arrival of biosimilars and competition in key therapeutic areas may dampen biopharmas’ growth projections. This should exacerbate growth gaps, fueling more M&A.
• Focused acquisitions and divestitures have therefore become paramount. Deals targeting narrower therapeutic battle grounds,emerging and exciting scientific opportunities, geographic strongholds and strategic gaps will drive the M&A agenda.
• Is US$200billion M&A the new normal? As deals drive more deals, competitors are forced to respond. Few large companies have the financial wherewithal to pursue transformative acquisitions, but targeted M&A and divestitures have and should continue to pick up the slack.
Big pharma returning to growth
Meanwhile, big pharma has returned to growth after half a decade of patent-cliff hibernation. As 2015 drew to a close, overall industry leaders were enjoying accelerating growth sparked by sales of newer products that represented significant medical breakthroughs. New immuno-oncology therapies from Bristol-Myers Squibb Co. and Merck & Co., Pfizer’s Imbrance for breast cancer and Johnson & Johnson’s diabetes treatment Invokana are at the vanguard of a new wave of blockbusters.
Though secular growth trends of some companies have been obfuscated by foreign exchange headwinds and the recent spate of asset and operating division divestitures, real innovation (with the pricing power that innovation has historically commanded in the US) is driving growth at a large percentage of big pharma companies. The group’s firepower has held relatively steady around a cumulative US$800 billion, and its share of total firepower has also stabilized for the first time in five years, at nearly 70%, strengthening big pharma’s competitive advantage over other players (see exhibit 3).
Specialty pharma stalls
Specialty pharma companies have, on the contrary, expended much of their firepower (see exhibit 2). Their debt-financed M&A bonanza has ratcheted up debt/ equity (market capitalization) ratios to 34%, nearly three times greater than big pharma and big biotech. Valeant Pharmaceuticals is a prime example. Between early August and early November 2015, the company lost more than two-thirds of its market value, driving its debt/equity ratio over 100% as inquiries about its use of specialty pharmacies collided with an erupting national debate in the US about drug pricing. These aggressive dealmakers are now effectively sidelined, and indeed, some have become inversion targets themselves (such as Allergan).
Specialty pharma companies have expended much of their firepower. Their debt-financed M&A bonanza has ratcheted up debt/equity ratios to 34%, nearly three times greater than big pharma and big biotech.
As good as it gets? More firepower and a broader range of targets
Most big pharmas can afford to pursue three or four smaller targets, shrinking or closing growth gaps with focused M&A.
As firepower shifts back to big pharma (see exhibit 3), the industry’s historic leaders are turning more aggressively toward targeted M&A. As the valuations for companies that would be targeted for transformative deals have risen and eclipsed big pharma’s firepower, strategies have evolved and M&A informed by rigorous portfolio analysis should result in multiple, smaller, targeted transactions. A larger, maturing universe of target companies creates more M&A optionality across the industry with implications for how big pharma may wield its firepower:
• For transformational deals, equity will need to be a larger component. As Pfizer-Allergan demonstrates, all-equity deals remain possible, and in this case was necessary to achieve the requisite 40%+ Allergan ownership threshold for Pfizer to invert. But make no mistake, this deal still requires significant firepower — to be used for dilution-limiting share buybacks on the back end.
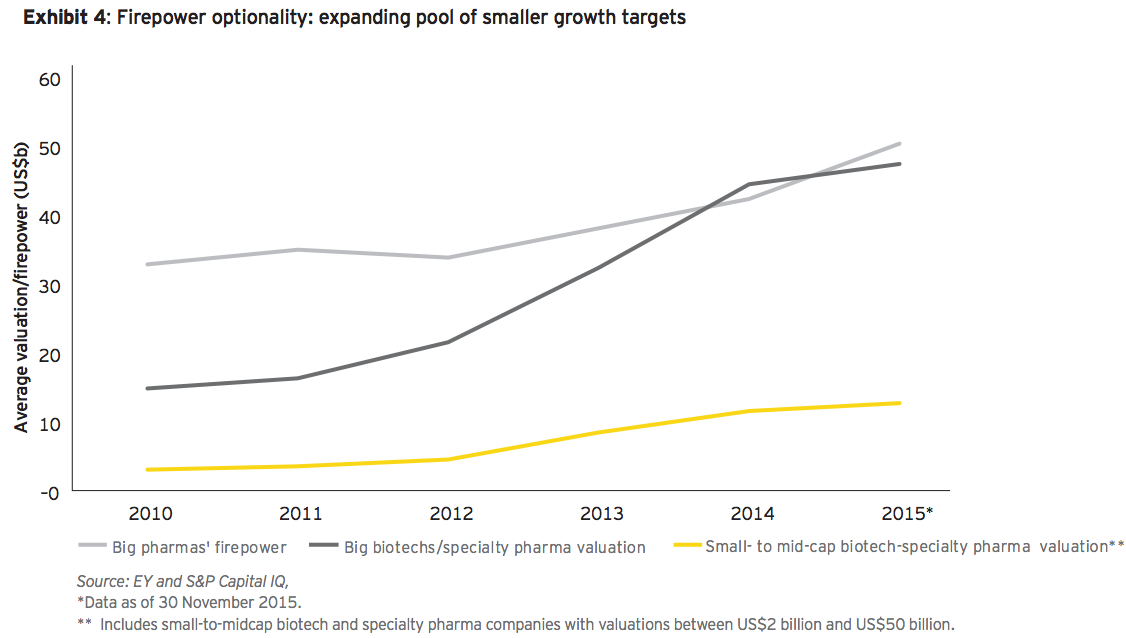
• In a more focused environment where companies believe internal product pipelines can fuel growth, targeted acquisitions of faster-growing small- or mid-cap companies can demonstrably fill important portfolio and pipeline gaps. This coincides with the emergence of new growth targets: a cadre of some 50 biotechs (including newly public companies), specialty pharma, generics, and even consumer and animal health companies with average valuations that amount to just one-fourth of average big pharma firepower. An added benefit is that most big pharmas can afford to pursue three or four of these smaller targets, shrinking or closing growth gaps with focused M&A (see the yellow line in exhibit 4).
• This broader group of smaller targets is also enjoying rising firepower. This means more companies may be buyers, as exemplified by Depomed’s acquisition of Johnson & Johnson’s Nucynta pain franchise for US$1 billion, an inconceivable deal just a few years ago. Compared to a year ago, three times as many companies — now close to 60 — possess at least US$3 billion in firepower. This means more competition for targets but also a longer list of potential acquirers for divestitures.
Big pharmas, big biotechs and large specialty players are already deploying firepower in more focused ways, informed by strategic portfolio frameworks and longer-term strategy. They’re trying to upend or defend leadership positions in specific therapeutic or geographic areas, instead of indiscriminately targeting new revenue sources.
For example:
• Receptos (May 2013 IPO) was acquired in July 2015 by Celgene for US$7.3 billion. That deal was driven by the progress of Receptos’ ozanimod S1P receptor inhibitor, in late-stage trials in ulcerative colitis and multiple sclerosis. For Celgene to become an inflammation and immunology leader alongside its extensive presence in oncology, the big biotech needs to build a portfolio with best-in-class drugs and ozanimod may fit the bill.
• Auspex Pharmaceuticals (February 2014 IPO) was bought by Teva Pharmaceuticals in March 2015 for US$3.2 billion to bolster its CNS franchise. Auspex’s late-stage Huntington’s disease drug SD-809 is a deuterated version of a drug from one of Teva’s competitors and fits the brand-and-generics player’s preferred risk profile.
• ZS Pharma (June 2014 IPO) was acquired by AstraZeneca for US$2.7 billion in November 2015 to help the British company bulk up its metabolic disease franchise. ZS’s lead drug, ZS-9, a potassium binder, is a potential best-in-class hyperkalemia treatment, not far behind the field’s first-in-class compound.
Increased payer pressure creating new growth gap?
Despite record new product approvals flowing across many disease areas, payer pressure to constrain costs for new and mature products may affect the industry’s revenue growth projections, if not its optimism.
Despite record new product approvals flowing across many disease areas, payer pressure to constrain costs for new and mature products may affect the industry’s revenue growth projections, if not its optimism. Payers have pursued unprecedented scale — examples include the mergers of Aetna with Humana and Anthem with Cigna, and continued consolidation among pharmacy benefit managers — and with that scale will come greater negotiating clout.
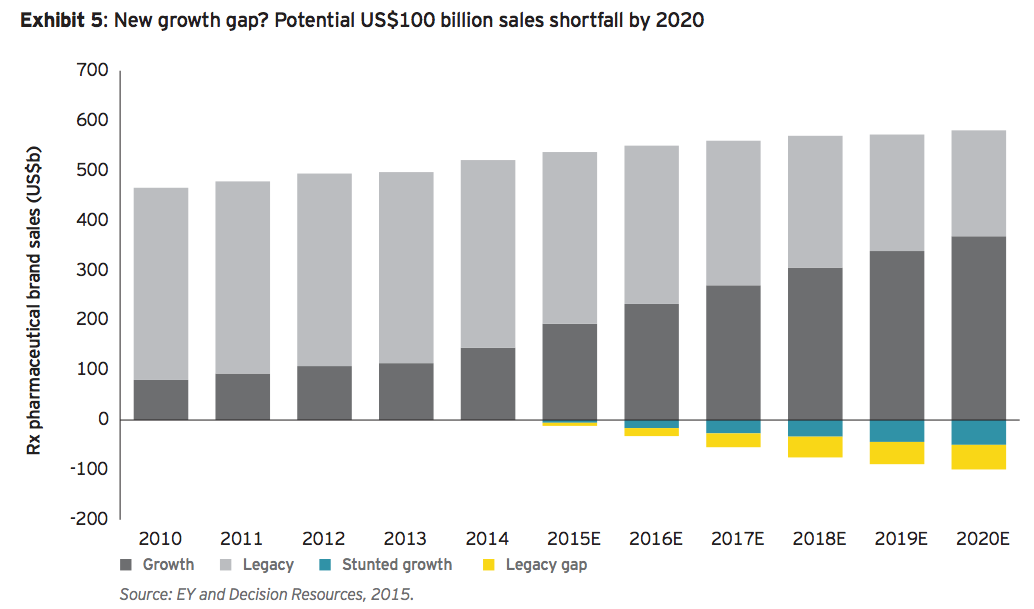
Projecting potential sales growth shortfalls — very much like predicting that growth in the first place — is more art than science. Decision Resources forecasts that all drugs (old and new) with positive growth from 2015 through 2020 will have an imputed 17% CAGR and a collective increase of roughly US$200 billion in industry revenue. But what if those forecasts were affected, even slightly more than expected, by the tools payers are increasingly using to help contain costs, particularly in the area of specialty drugs (here, the uncertain impact of biosimilars may be a wildcard). If projected growth slows to 14% CAGR, that would amount to an additional US$50 billion growth gap in 2020 (see exhibit 5). While some analysts may be incorporating certain downside risks into their outlooks, individual management teams appear to be more bullish on their companies’ prospects. But even without worst-case scenarios playing out, growth trajectories may be weighed down as payers apply the tools of their trade.
Similarly, Decision Resources projections impute a 9% annual decline for therapeutics on the downslope of their revenue curves. This correlates to about US$165 billion in lost sales from drugs whose aggregate sales in 2014 were around US$375 billion.
And some of those legacy therapies remain core to companies’ strategies. As an example, Sanofi CEO Olivier Brandicourt said during the company’s November 6 analyst meeting that Sanofi projected its global diabetes sales to decline at an average annualized rate of between 4% and 8% over the next three years. He noted that besides developing its internal pipeline and moving toward a disease management strategy with partner Google, “expanding our diabetes portfolio is one of our top priorities for business development.”
Those core mature franchises projected to decline represent more than 70% of 2014 brand sales. Could a similar growth gap emerge if that decline accelerated? If the annual decline sped up to 11%, it would create a US$25 billion gap; at 13%, the gap widens further to US$50 billion in lost revenue by 2020.
Taken together, this mix of potentially slower than projected growth and accelerating erosion from legacy drugs represents a 3% growth headwind that would amount to an additional industry-wide growth gap of about US$100 billion. Roughly half of this burden would be felt by big pharma. To the extent that these trends materialize, IMS’s global growth projections (which include aggregate spending across all drugs, including generics in all markets) could dampen as well, which would in effect ameliorate growth gaps.
Sharper savings tools
Meanwhile, steep discounts and aggressive rebating strategies in competitive markets have become the norm. The more comparable the drugs, or the more competitors in a particular marketplace, the more aggressive payers can become (as was seen with the near-simultaneous launches of anti-PCSK9 cholesterol-lowering drugs in mid-2015). Value-based pricing initiatives, including pay-for-performance schemes (whereby patient outcomes determine a drug’s price), have been discussed for treatments as diverse as Novartis’ new heart failure medicine Entresto and potentially curative gene therapies for orphan diseases.
This mix of potentially slower than projected growth and accelerating erosion from legacy drugs represents a 3% growth headwind that would amount to an additional industry-wide growth gap of about US$100 billion.
Therapeutic battlefields heating up: focusing firepower
Competition within key therapeutic areas means that not every pharma’s internally predicted share of market can be achieved. Winners and losers are likely to emerge in lucrative specialty markets (including oncology, diabetes and autoimmune diseases, like multiple sclerosis and rheumatoid arthritis), in an absolute sense and relative to each company’s own growth expectations. Those markets alone account for about US$200 billion in projected 2015 sales or about 40% of all prescription brand sales. Diabetes and oncology alone account for about 80% of the net branded prescription pharmaceutical sales growth over the next five years.
The payer pressure described above is a key reason for this competitive dynamic and the M&A that may flow from it. As multiple drugs with the same mechanism of action compete for share in a tightly defined patient population, newer entrants and existing players may sacrifice pricing power to gain or preserve market share. The more crowded markets become — and rare is the exciting oncology target or potentially lucrative autoimmune space that doesn’t have half a dozen or more companies vying for top-tier status — the more important it is for companies to soberly analyze their prospects and respond accordingly: spend firepower where one can gain share while improving future growth prospects and divest in those areas where one is likely to become an also-ran. (Increasingly, companies have been pooling resources within narrow sub-sectors, creating partnerships and JVs that provide optionality for entering or exiting particular slices of each market as pipelines mature.)
Oncology: new entrants challenge incumbents
Very few large companies have proven immune to the lure of the oncology market. Its perceived regulatory and reimbursement advantages combined with significant unmet medical need have just about every company jockeying for a top-tier position — but obviously not everyone can be a winner.
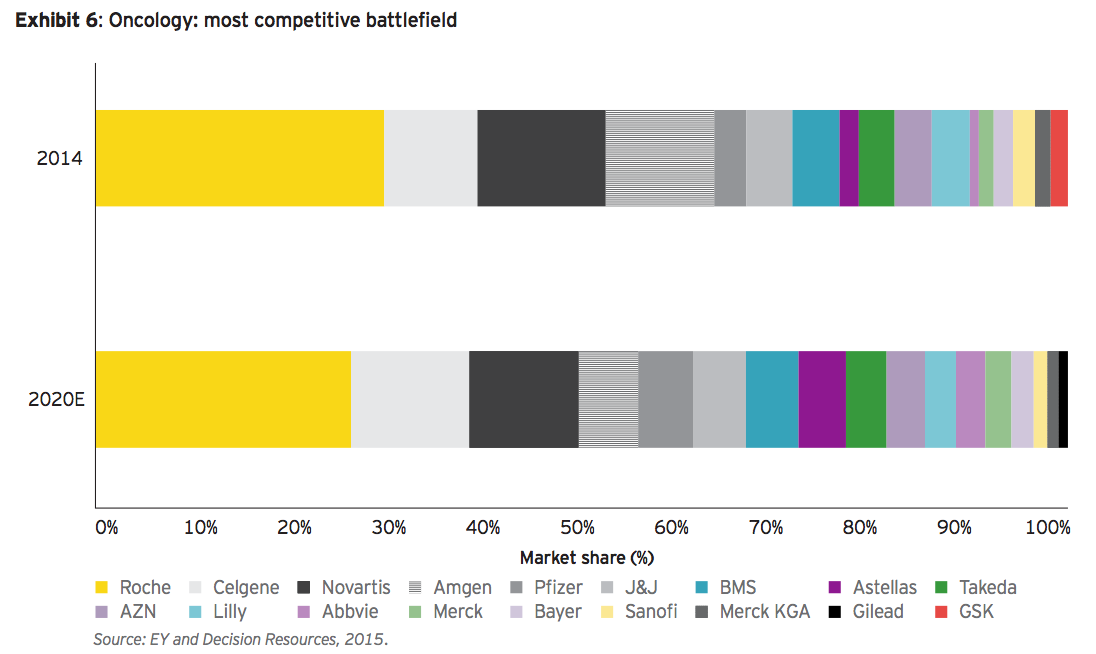
As the largest, fastest-growing category, oncology is projected to exceed US$100 billion by 2020, with some 20 competitors vying for significant share (see exhibit 6). These include long-established leaders like Roche and Novartis, as well as prominent biotechs such as Celgene. Newcomers Gilead and AbbVie, however, have a foothold and the firepower to significantly expand their presence. It’s also worth pointing out that biotechs’ growth rate in oncology is twice that of big pharmas’.
There are few targets that can move the commercial needle in oncology, so while several majors battle for share of this nearly US$100 billion market, we should expect players in the bottom half of this group to think strategically about their future presence in the oncology arena.
Diabetes: still (too) crowded
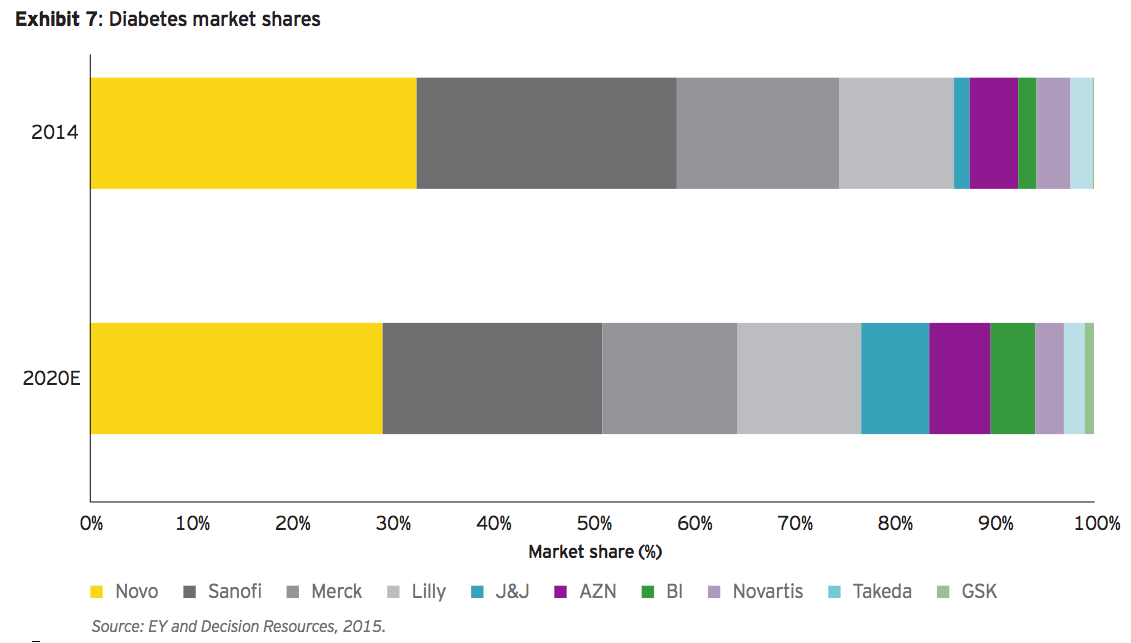
As a growth category, diabetes is second only to oncology. And therefore it’s no surprise that at least a dozen players are crowding into its projected (2015) US$40 billion brand market (see exhibit 7). Of the established diabetes companies, only Bristol-Myers Squibb Co. has exited the space. The top four players’ combined market share peaked at 85% in 2014 but should decline as new entrants emerge and pricing affects legacy franchises — particularly insulins, as we saw in the case of Sanofi.
With projected 7% CAGR through 2020, diabetes remains an attractive growth market. But with the bottom five players projected to have only 10% in aggregate market share, and with very few growth targets in this space, rising payer headwinds are likely to drive further consolidation. Remaining players will be increasingly looking beyond core diabetes therapeutics toward novel drugs that treat complications such as chronic kidney disease and neuropathic pain, expanding the field of attractive growth targets.
Autoimmune market peaking?
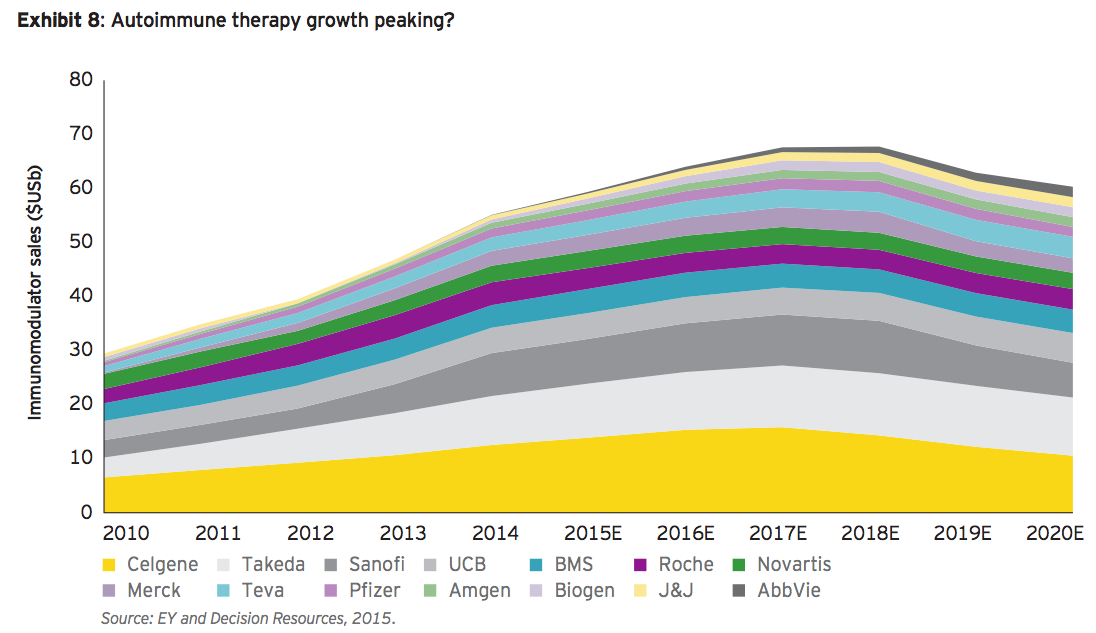
The broad autoimmune therapy market cuts across a spectrum of diseases, including multiple sclerosis, rheumatoid arthritis, psoriasis and Crohn’s disease. In each of those markets across various brands in Europe, biosimilar competition has eroded market share and pricing power. Management teams’ confidence in their brands notwithstanding, biosimilars will soon arrive in the US as well. Decision Resources’ projections suggest this may be just a few years away (see exhibit 8).
Trends driving focused M&A
The broad autoimmune market includes multiple sclerosis, rheumatoid arthritis, psoriasis and Crohn’s disease. In each of those markets across various brands in Europe, biosimilar competition has eroded market share and pricing power.
The trends we are seeing across therapeutic battlefields can drive focused M&A in multiple ways:
• Payers’ ability to enhance competitive pressures among brands puts a premium on first-in-class, provided there’s enough distance between an innovator product and the me- too offerings that follow.
• In areas where combination therapy is not only common but essential, such as oncology, owning an entire regimen gives companies pricing flexibility and means they’re not tied to the whims of a partner trying to employ an orthogonal strategy. Using M&A to gather all the pieces to a particular therapeutic puzzle will continue to drive targeted dealmaking.
• The only volume growth available to late market entrants, or the fourth or fifth best drug in a particular class, is likely to come at the expense of pricing power or on the margins of a patient population. Companies in these predicaments should pursue divestiture strategies. We’ve already seen a few deals where large companies strengthened leading franchises by swapping out losing ones.
Divesting as M&A strategy
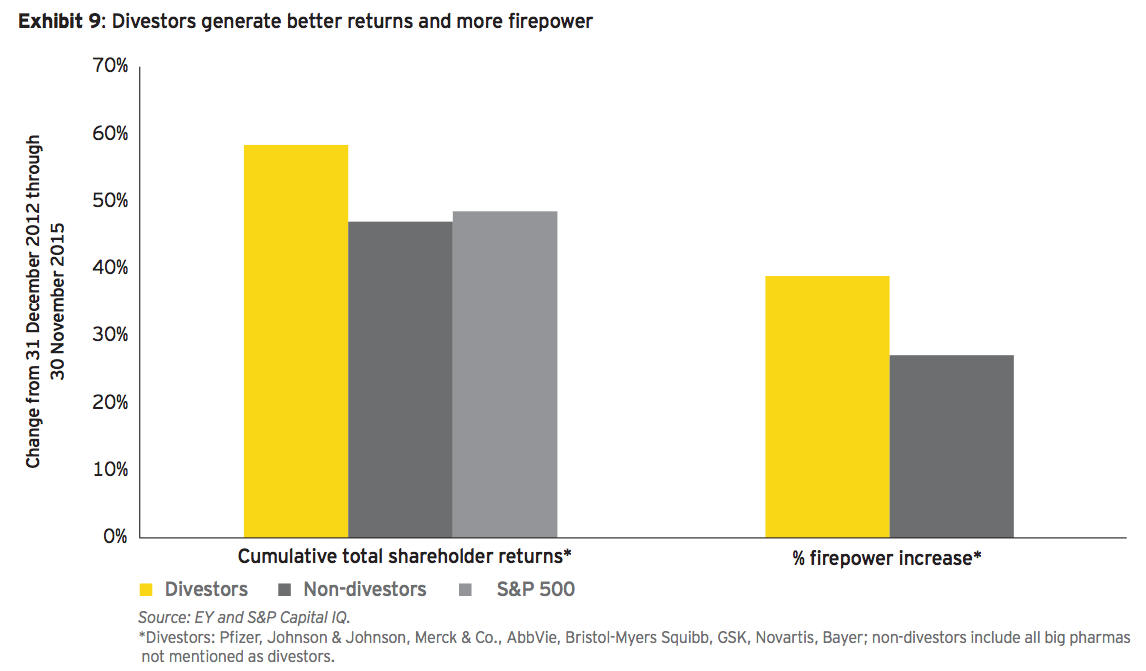
While acknowledging other fundamentals affect results, it’s worth noting that divesting companies have outperformed non-divestors in cumulative TSR by 11% over the past three years. More significantly, divestitures generate more firepower to support M&A.
Not only do divestitures increase firepower for potential bolt-on or transformative deals, companies that have been active strategic divestors are being rewarded by the capital markets (see exhibit 9).
Since the recent wave of divestitures that began in early 2013, shareholders in big pharmas that have executed divestitures have enjoyed superior total shareholder returns compared to investors in a cadre of otherwise similar companies.
While acknowledging other fundamentals affect results — including growth, product approvals and currency — it’s worth noting that divesting companies have outperformed non-divestors in cumulative TSR by 11% over the past three years or about 3.8% per year. Moreover, those non-divestors actually trailed the S&P 500 by 2%. (That’s less than 1% per year, but for institutional investors, beating this benchmark is important; small wonder investors have been divestiture advocates over the past few years.)
More significantly, divestitures generate more firepower to support M&A. So while all companies have enjoyed expanding firepower over the past three years, divestors are up on average 39% vs. just 27% — annual increases of approximately 12% vs. 8%. Divestors have, on average, increased firepower by about US$10 billion more than those who did not. That difference can, and has, been deployed into new M&A.
Should the payer pushback gap emerge, however, and growth in the pharmaceutical market slow, the urgency to use that firepower to plug pipeline gaps and gain a step on (or catch up with) rivals is more likely to increase.
GlaxoSmithKline’s decision in 2014 to effectively trade its fledgling oncology business to Novartis for a subscale vaccines division (where GSK is already a leading player) and Merck’s decision to exit consumer health reflect a broader approach to the win-or-divest strategy. The mid-December 2015 transaction announced between Sanofi and Boehringer Ingelheim — whereby Sanofi gains Boehringer’s consumer health business and €4.7 billion in exchange for Sanofi’s animal health unit Merial — demonstrates that others are pursuing similar swaps that play to their respective strengths.
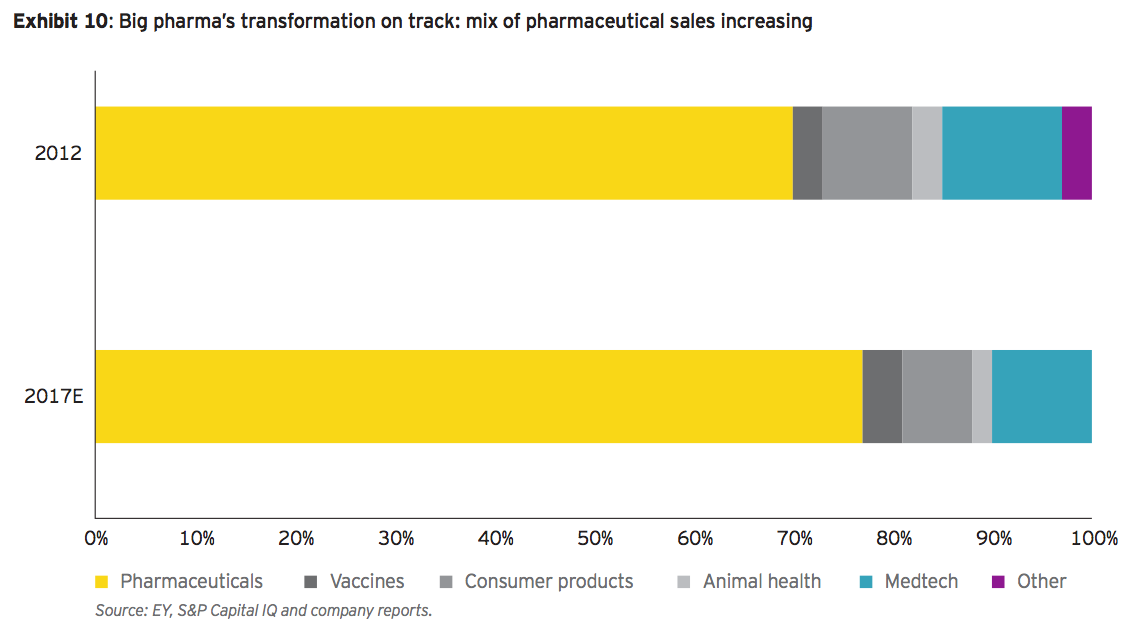
Some companies will remain diversified, but in the aggregate, big pharma’s shift toward core pharmaceuticals continues — and has just accelerated with the Pfizer-Allergan deal (see exhibit 10). The sub-sector’s proforma 2017 sales mix is now expected to rise to around 77% pharma compared to just 70% in 2012, before this recent wave of M&A. Assuming a few more non-core divestitures and a focused firepower M&A strategy along the lines we have described here, sales could reach 80% pharma by 2020. Although pharmaceuticals’ faster growth and higher margins support the logic of the transformation, there are risk implications that are heightened by increased competition in therapeutic battlefields and the skirmishes biopharmas continue to wage with payers.
M&A outlook for 2016: is US$200 billion the new normal?
The collective force of payer consolidation and rising health care costs is pushing up against biopharmaceutical companies’ growth imperatives. This is the fault line underpinning the past few years’ earthquake of M&A, with aftershocks likely in 2016.
The ongoing renaissance in drug approvals and breakthrough innovation continues to propel the biopharmaceutical industry. But it coincides with growth gaps that are exacerbated by intensifying competition and payer pressure.
The remaining US specialty pharma companies have emigrated or have been acquired — Pfizer’s acquisition of Hospira eliminated the last major specialty pharma headquartered in the US. Competition for targets from tax-advantaged specialty pharma companies has declined significantly with Pfizer’s acquisition of Allergan and Valeant’s firepower squeeze. Specialty companies will continue to pursue inorganic growth, but high levels of debt and shrinking equity valuations have combined to decimate specialty pharma’s aggregate firepower. Barring any real progress on preventing inversion deals (either through tax reform or anti-inversion legislation), those companies instead may be targets for similarly sized biopharma players in search of a friendlier tax domicile.
Pfizer/Allergan is more the exception than the rule, even as the wake of this new giant ship is already rocking all the others in the harbor. In the same way, Allergan’s expeditious transformation-through-consolidation made it attractive to Pfizer and led to the companies’ megamerger, this deal may spark its own ramifications. Big pharma should continue to actively pursue strategic M&A as target valuations come down from their peaks and the sub-sector’s share of firepower remains dominant. The faster-growth therapeutic areas big pharma once owned outright are now more competitive. This tougher environment coincides with many big pharmas’ decisions to relinquish the EPS-smoothing cushion of non-core businesses, leaving them more exposed to revenue, earnings and cash flow volatility. In short, the stakes are higher.
Meanwhile, the industry’s fastest-growing players — big biotechs — have the financial wherewithal to pursue M&A as a strategic growth tool, as Celgene demonstrated with its Receptos acquisition.
Biotech and pharma winners will be those relentlessly focused in therapeutic battlefields (or geographic strongholds) where they have not only a presence, but the agility and the firepower to remain top-tier players or become one by leapfrogging others. And there are now far more sources of inorganic growth from biotechs focused in single therapeutic areas or specialty pharmas with superior market presence in Europe or Asia.
This kind of strategic thinking will also maintain the pace of divestitures and bolt-on deals that have been popular over the past two years. Smaller deals designed to close therapeutic gaps should accelerate, even as increased competition among a larger group of companies with sufficient firepower to be buyers may sustain target prices.
Before the past two successive record-breaking years of accelerating M&A, the biopharma industry’s average annual deal volume was less than US$100 billion for nearly a decade. It’s not unrealistic to assert that 2014 and 2015 are outliers. After all, the extraordinary volume of the past two years can be traced to the bold aspirations of a few companies and activist shareholders. Actavis’ transformative acquisitions accounted for nearly half of 2014’s deal volume alone and, without Valeant’s hostile bid for Allergan, might have been muted. Renamed Allergan, its US$40 billion generics divestiture to Teva and subsequent acquisition by Pfizer account for two-thirds of 2015’s jaw-dropping aggregate deal value.
But the collective force of payer consolidation and rising health care costs is pushing up against biopharmaceutical companies’ growth imperatives. This is the fault line underpinning the past few years’ earthquake of M&A: the inversions, divestitures and bolt-ons. With big pharma growth gaps potentially expanding, focused M&A and divestitures are likely to accelerate. The pool of potential targets to close existing or potential growth gaps has never been greater or more diverse. So if the big pharma and biotech sub-sectors use only 20% of their available firepower in 2016, even if that firepower were to decline by 10% (and assuming zero deal flow from the specialty and generics sectors), another US$200 billion year may be on the horizon:
• Divestitures have represented about a quarter of the past two years’ aggregate M&A value. This should continue as portfolio transformation ramps up and the strategy demonstrates positive shareholder returns. Consequently, divestitures could account for at least US$50 billion in 2016 M&A.
• With payer pressure and therapeutic battlefield competition continuing apace, biotechs will be more likely to deploy their firepower. Their relatively modest, roughly US$25 billion M&A total in 2015 (as of mid-December) could rise significantly.
• Specialty pharmas’ aggressive dealmaking of the past few years may limit their activity in the near term or position them as acquisition targets, but they’ll return to the table soon enough: M&A is in this group’s DNA.
• Big pharma’s growth gaps persist for most; pro-forma 2017 analysis suggests Pfizer has effectively closed about 20% of the group’s core US$100 billion growth gap. The pressure for others to follow suit is unlikely to abate, and the momentum generated by the largest deal in industry history should not be underestimated.
The likely continued instability along this fault line suggests US$200 billion annual M&A may be the new normal. For this reason, companies need to be equipped with the requisite skills and resources to compete successfully and rewrite M&A playbooks for more nimble pursuit of multiple strategic targets.